Sen. Bernie Sanders narrowly took first in the New Hampshire primary, and Sen. Amy Klobuchar rode a wave of last-minute support to a surprisingly strong third-place finish. But the prize for most impressive performance goes to Mayor Pete Buttigieg, who came in second. More than the other candidates, he displayed the kind of broad, cross-cutting support the Democrats’ eventual nominee will need to unite a fractious party.
The outcome left the campaigns of Sen. Elizabeth Warren and former Vice President Joe Biden on life support. They finished fourth and fifth respectively, and picked up zero delegates. Two longshots, Sen. Michael Bennet and entrepreneur Andrew Yang, packed it in yesterday after barely registering in New Hampshire.
Following a lackluster showing in Iowa, Warren appears to be the “betwixt and between” candidate — neither the favorite of liberals nor moderates. Nor has she done particularly well with her presumed base of college-educated women. At this stage, it’s hard to see what she could do to start clicking with these voters.
Biden’s precipitous fall from frontrunner status suggests that his high national poll numbers may have reflected familiarity more than popularity. However, they did allow him to clog the center lane, blocking the way of other moderate candidates. If Biden doesn’t win a solid majority of black voters in South Carolina, he’s done.
After signing nearly $5 trillion of new debt into law since taking office, President Trump’s Fiscal Year 2021 budget proposal provides the clearest look yet at how he intends to govern if re-elected in November. The ironically titled “Budget for America’s Future” is anything but: it proposes to slash critical public investments that lay the foundation for long-term growth, double down on reckless tax cuts for the rich, undermine health-care and safety-net programs for millions of Americans, and leave the nation on a path of trillion-dollar deficits as far as the eye can see.
The Trump administration claims its proposals would put the federal budget on a path to balance by 2035, but this relies upon economic assumptions that are downright absurd. The Office of Management and Budget projects real gross domestic product will grow more than a full percentage point faster than does the non-partisan Congressional Budget Office every single year between 2020 and the end of the projection period. That annual difference may not sound like a lot, but it adds up: the Trump administration’s fiscal estimates depend on the U.S. economy producing nearly $25 trillion more in output over the next decade than CBO projected in its most recent budget and economic outlook.
These outlandish economic growth projections enable the Trump administration to claim that it will raise $3.1 trillion more in revenue over the next decade relative to CBO’s baseline, when in reality the administration is proposing tax cuts that would actually reduce revenue. Trump proposes to extend the individual income tax cuts created by the GOP’s 2017 tax law past their scheduled expiration in 2025. But interestingly, even as Trump proposes to extend tax cuts for wealthy individuals, his budget would not extend the few expiring business provisions that some economists believe could potentially increase domestic business investment. This omission is further evidence that Trump is underestimating the cost of his policies while overestimating the boost they would give to economic growth.
Nearly three years ago, the earliest iteration of the Neoliberal Project came about. It was in the form of a forum where economics undergraduate students could gather to discuss economics and the policy implications of the field. We called the forum r/neoliberal. We didn’t name our forum that to make a political statement from the outset, but because we wanted to poke fun at people who had previously called us that word. But quickly, people began joining at a far greater rate than we ever expected. They weren’t joining to discuss econometrics, as we originally intended. People were joining because they desired a place to discuss policymaking online that wasn’t captured by left or right-wing populists. We were radical incrementalists – as we called ourselves – and it was different from anything else out there. We knew we were onto something, and created the Neoliberal Project to launch new initiatives and house them all under one banner.
Since then, we have launched a Twitter account that now boasts 34k followers, a meetup network in 20 cities with thousands of attendees, a podcast with over a quarter of million downloads, dozens of Facebook groups and Exponents, our magazine and newsletter. We ran the Neoliberal Project with next to no money for much of its existence. Website and travel expenses had to come out of our own pockets. Everyone who has contributed to the Neoliberal Project up until this point as done so as a volunteer. I’m eternally grateful to those people, who are the only reason where we here today.
I’m proud to announce a new chapter of the Neoliberal Project today. Today, we are officially joining the Progressive Policy Institute (PPI). PPI is a storied think tank based in Washington, DC that traces it origin back as the brain trust of the Bill Clinton administration and now works with pragmatic Democrats to solve today’s toughest solutions.
WASHINGTON— The Neoliberal Project, a fast-growing network of young pragmatists, is joining forces with the Progressive Policy Institute.
“Over the last several years, we have built the Neoliberal Project into an online community of politically engaged young individuals who are pushing back against the ideological extremes that put our country in peril,” said Colin Mortimer, the Neoliberal Project’s executive director.
“Now we are proud to join one of the most storied think tanks in the country, as we develop and advocate for a radically pragmatic agenda for change our country so urgently needs,” he added.
The Neoliberal Project attracts the next generation of people who identify with the liberal values on which America has built the world’s most vibrant and diverse democracy: competitive markets, robust public investment, a strong welfare state, and social pluralism and tolerance. Previously a part-time volunteer organization, the Project boasts a Twitter account with 34,000 followers, meetup networks in 20 cities, a podcast with over a quarter of million downloads, dozens of Facebook groups and pages and Exponents, a magazine and newsletter.
“PPI is thrilled to team up with the Neoliberal Project,” said Will Marshall, President of PPI. “The Neoliberal Project brings a fresh voice to the nation’s political conversation — thousands of enterprising thinkers, writers, and doers who are determined to lean against the forces that our polarizing America. They fill a vacuum in our politics for a pragmatically liberal alternative to right-wing populism and democratic socialism.”
Adds PPI Executive Vice President Lindsay Lewis, “The Neoliberal Project has created a grassroots network of new leaders to support and reinforce the work of like-minded political leaders at all levels of government.”
Colin Mortimer joins PPI as Director of the Neoliberal Project and economic policy analyst, alongside Jeremiah Johnson, director of the project’s podcast and digital programming, who joins as a non-resident PPI Fellow.
For more background and details,read this post on Medium. CONTACT: media@ppionline.org, 202-525-3926
###
The Progressive Policy Institute is a catalyst for policy innovation and political reform based in Washington, D.C. Its mission is to create radically pragmatic ideas for moving America beyond ideological and partisan deadlock.
Founded in 1989, PPI started as the intellectual home of the New Democrats and earned a reputation as President Bill Clinton’s “idea mill.” Many of its mold-breaking ideas have been translated into public policy and law and have influenced international efforts to modernize progressive politics.
Today, PPI is developing fresh proposals for stimulating U.S. economic innovation and growth; equipping all Americans with the skills and assets that social mobility in the knowledge economy requires; modernizing an overly bureaucratic and centralized public sector; and defending liberal democracy in a dangerous world.
In a perfect example of unintended consequences, restaurant workers are pushing back against a nationwide campaign by labor advocates intended to raise their wages. They worry that the advocates’ push will cost them more in lost tips than they’ll gain in mandated wage increases – and cut their income overall.
These workers have found an ally in New York Governor Andrew Cuomo, who has come up with a sensible compromise that strikes a balance between overdue increases in the minimum wage and protecting workers who rely on tips.
Under federal law the minimum “cash wage” for tipped workers is $2.13 an hour, with tips making up the rest of workers’ pay. If tips don’t bring the worker up to the full federal or state minimum wage (whichever is higher), the employer is required by law to make up the rest. However, advocates’ “One Fair Wage” campaign aims to eliminate the tipped wage at the state level.
Seven states – California, Nevada, Alaska, Oregon, Washington, Montana, and Minnesota – have eliminated the tipped wage, requiring employers to pay the full minimum wage plus tips. This has drawn furious protests from both restaurant workers and owners, who say it means lower pay and lost jobs.
A 2018 survey by restaurant platform Upserve found that workers overwhelmingly – by 97 percent – prefer the tipped system to the full minimum wage. In Maine and Washington, D.C., restaurant workers led efforts to reverse laws passed under pressure from the One Fair Wage campaign.
Enter Governor Cuomo. In December, Cuomo’s Labor Department issued an order eliminating the tipped wage for some service sector occupations such as nail salon workers, hairdressers, and valet parking attendants, while retaining it for the restaurant industry. Cuomo’s rationale was to combat wage theft in those industries with the highest risk, while preserving the tipped wage system for restaurant workers who earn more than they would receiving the full minimum wage.
It’s been a popular move. Data from the Bureau of Labor Statistics show the annual median wage of waiters and waitresses, including tips, to be higher in New York than every state that has eliminated the tipped wage, and the annual median wage of bartenders to be higher in six of the seven states.
As PPI wrote in 2018, studies have shown that raising the tipped wage does not increase wages for restaurant workers because diners often end up tipping less. For instance, Census Bureau economist Maggie Jones found that raising the tipped minimum wage “increase[s] that portion of wages paid by employers, but decrease[s] tip income by a similar percentage.” Concern about declining tips and lower wages is why many restaurant workers have opposed an increase in the tipped minimum wage.
Restaurateurs also favor the tipped wage, as it enables owners to succeed in an industry with notoriously razor thin profit margins of 3 to 5 percent. Many owners cite having to close or cut hours (and thus wages) if faced with higher labor costs from raising or eliminating the tipped wage. When San Francisco increased its minimum wage from $13 an hour to $14 an hour in July 2017, bar owner Miles Palliser was forced to close after 5 years. “I think that the dramatic rise in minimum wage definitely affected us at the Corner Store and probably all three of our places in some fashion,” he told the San Francisco Chronicle at the time.
Governor Cuomo’s compromise is a win-win for both restaurant workers and owners. Other states should follow New York’s example.
“The PPI community mourns the death last week of Jim Kiss. Jim was “present at the creation” of PPI in 1989. He served not only as a founding member of our Board of Trustees but also as an enthusiastic recruiter of other prominent figures. Jim was the quintessential “New Democrat” – optimistic, forward-looking, pragmatically progressive and a fervent believer in the power of ideas to change the nation’s political trajectory. The gregarious kid from Philadelphia loved baseball and the Democratic Party and carried on until the end a lively conversation about politics with a wide network of highly accomplished friends and admirers.
I was lucky to count Jim as both a friend and a mentor in the arts of public relations and communications. We at PPI will miss him, and we extend our condolences to Jim’s beloved wife, Jeanne Marie, and many friends in his adopted state of Georgia.”
Senate Republicans turned President Trump’s impeachment trial into a farcical exercise in partisan whitewashing. That leaves the job of canceling Trump’s reality show presidency to U.S. voters.
A heavy responsibility thus lies on Democratic caucus and primary voters as they start selecting their party’s nominee next week. If they make the wrong choice, it means four more years of Trump’s corrosive assaults on reason, democracy, and basic human decency. For many, the right choice will require setting aside their ideological druthers and picking the candidate most likely to beat Trump in the Electoral College.
It’s hard to know at this point which candidate is most electable. It’s easier to say who isn’t—and Sen. Bernie Sanders tops the list. Despite the devotion he inspires among young left-wing activists, the self-avowed socialist is too far outside the U.S. political mainstream to be considered anything but the longest of long shots against Trump.
Some are concerned that subprime auto loans – which offer higher interest loans to riskier borrowers – pose a threat to the stability of the global economy in much the same way that the subprime mortgage market contributed to the Great Recession. Democratic presidential candidate Elizabeth Warren, in particular, has raised the warning flags as part of her campaign. But these worries are ill-founded and based on misleading data and faulty analogies.
In particular:
Auto loans account for a relatively small percentage of the increase in nonfinancial debt over the past five years;
Americans are spending less of their budgets on car purchases today, including finance charges, than they were before the recession;
Low-income households saw motor vehicle purchases and finance charges fall from 8.5 percent of household budgets in 2000 to 4.9 percent in 2018;
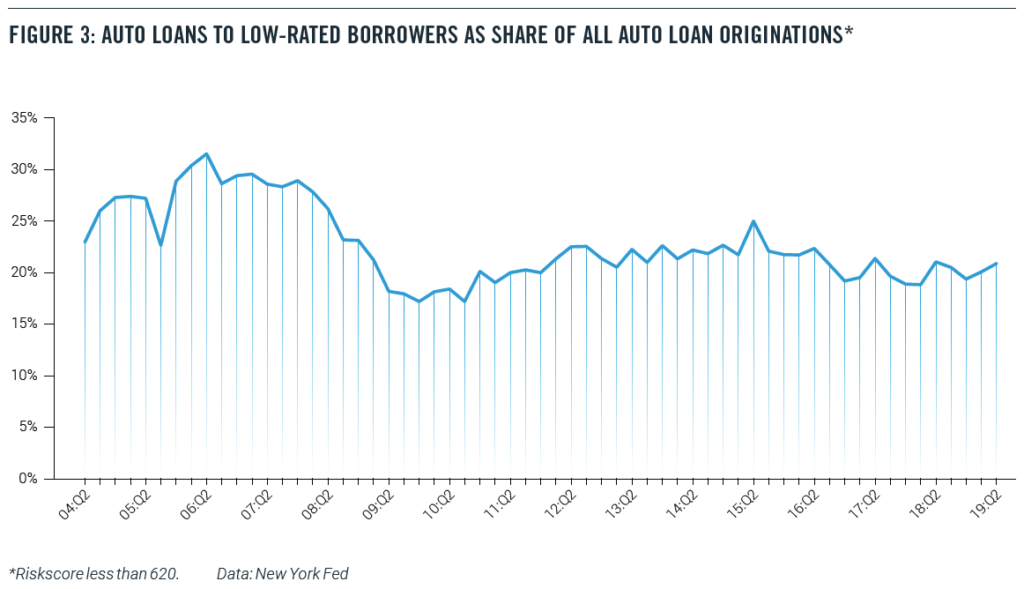
Over the past five years, the share of new auto loans going to low-credit borrowers has remained relatively constant. There are no signs that low-credit borrowers are either being frozen out of the market or becoming too large a share of loans;
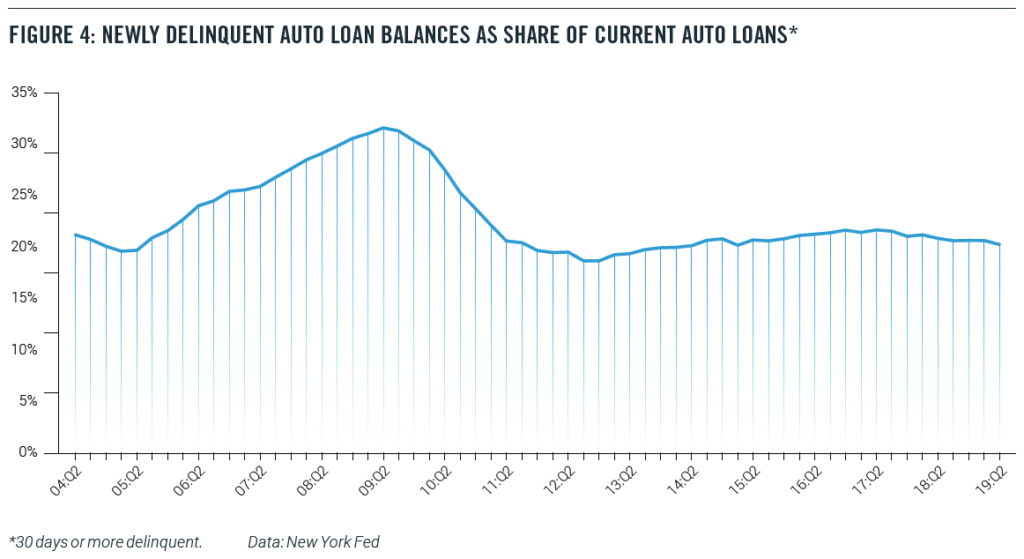
Newly delinquent auto loans, as a percentage of current balances, have been falling over the past two years; and
Subprime auto loans differ significantly from subprime mortgages in key respects that make them less likely to pose a serious threat to financial stability
Risk-based pricing of auto loans appears to be working so far, keeping low-income borrowers in the market without driving up delinquencies or to low-income consumers, while not posing the same risk that the subprime mortgage market.
Introduction
To purchase a vehicle, Americans with low or non-existent credit scores often use auto loans with higher interest rates than loans to prime borrowers. Some market watchers have indicated concern about “subprime” auto-loan trends and the potential for a crisis similar to the subprime mortgage crisis that heralded the last recession.
The subprime mortgages and the related mortgage-backed bonds remain the classic case of a poorly executed financial innovation. The initial impetus behind the idea was a good one. Housing is a key element of middle-class wealth, so expanding the system of mortgage finance to help lower-income households buy homes seemed like a positive. However, the subprime mortgages and bonds were designed in such a way that they assumed rising housing prices. When housing prices started to fall, the subprime mortgage system collapsed and contributed to the financial crisis.
Will subprime auto loans create the same problems? In a recent essay, Democratic presidential candidate Senator Elizabeth Warren raised the warning flag:
Auto loan debt is the highest it has ever been since we started tracking it nearly 20 years ago, and a record 7 million Americans are behind on their auto loans — many of which have similar abusive characteristics as pre-crash subprime mortgages1 .
Warren is not alone in her worries. In late 2016, for example, the Office of the Comptroller of the Currency warned that auto-lending risk was increasing and that banks (and other investors in securitized assets) did not have sufficient risk-management policies in place. Fed Governor Lael Brainard pointed to subprime auto lending as an area of concern in a May 2017 speech, while analysts worried about “deep subprime” auto loans2. Some groups used the term “predatory” auto lending.3
But these concerns are misplaced. As we will show later in this paper, the statistic cited by Senator Warren does not reflect the current state of the auto loan market, as it includes old loans from much weaker economic times. Perhaps most fundamental to understanding the problem with drawing a parallel between the mortgage crisis and today is the fact that subprime mortgages and subprime auto loans are very different products.
Naturally, lower-income households with low credit scores or limited credit history may have fewer financial resources and be inherently riskier borrowers. Moreover, the fact that motor vehicles depreciate over time means that the collateral for the loan becomes less valuable.
Nevertheless, the ability to own a car and, therefore, access credit is crucial for this population. Risk-based pricing charges low- rated borrowers higher interest rates, but in return, offers them the opportunity to borrow money to buy a vehicle that might otherwise be financially inaccessible.
For many lower-income households, their vehicle is the single biggest asset they own.
While vehicles do not appreciate in value as homes do, vehicles are income-producing assets in the sense that they are often essential for commuting to work, especially in non-urban areas. As one report noted, “Owning a car is the price of admission to the economy and society in much of America.”4
In this paper, we analyze the auto loan market, paying particular attention to auto loans made to low-income Americans and to people with bad credit. We find that:
Auto loans account for a relatively small percentage of the increase in nonfinancial debt over the past five years;
Americans are spending less of their budgets on car purchases today, including finance charges, than they were before the recession;
Low-income households saw motor vehicle purchases and finance charges fall from 8.5 percent of household budgets in 2000 to 4.9 percent in 2018;
Over the past five years, the share of new auto loans going to low-credit borrowers has remained relatively constant. There are no signs that low-credit borrowers are either being frozen out of the market or becoming too large a share of loans;
Newly delinquent auto loans, as a percentage of current balances, have been falling over the past two years; and
Subprime auto loans differ significantly from subprime mortgages in key respects that make them less likely to pose a serious threat to financial stability.
Risk-based pricing of auto loans appears to be working so far, keeping low-income borrowers in the market without driving up delinquencies or threatening the financial system. We conclude that the subprime auto loan market is beneficial to low-income consumers, while not posing the same risk that the subprime mortgage market did before the financial crisis. While it will be instructive to observe subprime auto loan trends going forward, current trends do not indicate significant instability concerns in this market.
Recent Patterns in Debt Accumulation
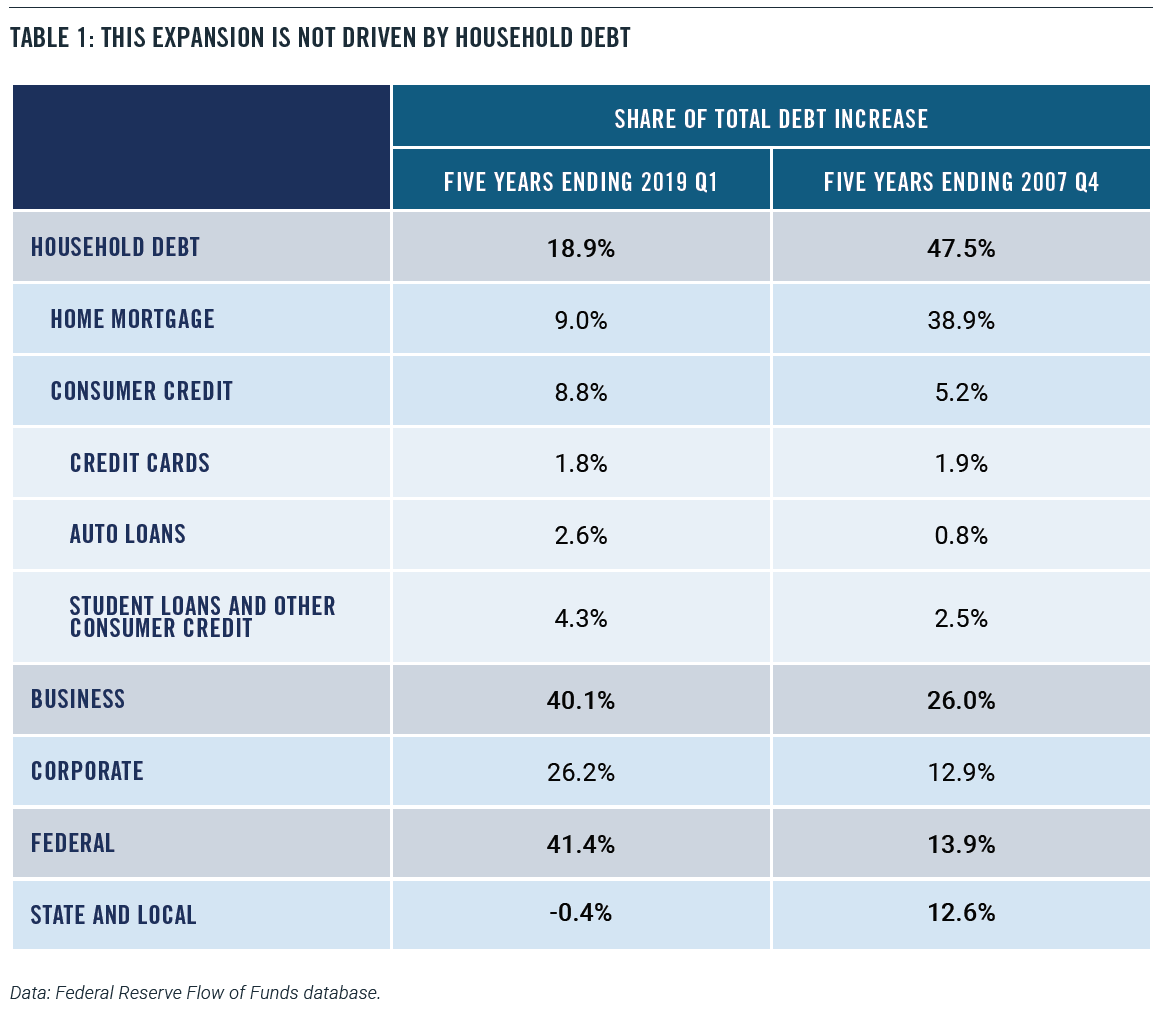
Recent patterns in debt accumulation are very different from those that preceded the financial crisis and Great Recession. Non-mortgage consumer credit – including auto loans, credit cards, and student debt – has risen by $900 billion over the past five years, according to Federal Reserve data. While that figure sounds substantial, that increase amounts to less than 9 percent of the total increase in domestic nonfinancial debt – that is, all debt except borrowing by financial institutions. The rise in consumer borrowing is dwarfed by the increase in business debt ($4.1 trillion) and federal debt ($4.2 trillion) over the same period. Those two categories together account for 82 percent of the increase in domestic nonfinancial debt (Table 1). The leading contributors to business debt growth are mortgages and corporate bonds.
Indeed, businesses have taken the greatest advantage of low-interest rates. Nonfinancial corporations have almost doubled their outstanding corporate bonds since the end of 2007 when the last recession started. Meanwhile, household debt has risen by only 10 percent.
Taking home mortgages into account, households have only accounted for 19 percent of the increase in domestic nonfinancial debt since 2014. By contrast, in the five years leading up to the Great Recession, households accounted for 48 percent of the debt increase. In other words, the financial boom in the pre-recession years was heavily driven by household borrowing, while households have only contributed a small portion to the current debt increase.
A skeptic could argue that, given derivatives and financial engineering, it’s possible for a relatively small portion of the debt market to drive an outsize increase in risk for the whole system. Indeed, that’s what happened ahead of the 2008 financial crisis. In May 2007, then-Chairman of the Federal Reserve Ben Bernanke famously said, “We believe the effect of the troubles in the subprime sector on the broader housing market will be limited, and we do not expect significant spillovers from the subprime market to the rest of the economy or to the financial system.”5 At the time, the value of subprime mortgages was about $1.3 trillion, which was only 10 percent of the mortgage market and an even smaller share of total borrowing. Bernanke and other policymakers figured that the problems in subprime mortgages could be easily contained.
What Bernanke and others failed to reckon with, however, was how the subprime mortgages had been designed to make sense only in a rising real estate market. Subprime mortgages were constructed effectively to subsidize interest rates with the possibility of appreciation. These financial instruments would offer low upfront rates that enabled lower-income borrowers to qualify. When the teaser rates eventually reset to much higher levels, the assumption was that the borrower could refinance into a new mortgage.
Moreover, the subprime mortgages were then securitized and used to build complicated financial derivative products. And when the subprime mortgages failed because of declining home prices, so did the derivatives. In other words, problems in a relatively small financial sector could be amplified and have a much larger effect on the rest of the economy.
Despite this concern, there is evidence to suggest that subprime auto lending is not a substantial risk to the broader economy. Auto loans are only 7.4% of household debt, which is the 40-year historical average.6 Moreover, the auto asset-backed securities (ABS) market is likewise dwarfed by the mortgage-backed securities (MBS) market. As of the second quarter of 2019, there was a mere $264 billion in auto-related securities, which included only $55 billion in subprime auto securities. By comparison, the amount of outstanding mortgage-related securities came to almost $10 trillion.7
Further, subprime auto loans don’t work the same way that subprime mortgage loans did in the pre-crisis era. Cars and trucks depreciate steadily over time, so the value of the collateral diminishes. That means lenders can’t afford to offer teaser rates, or excessive levels of negative equity, to buyers with low credit scores. They must charge higher rates, properly pricing risk. As one article put it, “the very nature of a real estate loan is very different from an auto loan. Real estate is an investment that typically appreciates over time. During the bubble years, consumers and lenders falsely believed appreciation would bail them out from poor judgment. Vehicles, on the other hand, depreciate. There is no false hope of higher values in the future to bail out a borrower or a lender.”8
The Auto Market
Despite the relatively small role that consumer debt is playing in the current debt expansion, some people can’t shake the idea that Americans are over-spending and over-borrowing to maintain a particular lifestyle. Consider this quote from an April 2019 piece from Business Insider:
The fact that America’s top-selling vehicle — a Ford truck with a price starting at nearly $30,000 – and many like it cost nearly half the median household income hasn’t stopped people from buying them and hasn’t stopped lenders from facilitating loans.9
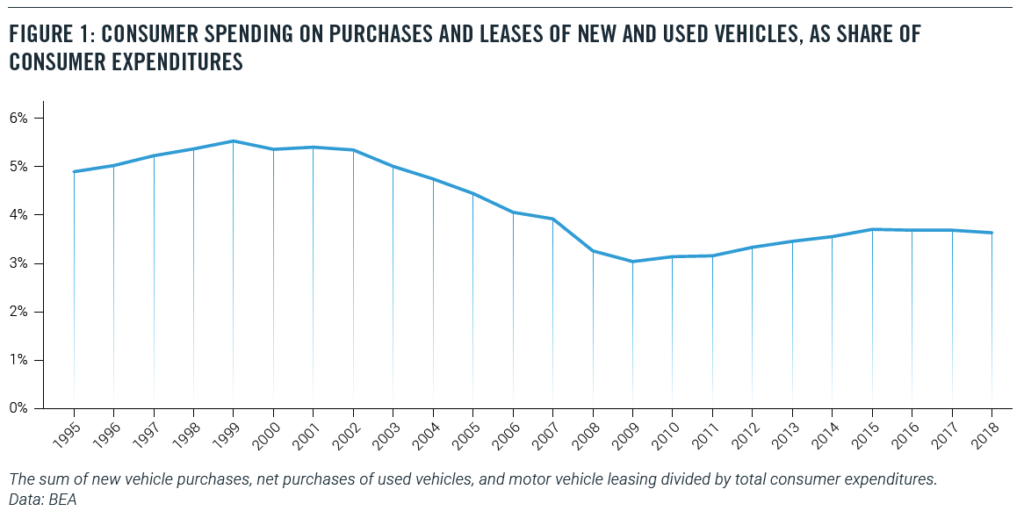
Over the past five years, the price of new motor vehicles has risen by only 1.1 percent, according to estimates by the Bureau of Economic Analysis (BEA).10 By contrast, the overall price level of consumer goods and services have risen by 6.7 percent over the same stretch.11 In other words, the relative price of new motor vehicles has fallen over this period.
Not surprisingly, the share of consumer spending on new and used vehicles has fallen as well. In 2000, 5.4 percent of consumer spending went to purchases and leases of new and used vehicles. Today, that share is down to 3.6 percent (Figure 1).12
The BLS Consumer Expenditure Survey tells the same story. In 2000, motor vehicle purchases and finance charges amounted to 9.7 percent of household outlays. As of 2018, the last year for which full data is available, the share of vehicle purchases and finance charges fell to only 6.7 percent of household outlays.13 In part, this decline may represent a lengthening of the term of auto loans.14 (These figures would not be changed much by including automobile lease-related payments, which amount to about 10 percent of automobile purchase-related payments in 2018.)
The State of the Low-Income Auto Market
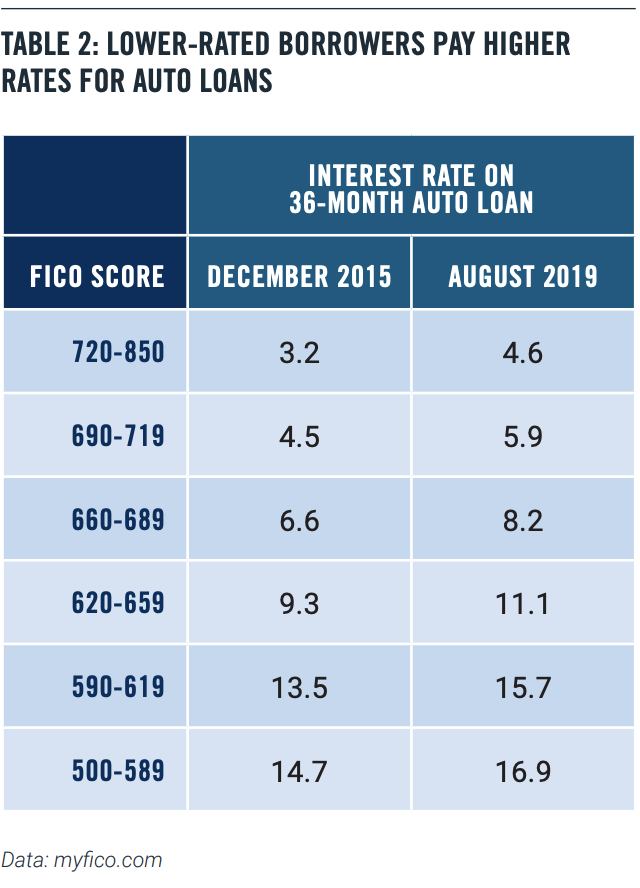
It’s not surprising that lower-rated borrowers pay more for their auto loans. Table 2 below shows interest rates for a 36-month new car loan at different credit rates for December 2015, which was close to the bottom of the credit cycle, and August 2019 (Table 2).
We can see that rates have risen for all credit-rating levels, but more so for the low-rated borrowers.
This risk-based pricing means that low-rated borrowers are not frozen out of the auto loan market. That’s good news, since, in many parts of the country, a car or truck is a necessity, even for low-income households. There is little or no public transit outside of densely populated urban areas, and ride-sharing services are not viable alternatives in many places. So, it is unsurprising that the share of low-income (the bottom quintile) households with a vehicle hold steady at 66 percent in both 2000 and 2018.
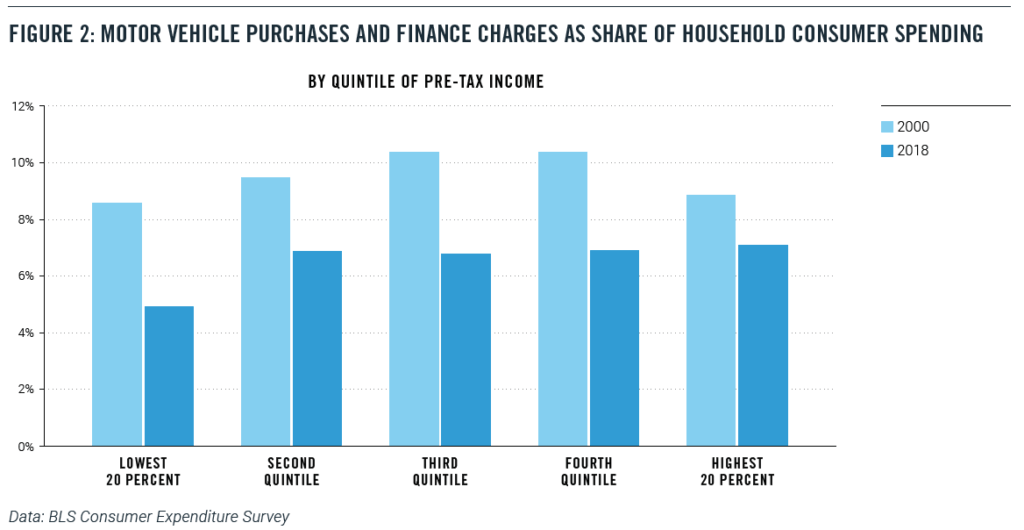
At the same time, low-income households saw motor-vehicle purchase and finance taking a smaller share of their budgets. In the bottom quintile of pre-tax income, motor vehicle purchases and finance charges fell from 8.5 percent of household budgets in 2000 to 4.9 percent in 2018 (Figure 2), a drop of almost four percentage points.15
Similar data from the New York Fed’s Household Debt and Credit Report confirm that low-income households are not being uniquely stressed financially by automobile borrowing. Figure 3 shows the share of all auto loan originations that are going to low-rated borrowers (with a Riskscore of less than 620). Before the financial crisis, about 30 percent of new auto loans were going to low-rate borrowers, a startlingly high percentage. That share fell to 20 percent after the crisis and shows no signs of rising (Figure 3).16
The biggest piece of negative news has come from the New York Federal Reserve’s well-publicized finding in February 2019:
…(T)here were over 7 million Americans with auto loans that were 90 or more days delinquent at the end of 2018. That is more than a million more troubled borrowers than there had been at the end of 2010 when the overall delinquency rates were at their worst since auto loans are now more prevalent.18
This startling number, while impressive, simply doesn’t mean what it seems to suggest. This figure includes anyone who still has an old, bad auto loan on their credit record, even if the loan was made and written off years earlier.19 In fact, even after the lender writes off the loan, the loan servicer could continue to report the account to the credit bureaus.
The recent economic history of the United States helps to explain this figure. The number of nonfarm jobs did not return to pre-recession levels until 2014, while the employment-population ratio for Americans with a high school diploma but no college did not bottom out until 2015. As a result, today’s subprime borrowers are carrying around bad loans from the days when the labor market for less-educated workers was still struggling.
Indeed, in an August 2019 blog item, New York Fed economists recommend that anyone interested in the current performance of debt should look at the transition into delinquency- that is, a chart such as Figure 4.20 And by that measure, auto loans are doing far better than in the pre-recession years.
Conclusion
In the event of a recession or a significant economic slowdown, auto loan delinquencies will predictably rise. Subprime auto borrowers, who are more likely to have fewer resources, will be likely to fall behind in their payments when times turn bad.
Nevertheless, a careful look at the data does not suggest that either the origination of subprime auto loans or the exposure of the broader macroeconomy to the auto loan market is a cause for concern. In particular, the subprime auto-loan market looks nothing like the mortgage market before the Great Recession.
Newly delinquent auto loans, as a percentage of current balances, have been falling over the past two years, and the fact that a record number of Americans have a bad auto loan on their credit record is a testimony to economic history more than current loan practices and economic conditions, particularly given the rapid rise in total car sales during this period.
Indeed, risk-based pricing in the auto loan market appears to be supplying a steady flow of credit to low-rated borrowers without imposing excess stress on the financial system.
About the Authors
Michael Mandel is Chief Economic Strategist of the Progressive Policy Institute.
Douglas Holtz-Eakin is President of the American Action Forum.
Thomas Wade is Director of Financial Services Policy of the American Action Forum.
With partisan divisions as deep as ever, both sides can agree on one thing: Everybody wants to avoid another financial crisis. And forecasters have recently identified subprime auto loans as an existential threat to the economy.
Worries about subprime auto loans — which offer higher interest loans to riskier borrowers — are ill-founded and based on misleading data and faulty analogies, our new research finds.
Australia’s raging infernos, like our Western wildfires and more devastating storms, prefigure a darker climate future for all of us without urgent action. But for President Donald Trump, the climate crisis is just another opportunity to stoke anger among the American people and further divide us.
Trump has undermined every climate protection possible, not out of any philosophical conviction about smaller government, but in large part to deliberately provoke outrage on the left, and then use the limelight to falsely portray climate-protecting policies to his base as a culture war waged by left-wing elitists against average voters.
Earlier this month, it was a White House event where he announced proposals to weaken climate protections in the National Environmental Policy Act. In fact, NEPA could benefit from reasonable reforms — not the ones Trump proposes, but, for instance, allowing the siting of clean energy infrastructure needed to rapidly cut greenhouse gas emissions. But in Trump World, creating contempt for climate protection itself, like slurring immigrants or race-baiting rhetoric, is a key ingredient in the toxic stew of cultural resentment he pre-cooks in search of alienated voters hungry for scapegoats.
The leading Democratic candidates for president have each made dozens of policy promises to voters over the past year as they campaigned for the opportunity to challenge President Trump in November. With the Iowa caucuses taking place next week, now is the right time to evaluate how these proposals add up: which candidates have given voters a credible agenda for enacting progressive change, and which have not? Although all four of the top-polling candidates offer a dramatic departure from the Trump administration’s agenda of cutting taxes for the rich, slashing public investment, and undermining health-care coverage for millions of Americans, a new analysis from the Progressive Policy Institute’s Center for Funding America’s Future finds that some are more credible than others.
PPI’s analysis determined both how candidates would pay for their new spending proposals and what proportion of those proposals were dedicated to investments in education, infrastructure, and scientific research that lay the foundation for long-term economic growth. Real federal spending on these public investments has fallen by more than 40 percent since the 1970s, and absent a dramatic course correction, the federal government will soon be spending more than twice as much on interest payments as it does on all three of these priorities combined. A credible progressive agenda would pair robust public investment with the fiscal foresight to secure those investments for generations.
How The Democratic Presidential Candidates Would Fund America’s Future
WASHINGTON— Just days before the crucial Iowa caucuses on Monday, February 3rd, the Progressive Policy Institute’s Center for Funding America’s Future has released a comprehensive new analysis of the top four candidates’ campaign proposals and how they would finance their agendas.
“If a Democrat beats Donald Trump in November, he or she will inherit a federal budget that under-invests in America’s future while running trillion-dollar deficits as far as the eye can see,” said PPI’s Director of the Center for Funding America’s Future, Ben Ritz. “PPI’s analysis shows which of the leading Democratic candidates have given voters a credible agenda for enacting progressive change and which are selling fiscal fantasies.”
KEY REPORT INFORMATION:
This report is (to our knowledge) the first comprehensive, apples-to-apples comparison of all the proposals leading candidates have offered during the 2020 campaign.
PPI’s analysis not only looks at how candidates would pay for their new spending proposals but also what proportion of these proposals are dedicated to public investments that lay the foundation for long-term economic growth.
As Democrats begin selecting their party’s nominee for president with the Iowa caucuses on Monday, voters deserve to know what policies each candidate prioritizes and how they would finance their agendas.
HIGHLIGHTS ON EACH CANDIDATE:
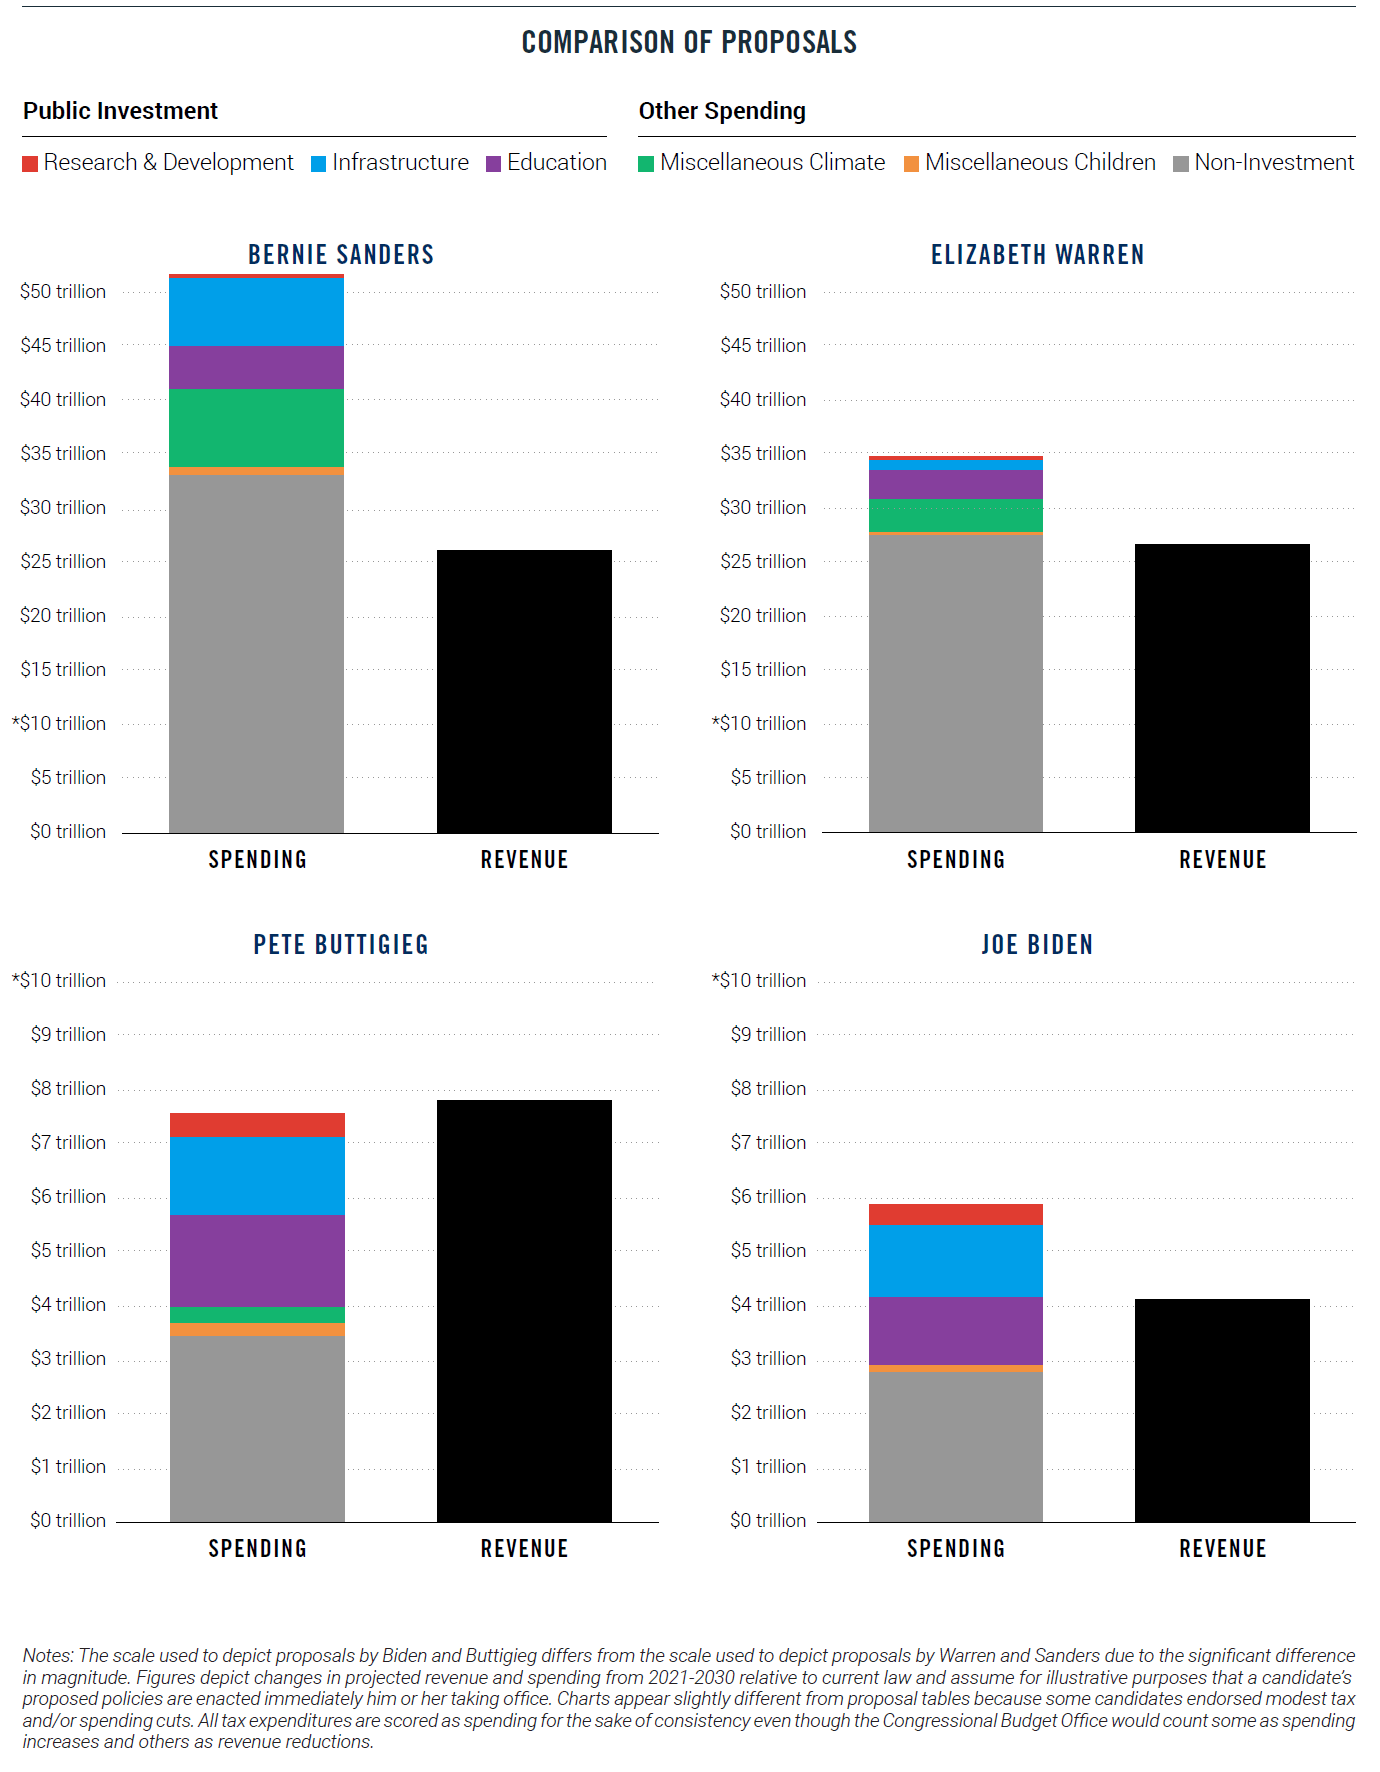
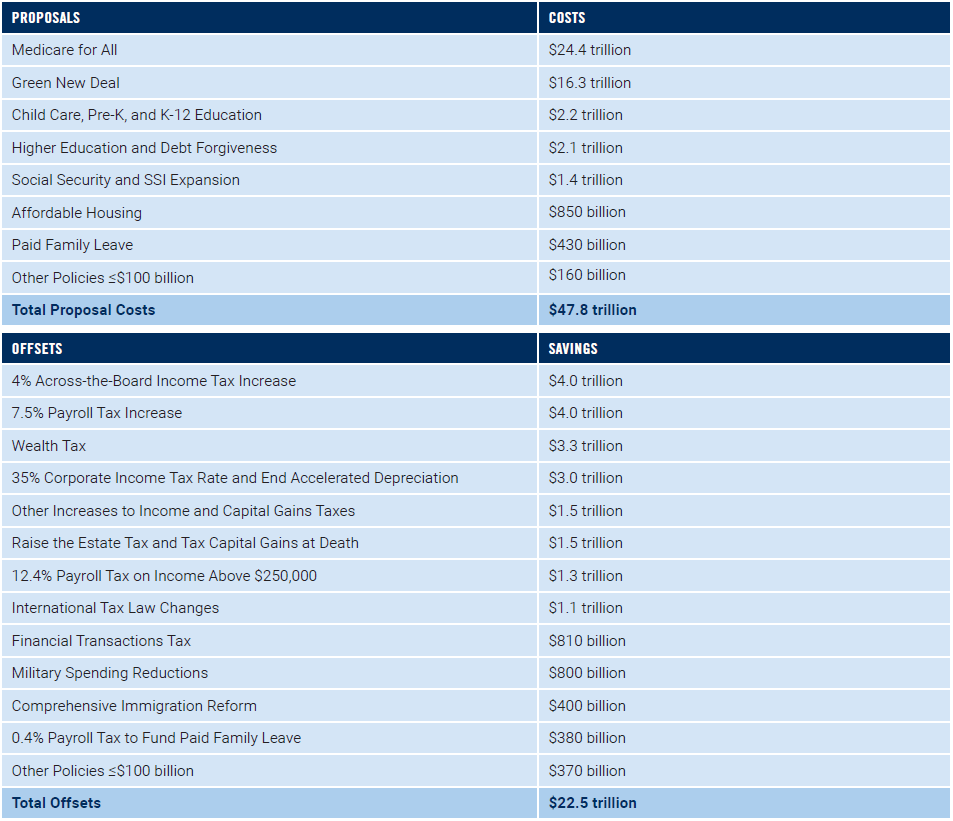
Sen. Bernie Sanders has proposed over $51 trillion of new spending over the next 10 years, more than $25 trillion of which he has offered no plans to pay for – a gap that’s greater than the value of all goods and services produced by the U.S. economy each year.
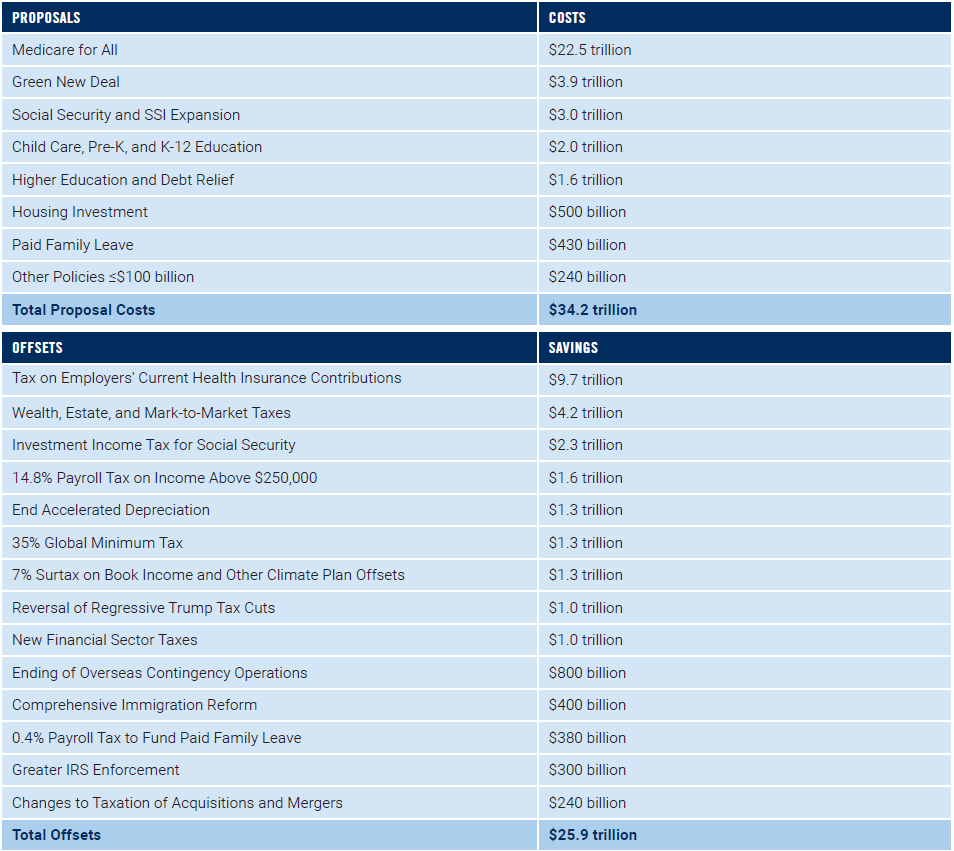
Sen. Elizabeth Warren has proposed increasing spending by $8.3 trillion more than she’s proposed raising in revenue – a gap that will be difficult to close without breaking her commitment not to raise taxes on the middle class given the number of taxes on high-income people she has already embraced.
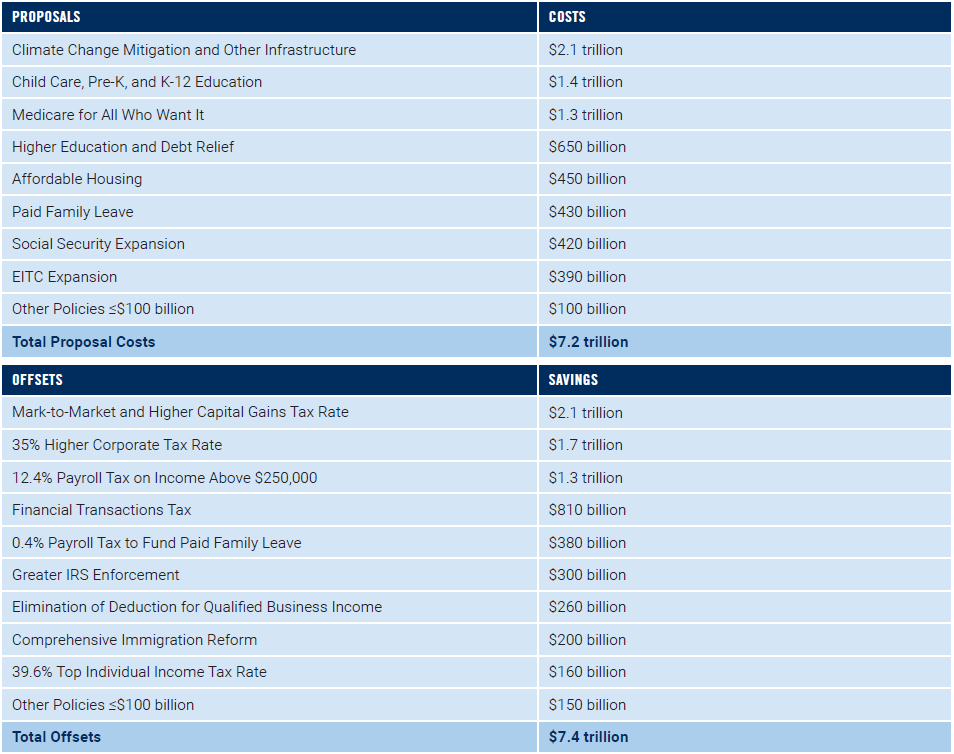
Mayor Pete Buttigieg has proposed almost $200 billion more in offsets than he has in new spending, making him the only candidate PPI examined to have already offered a complete plan for funding the entirety of his agenda.
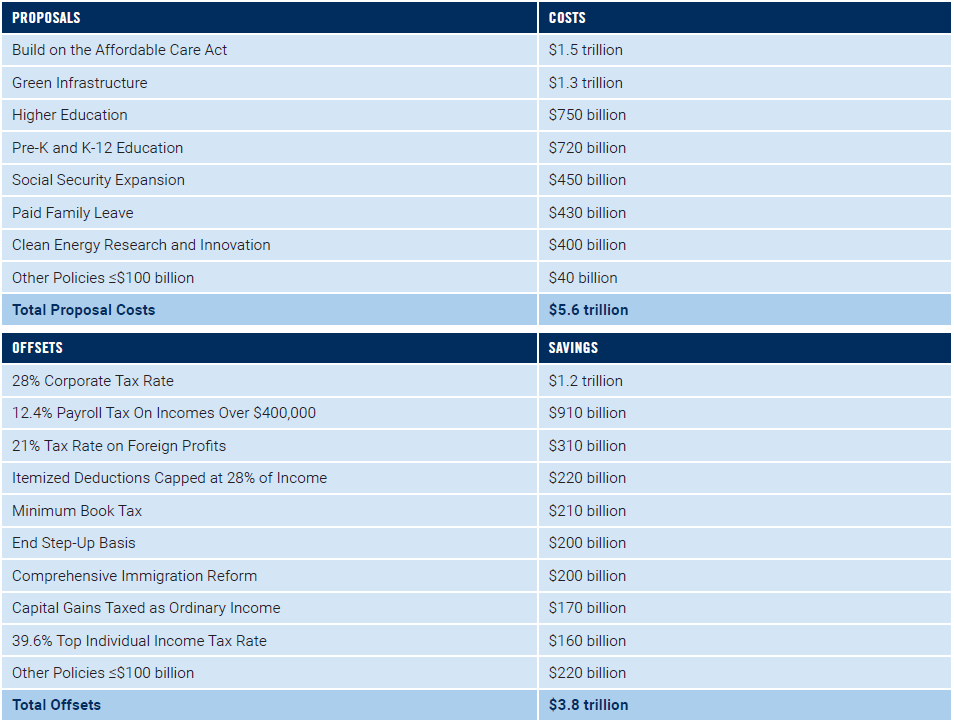
Vice President Joe Biden commits more than half of his new spending proposals to public investments in infrastructure, education, and scientific research – the highest proportion of any candidate PPI analyzed.
Ritz lauded two of the candidates examined in the report saying, “Biden and Buttigieg should be commended, not just for limiting deficits, but also for making investments in education, infrastructure, and scientific research a priority in their spending plans. These critical public investments are the foundation for long-term economic growth and have been neglected by policymakers in Washington for far too long.”
“PPI’s examination of the candidates’ spending plans show that Sens. Sanders and Warren are in a category of their own when it comes to expansive government. In particular, Sanders’ gigantic, $50 trillion spending surge makes Franklin Roosevelt look like Calvin Coolidge,” said PPI President Will Marshall.
All four leading Democratic candidates for president would offer a dramatic departure from the Trump administration’s agenda of cutting taxes for the rich, slashing public investment, and undermining health-care coverage for millions of Americans.
The Progressive Policy Institute is a catalyst for policy innovation and political reform based in Washington, D.C. Its mission is to create radically pragmatic ideas for moving America beyond ideological and partisan deadlock.
Founded in 1989, PPI started as the intellectual home of the New Democrats and earned a reputation as President Bill Clinton’s “idea mill.” Many of its mold-breaking ideas have been translated into public policy and law and have influenced international efforts to modernize progressive politics.
Today, PPI is developing fresh proposals for stimulating U.S. economic innovation and growth; equipping all Americans with the skills and assets that social mobility in the knowledge economy requires; modernizing an overly bureaucratic and centralized public sector; and defending liberal democracy in a dangerous world.
As Democrats begin selecting their party’s nominee for president with the Iowa caucuses next week, voters deserve to know what policies each candidate prioritizes and how they would finance their agendas. PPI’s Center for Funding America’s Future has compiled a comprehensive review of tax and spending proposals offered by four leading presidential candidates to help guide voters: Sen. Bernie Sanders, Sen. Elizabeth Warren, Mayor Pete Buttigieg, and Vice President Joe Biden.
This analysis breaks down how much each candidate proposes to increase spending on long-term public investment and present consumption. PPI also separates out additional spending on children and climate mitigation policies that many consider investments in the future even if they don’t clearly fall into the traditional public-investment categories of education, infrastructure, and scientific research. Finally, this analysis shows how candidates have proposed to pay for their preferred spending increases, enabling voters to understand the scope and credibility of candidates’ campaign promises.
If a Democrat unseats President Trump in November, he or she will inherit an enormous fiscal mess. The federal government is now spending $1 trillion more than it raises in revenue each year – a gap that will only grow worse as our aging population increases the costs of federal health care and retirement programs faster than the taxes needed to finance them. The shortfalls were exacerbated by nearly $5 trillion of unpaid-for tax cuts and spending increases enacted during the first three years of Trump’s presidency. According to the latest projections from the non-partisan Congressional Budget Office, our national debt is on track to reach record-high levels as a percent of gross domestic product by 2030. Meanwhile, real federal spending on public investments in education, infrastructure, and scientific research that lay the foundation for long-term economic growth has fallen by more than 40 percent since the 1970s. Absent a dramatic course correction, the federal government will soon be spending more than twice as much on interest payments as it does on all three of these critical public investments combined.
All four leading Democratic candidates for president would offer a dramatic departure from the Trump administration’s agenda of cutting taxes for the rich, slashing public investment, and undermining health-care coverage for millions of Americans. PPI finds that each candidate would increase both revenue and spending, albeit by different orders of magnitude. Sanders and Warren each propose increasing spending – particularly on present consumption – by tens of trillions of dollars, and would likely have trouble finding enough revenue sources to pay for their expensive agendas without exacerbating the enormous budget problems America already faces. Warren proposes over $8 trillion more in new spending than in new revenue over the next decade, while the Sanders shortfall is over $25 trillion – more than the total value of all goods and services produced by the U.S. economy in a year. Biden and Buttigieg, on the other hand, propose targeted spending increases that prioritize public investment and are easier to finance. Biden has proposed just $1.8 trillion more in new spending than he has in revenue increases, while Buttigieg is the lone candidate to have already offered a complete plan for funding the entirety of his agenda.
The cost or revenue effects of many policies vary considerably with assumptions, and it is likely that candidates will continue to release more details as the campaign unfolds. The figures in this analysis reflect PPI’s best estimates of the fiscal impact of the candidates’ proposals based on details that the campaigns made public prior to the date of publication. PPI also incorporated independent estimates from reliable sources, including the Committee for a Responsible Federal Budget, Congressional Budget Office, Tax Policy Center, Social Security Administration, Penn Wharton Budget Model, and various media reports. This analysis measures changes in projected revenue and spending from 2021-2030 relative to current law and assumes for illustrative purposes that a candidate’s policies are enacted immediately upon taking office. Most scores do not include the effects of interactions between multiple policies, and none include macroeconomic effects or the additional interest costs incurred from increasing federal budget deficits.
PPI also reviewed proposals by former Mayor Michael Bloomberg and Sen. Amy Klobuchar, but there wasn’t enough information made public by the campaigns and independent analysts to develop comprehensive scores that could be fairly compared to the other candidates covered by this analysis. All candidates should continue to explain how they will pay for their spending priorities, address the nation’s current fiscal challenges, and grow America’s economy.
Senator Bernie Sanders
Sanders has proposed just over $50 trillion in new spending, the largest component of which is his $24.4 trillion Medicare-for-All plan. Sanders embraces a suite of aggressive tax increases and lays out a broad “menu of options” to finance Medicare for All, but even if all of these policies were adopted, they would fall $25.3 trillion short of what Sanders has proposed in new spending. Another costly proposal is his $16.3 trillion “Green New Deal,” which includes a federal jobs guarantee that could seriously harm the economy by pulling workers away from gainful employment in the private sector while doing nothing to stem greenhouse-gas emissions. Sanders proposes more spending on higher education than his competitors, but the majority of it is for universal debt forgiveness that would give even high-income professionals a windfall without increasing the productivity of America’s workforce. Although Sanders proposes the biggest increase in dollars for public investment of any presidential candidate, it is fiscal fantasy to believe he could ever deliver on it given his non-investment spending priorities and failure to develop sufficient revenue proposals.
Senator Elizabeth Warren
Warren has proposed $34.9 trillion of new spending to date – less than Sanders, but still nearly five times as much as the what the next highest-spending candidate (Buttigieg) proposes to spend. Her most-expensive initiatives include a $22.5 trillion Medicare-for-All framework, a $3.9 trillion plan to tackle climate change, and $3.6 trillion for investments in education and student-debt forgiveness. Warren also proposes to increase Social Security benefits by far more than any other candidate, including for wealthy retirees. She proposes more new spending for research and educating low-income students than any of her competitors, but these proposals are dwarfed by new consumption spending that by itself exceeds the total revenue raised from Warren’s proposed offsets. Given the large taxes on high-income people she has already embraced, Warren’s agenda leaves little room to raise enough taxes to close the $8.3 trillion gap between her proposed spending and revenue (let alone address existing fiscal needs) without breaking her commitment not to raise taxes on the middle class.
Mayor Pete Buttigieg
Buttigieg proposes $7.6 trillion in new spending, most of which comes from his $2 trillion commitment to combat climate change and invest in infrastructure, his $1.4 trillion investments in child care and K-12 education, and his $1.3 trillion health-care plan. Buttigieg’s proposals to expand Social Security would increase spending by the least of these four candidates relative to his proposed tax increases, meaning he would do the most to strengthen its solvency for future generations. Although Buttigieg proposes to spend roughly $1.7 trillion more than Biden, he has also proposed raising over $3.7 trillion more in revenue than Biden has to date (mostly from higher taxes on businesses and wealthy individuals). The result is that Buttigieg has proposed over $200 billion more in offsets than he has in new spending, making him the only candidate PPI examined to have already offered a complete plan for funding the entirety of his agenda.
Vice President Joe Biden
At $5.9 trillion, Biden proposes the least new spending of the four candidates PPI examined (though still significantly more than recent Democratic nominees for president). Most of his new spending comes from a $1.7 trillion plan to combat climate change, which appears to be comprised entirely of investments in scientific research and infrastructure, $1.5 trillion of investments in education from pre-kindergarten through college, and his $1.5 trillion healthcare plan. Biden commits more than half of his new spending increases to investments in infrastructure, education, and scientific research – the highest proportion of any candidate. But this analysis may yet understate Biden’s commitment to increasing public investment, as he has not released a scoreable proposal for increasing medical research spending despite saying it is among his highest priorities. Biden has yet to fully articulate how he would pay for his new spending priorities: according to PPI’s estimates, he has proposed $1.8 trillion more in new spending than he’s proposed in new revenue to pay for it. But unlike Sanders and Warren, Biden fully finances his non-investment spending proposals and still has plenty of realistic and reasonable policy options available to both pay for his other priorities and reduce the trillion-dollar deficits he would inherit from the Trump administration.
Projections published today by the non-partisan Congressional Budget Office confirm that the federal government is on course to spend $1 trillion more than it raises in revenue in Fiscal Year 2020. Trillion-dollar deficits continue as far as the eye can see, with CBO estimating a 10-year deficit of over $13 trillion.
Legislative changes since August have increased projected deficits by more than $500 billion, according to CBO. More than 90 percent of the increase comes from a package of irresponsible tax cuts added to a year-end spending agreement passed in December. But most of the change was offset by a decline in the projected interest rates and other technical changes, leaving 10-year deficit forecasts “only” $160 billion more than they were in August 2019.
What’s driving these deficits? Primarily the growth in federal health-care and retirement programs caused by our ageing population. Federal spending on Social Security, Medicare, and other health programs is projected to grow from 11 percent of gross domestic product today to 14 percent in 2030. All other non-interest spending, meanwhile, is projected to shrink as a percentage of GDP. Revenue won’t keep up with these costs, in large part because the Trump administration keeps charging tax cuts upon tax cuts to the national credit card. If anything, CBO’s projections are overly optimistic because the agency is required to assume most of these tax cuts expire in 2025 as they are scheduled to under current law.
In recent days, Sen. Bernie Sanders and his campaign surrogates have accused former Vice President Joe Biden of being dishonest about his views on Social Security. Although much has been written about Biden’s position, far less scrutiny has been applied to what Sanders proposes to do with the nation’s largest federal spending program. That’s a problem, because Sanders’ agenda isn’t honest about Social Security’s financial condition and would gravely harm the young voters powering his presidential campaign if enacted.
Here are the facts: both Biden and Sanders, as well as nearly every other Democrat running for president in 2020, have proposed to expand Social Security benefits during the campaign. Nobody is championing benefit cuts in this election. The only real difference among the candidates’ proposals is for whom benefits would be expanded. Biden has targeted his benefit expansions to low-wage workers and window(ers), two groups of older Americans that are statistically more likely to be left in poverty by our retirement system. These are the folks who need Social Security the most. Sanders, meanwhile, has proposed across-the-board benefit increases that would increase benefits for even the wealthiest retirees regardless of need.
Unfortunately, no one is talking about the elephant in the room: Social Security doesn’t even have the capacity to pay out the benefits already scheduled. Every year since 2010, the program has spent more money on benefits than it has raised in payroll taxes. The U.S. Treasury is currently covering that shortfall, because it borrowed from previous surpluses and is now paying that debt back. But once those funds are exhausted in 2035, Social Security would be legally required to cut benefits across the board by roughly 20 percent. Even Sanders has acknowledged the program has “been adjusted before, and adjustments will have to be made again.”
With 55 percent of its students in chartered public schools or renaissance schools — neighborhood schools operated by charter organizations — Camden, New Jersey, has implemented one of the most ambitious portfolio strategies in the nation in recent years. It has done so under state control, but New Jersey will probably return power to an elected school board within the next few years. So November’s elections for an advisory school board, the first since state intervention, were an important barometer of local sentiment.
Of the three seats up for grabs, two were won by candidates who support the renaissance and charter schools. The third went to a candidate endorsed by the local teachers union, which ran candidates for all three seats. All three new members were sworn in Jan. 3.
With 75,000 people, Camden is one of the poorest cities in America. At the time of the state intervention in 2013, the Camden City School District was suffering from more than two decades of poor results, financial mismanagement, systemic inequity and grade-fixing scandals. Even though the district spends almost double the national per-pupil average, some 23 of the city’s 26 public schools scored in the bottom 5 percent of schools in New Jersey. Fewer than half of students were graduating from high school, and even fewer were proficient in reading and math in elementary and middle school. With half of the district’s buildings constructed before 1928, students attended crumbling schools, some of which even lacked running water.