U.S. tariff collection
2021: $85.5 billion?*
2016: $32.2 billion
* Estimated, based on available tariff data for January-September 2021
The Bureau of Labor Statistics’ startling October 2021 Consumer Price Index report found “the largest 12-month increase [in consumer prices] since the period ending November 1990” — specifically, price inflation of 6.2% from October 2020 through October 2021. The report’s finer detail shows inflation at different rates in different parts of the economy: 30% for energy, 3.2% for services, 5.3% for food, 8.4% for goods excluding food and energy, 9.2% for automobiles, and so on. What sort of role (if any) did tariffs play in this?
Some data first: In 2016, the U.S. “trade-weighted average” tariff was 1.4%. (Taking that year’s $32 billion in tariff revenue, and dividing it by the U.S.’ $2.21 trillion in goods imports.) In January 2017, the Congressional Budget Office projected that at the same rates, tariff revenue in 2021 would be $42 billion, with income rising slowly along with economic growth. Then, from late 2018 through mid-2020, the Trump administration imposed a series of tariffs: “Section 301” tariffs from 7.5% to 25% on about $350 billion in Chinese imports and “Section 232” tariffs of 25% on steel and 10% on aluminum, along with unusual “safeguard” and “countervailing duty” tariffs on washing machines, solar panels, and Canadian lumber, which are more typical trade policy steps. By 2019, the U.S.’ average tariff had doubled to 2.8%, bringing in a likely $86 billion on about $2.9 trillion in goods imports this year. Of the extra $54 billion, $46 billion comes from tariffs on Chinese goods, and $1.9 billion from tariffs on steel and aluminum (excluding Chinese-produced metals.)
The “232” and “301” tariffs (so-called for the sections of U.S. trade law used to impose them) differ from the U.S.’ permanent “MFN” tariff system in an important way. The permanent U.S. tariff system mainly taxes retailers and shoppers, since its high tariffs are dominated by clothes, shoes, and a few other home goods. On the other hand, it imposes relatively few taxes on industrial inputs and raw materials, and almost none of those it does charge are very high. The Trump tariffs, while they also cover many consumer products, hit many more industrial inputs and capital goods. A few examples, again annualizing 2021 revenue figures from the available 9 months of data, illustrate the sources of the extra $54 billion in some detail:
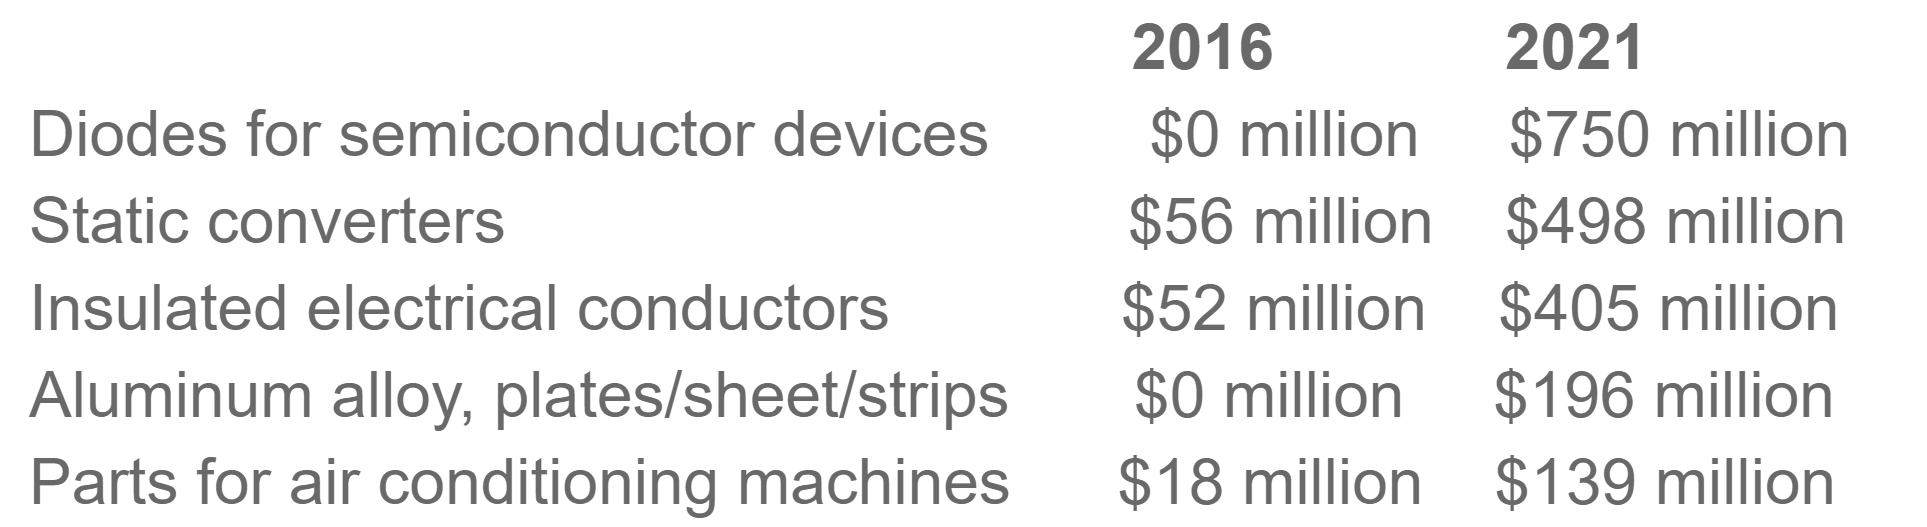
These sorts of things, obviously, are bought more by industrial customers making various other products — machinery manufacturers, automakers, construction firms, air conditioner factories (and repair shops) — than by families. Economists typically find that import prices of products subject to tariffs did not fall, so the buyers absorbed pretty much the full cost of the tariffs, meaning in turn that they will eventually raise prices of the things they make. A study of the tariff increases on Chinese goods in by San Francisco Federal Reserve staff economists in March 2019 – about halfway through the cycle of tariffs and retaliations — predicted as much, finding a likely consumer price increase of 0.1% economy-wide, and a business investment goods price increase of 0.4%. It also noted that more tariffs would mean more inflation, up to 0.4% in consumer prices and 1.4% in business investment goods were the administration to impose an across-the-board tariff of 25% on all Chinese goods.
More China tariffs did follow over the course of 2019, but not to that hypothetical level; on the other hand, the S.F. Fed study didn’t cover the metals tariffs. Taking this as a guide, the actual tariff contribution to inflation would be likely lie somewhere between the study’s initial 0.1% economy-wide estimate and its hypothetical 0.4%. Adding in the metals might reasonably bring it to 0.5%. Essentially, a secondary but noticeable contribution, presumably with a somewhat higher contribution to the BLS’ actual 8.4% inflation in goods-excluding energy and food.

Ed Gresser is Vice President and Director for Trade and Global Markets at PPI.
Ed returns to PPI after working for the think tank from 2001-2011. He most recently served as the Assistant U.S. Trade Representative for Trade Policy and Economics at the Office of the United States Trade Representative (USTR). In this position, he led USTR’s economic research unit from 2015-2021, and chaired the 21-agency Trade Policy Staff Committee.
Ed began his career on Capitol Hill before serving USTR as Policy Advisor to USTR Charlene Barshefsky from 1998 to 2001. He then led PPI’s Trade and Global Markets Project from 2001 to 2011. After PPI, he co-founded and directed the independent think tank ProgressiveEconomy until rejoining USTR in 2015. In 2013, the Washington International Trade Association presented him with its Lighthouse Award, awarded annually to an individual or group for significant contributions to trade policy.
Ed is the author of Freedom from Want: American Liberalism and the Global Economy (2007). He has published in a variety of journals and newspapers, and his research has been cited by leading academics and international organizations including the WTO, World Bank, and International Monetary Fund. He is a graduate of Stanford University and holds a Master’s Degree in International Affairs from Columbia Universities and a certificate from the Averell Harriman Institute for Advanced Study of the Soviet Union.

