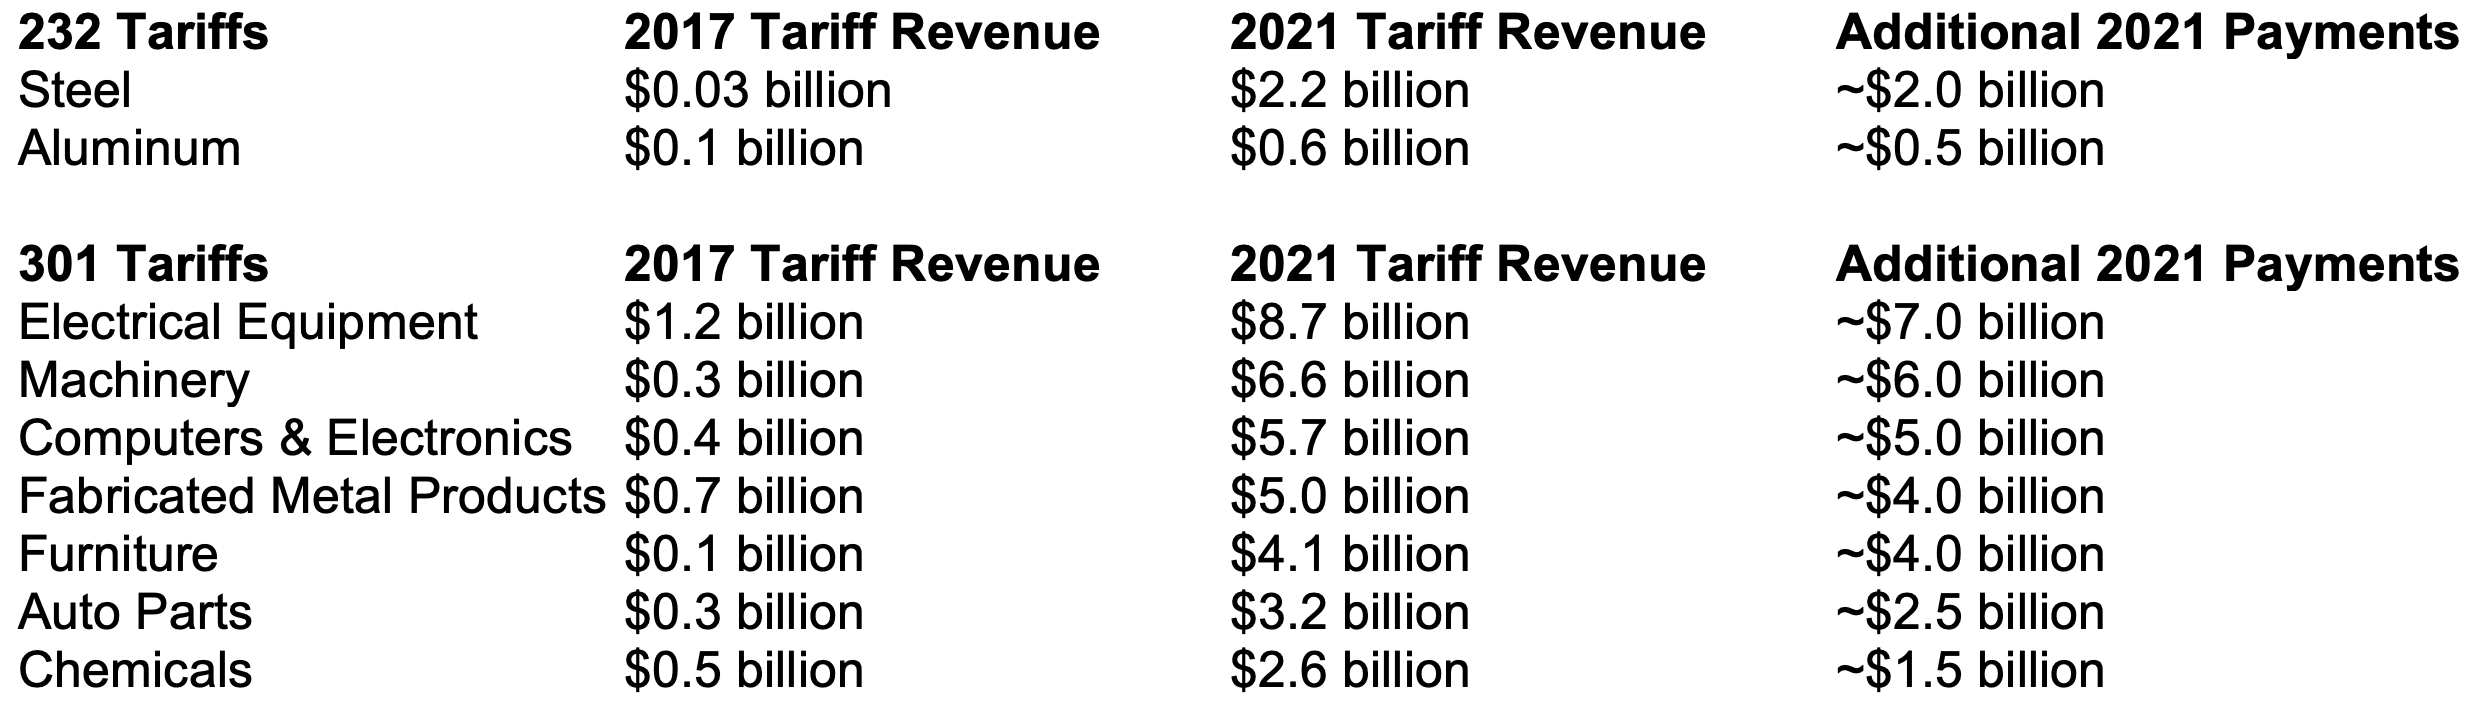
THE NUMBERS: Extra tariff collection via “232” and “301” tariffs, 2021
Electrical equipment ~$7.0 billion
Fabricated metal products ~$4.0 billion
Steel & aluminum: ~$2.5 billion
Auto parts ~$2.5 billion
Chemicals ~$1.5 billion
2021: $84 billion in tariff revenue, or just under 3.0% of $2.85 trillion in imports.
2017: $33 billion in tariff revenue, or 1.4% of that year’s $2.,35 trillion in imports.
In 2021, the two halves of this system raised more or less the same amount of money, $42 billion each. So far in 2022 the pattern is the same, though a post-COVID import boom has pushed up the figures to a likely $100 billion in tariff payments on $3.4 trillion in imports.
If the MFN system is mainly a way of taxing clothes and other consumer goods, what does the 301 and 232 system look like? A list covering about three quarters of the roughly $42 billion in extra tariffs shows nine major sources:
And if families and retailers are the main payers of MFN tariffs, who are the main 232 and 301 payers?
Academic studies typically say that the higher costs of tariffs falls on “consumers”; the lay reader of these studies usually takes this as economics-profession vernacular for “people like me!” This works for the permanent “MFN” tariff system: for example, the Bureau of Economic Analysis’ intricate Input-Output tables for 2021 imports, which track buyers of different types of products, report that about 96% of clothes come in for personal use, and these “personal users” presumably bear the cost. The 301 tariffs on furniture, which make up about a tenth of the extra tariff payments, are much the same.
But families and shoppers are not the only “consumers” in the technical economic sense. Another group is composed of businesses buying “intermediate goods” to produce finished products — say, wiring for home-builders, metals for ship-building, rubber for bicycle and truck tires. These latter industrial consumers, especially manufacturers, appear to be paying much more of the administratively imposed 232 and 301 tariffs than they do in the permanent MFN system.
“Electrical equipment, appliances, and components,” for example, is the category in which the “232” and “301” tariffs raised tariff payments most dramatically, from $1.2 billion in 2017 to $8.7 billion last year. These are things ranging from home appliances to industrial batteries, generators, switchboards apparatus, and power transformers. Assuming that purchases of specifically Chinese-made electrical goods more or less mirrored overall U.S. import patterns, BEA’’s tables show that 26% of electrical equipment imports went via retailers and hardware shops to individuals and families; 63% went to businesses for intermediate goods; and 12% went to businesses for capital goods purchases. The “capital goods” imports regrettably aren’t broken out by industry buyers, but using the intermediate goods alone, BEA’s table finds manufacturers the largest single buyer at 21% of imports, followed by construction at 18%, and farmers at 4%. Presumably the tariff payments split more or less the same way.
Likewise in “fabricated metal products” likewise, manufacturers appear to have bought 32% of imports, and construction firms 18%, and the two together would pay about half of the $4 billion or so in extra tariffs. Etc., etc. for chemicals, metals, machinery, and so on.
A likely consequence of this is that the 232s and 301s have, at the margin, imposed costs on U.S. manufacturers that producers abroad don’t face. Thus they will likely cause some a loss of competitiveness vis-a-vis imports as manufacturers sell to American customers, and more difficulty succeeding as exporters abroad. Something to consider as the Biden administration continues to think this over.
The Bureau of Economic Analysis’ input-output tables.
From the U.S. International Trade Commission, the MFN tariff schedule.
The U.S. Trade Representative’s 301 tariff search page (less so).
And the Census’ various lines of trade data.
And economic perspectives on 232, 301, and other administratively imposed tariffs:
The Bureau of Labor Statistics does some comparisons, through the lens of retaliatory tariffs on U.S. farm products in 2019, “safeguard” tariffs on automobile tires in 2009, and Bush-era steel tariffs in 2002.
A gloomy 2019 review from Federal Reserve staff finds that the “input-cost raising” effects of 232 and 301 tariffs on U.S. on manufacturing, with attendant loss of competitiveness and employment, overpowers “production-protecting” effects.
University of Chicago analysts view tariff incidence as “largely on the United States.”
Ed Gresser is Vice President and Director for Trade and Global Markets at PPI.
Ed returns to PPI after working for the think tank from 2001-2011. He most recently served as the Assistant U.S. Trade Representative for Trade Policy and Economics at the Office of the United States Trade Representative (USTR). In this position, he led USTR’s economic research unit from 2015-2021, and chaired the 21-agency Trade Policy Staff Committee.
Ed began his career on Capitol Hill before serving USTR as Policy Advisor to USTR Charlene Barshefsky from 1998 to 2001. He then led PPI’s Trade and Global Markets Project from 2001 to 2011. After PPI, he co-founded and directed the independent think tank Progressive Economy until rejoining USTR in 2015. In 2013, the Washington International Trade Association presented him with its Lighthouse Award, awarded annually to an individual or group for significant contributions to trade policy.
Ed is the author of Freedom from Want: American Liberalism and the Global Economy (2007). He has published in a variety of journals and newspapers, and his research has been cited by leading academics and international organizations including the WTO, World Bank, and International Monetary Fund. He is a graduate of Stanford University and holds a Master’s Degree in International Affairs from Columbia Universities and a certificate from the Averell Harriman Institute for Advanced Study of the Soviet Union.
Read the full email and sign up for the Trade Fact of the Week

