Asian countries consume nearly half of the world’s energy and 70% of the world’s coal. China burns more coal than all other countries combined and plans to build an additional 80 new coal plants in coming years. The United States Energy Information Administration (EIA) projects that heavy coal use will continue in many parts of Asia throughout 2050 even in a “low demand” scenario.1 Asia’s dependence on coal works at cross purposes with the global consensus to limit warming to under 2 degrees Celsius as set forth in the Paris climate agreement, as well as pledges by major Asian countries to cut their carbon emissions.
For example, China has pledged to achieve carbon neutrality before 2060.2 India set a similar net-zero emissions goal by 2070.3 Since Asia emits well over half of the world’s annual greenhouse gas emissions, any realistic strategy to bend down the global emissions curve relies on reducing Asian emissions deeply over time.4 The construction of new coal plants — which typically operate for 40 years or more — raises serious doubts about the climate commitments of leading Asian nations. China’s annual greenhouse gas emissions alone are now more than 30% of the global total, greater than all developed nations combined. Asia’s large and growing countries must transition to a cleaner fuel base to stand a chance at meeting their climate targets while sustaining economic growth. In addition, Asia’s reliance on coal also undermines efforts to reduce local air pollution, which led to over 30 million premature deaths in China alone between 2010 and 2016.5 How can Asia reduce its coal use while also ensuring continued prosperity and sustainability across the continent? Substituting cleaner-burning natural gas for coal offers one key strategy to cut emissions deeply, but only if Asian countries recognize that natural gas is not created equally from a climate change perspective.
For example, Russia and the United States both increasingly export natural gas to Asia. However, studies show that the United States produces natural gas that has far lower lifecycle greenhouse gas emissions than Russian gas. That’s due to America’s greater performance on all three dimensions of effective methane control: (1) measurement, (2) validation, and (3) policies.
In fact, this paper will show that:
On this basis, we argue that Asia should not only increase its use of natural gas to displace coal, but do so particularly by purchasing liquified natural gas (LNG) imports from the United States and other lower methane emitting sources, rather than sourcing natural gas from Russia.6 We find that lower methane emissions gas systems give the United States a significant competitive advantage versus other sources of gas as Asian countries shift from coal to gas to cut their carbon emissions.
But these U.S. advantages will only continue if the federal government and domestic energy companies work together to lower methane emissions from its production, transportation, and exportation of natural gas. We urge the Biden administration to set an explicit national goal to work toward making America the cleanest natural gas producer in the world. Not only would that boost U.S. LNG exports, it would also pressure other exporting countries to reduce their methane and lifecycle emissions if they want to be remain competitive.
This paper offers a three-tier framework for a comprehensive comparison of methane emissions by Russia and the United States. We explore how each country measures its methane emissions, the extent and effectiveness of third-party validation of emissions estimates, and the role that policy frameworks play in creating incentives for cleaning up gas production.
We note that Russia’s obsession with secrecy makes a comprehensive comparison of methane emissions between the United States and Russia difficult. The bottom line is that Russia’s insistent lack of transparency compared to the U.S. means Russian emissions are likely far higher even than the existing estimates used in the paper. We also note that from an economic and national security perspective, the U.S. has an opportunity to partner with key Asian nations in providing cleaner natural gas while reducing the influence of petro-states like Russia. This is imperative is an especially crucial given Russia’s invasion of Ukraine and other expansionist policies. However, this is not the main focus of this paper.
All these factors suggest that it is strongly in the U.S. and global climate protection interest for America to continue to expand its LNG exports into Asia, while making sure U.S. regulations drive down methane emissions to work toward being the world’s cleanest producer of natural gas. This report will offer a series of specific recommendations for how to accomplish these goals.
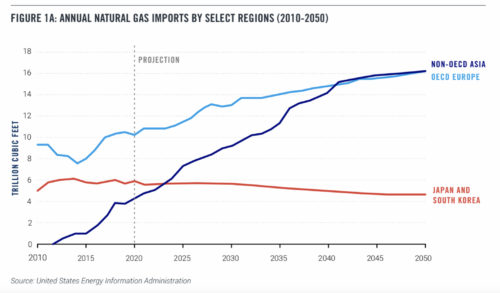
Natural gas consumption in Asia has risen steadily in recent years, a trend expected to increase more dramatically to meet Asia’s projected increase in energy consumption over the next thirty years, as displayed in Table 1a and 1b. Economic growth in the region, particularly in China and India, is expected to drive demand for a wide range of energy sources, including natural gas. In addition, calls for cleaner sources of energy has motivated commitments by governments in the region to begin shifting away from coal and towards natural gas and renewable energy.
This vision was directly reflected in China’s 2016- 2020 “energy revolution” plan, which featured growth in natural gas as part of its “three-pillar approach” to sustainable energy. Specifically, the plan included increasing the share of natural gas in primary energy consumption to 10% by 2020 and 15% by 2030 and in urban dwellings to 50-55% by 2020 and 70% by 2030.7 8Natural gas continues to feature prominently in China’s 14th Five-Year Plan, spanning years 2021 through 2025,9 and will continue to do so in light of China’s carbon neutrality by 2060 pledge.10 India is following a similar trajectory, with a recent announcement committing to net-zero carbon emissions by 2070.11 In line with this new ambitious policy direction, India has set out to increase the share of natural gas in the country’s energy mix from just over 6% at present to 15% by just 2030.12
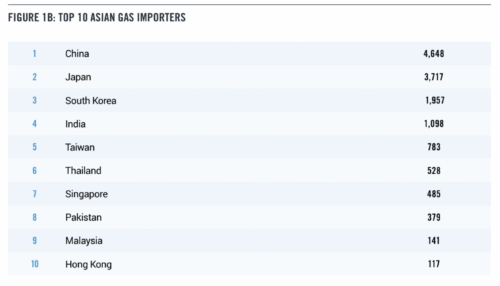
Due to limited domestic supply of natural gas in Asia, natural gas imports are also projected to increase steeply, roughly quadrupling from 4.1 trillion cubic feet (Tcf) in 2020 to 16.1 Tcf in 2050.13 China and India are projected to receive roughly half of these dramatically increased imports.14 Liquified natural gas (LNG) imports specifically are similarly projected to increase over this time period, representing as much as 72.5% of the total demand for natural gas in the Asia-Pacific region by 2050.15 This is especially the case for India, which has experienced a decline in domestic natural gas production. Indeed, India has been the fourth largest importer of LNG since 2011 and continues to rely on these imports, which represented 50% of the country’s natural gas supply in 2019.16
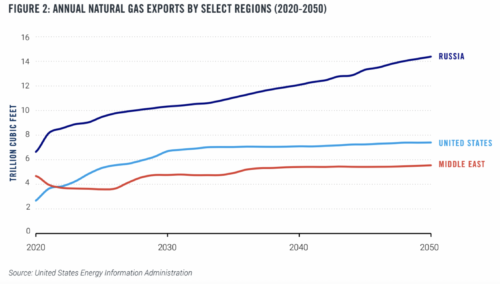
Three of the world’s largest natural gas producing regions (the United States, Russia, and Middle Eastern exporters) are expected to increase natural gas production to meet growing demands in Asia, as displayed in Figure 2. However, at least prior to its invasion of Ukraine, Russian production of natural gas (which may reach 14 Tcf by 2050) has been expected to significantly outpace exportation from other regions, positioning Russia to become the largest net exporter of natural gas through 2050.17 And while these estimates were made prior to the EU’s announced embargo on Russian gas, and are likely therefore to be too high, the EU is still importing gas from Russia, as are other nations.
Crucially, Russia has already taken steps to secure its natural gas foothold in China even as its market in Europe is now threatened by its invasion of Ukraine. The Power of Siberia-1 pipeline, which began operating in 2019, is Russia’s first natural gas pipeline to China. The $400 billion contract, the largest contract in the history of Russia’s natural gas company Gazprom, calls for Russia to supply China with 38 billion cubic meters of natural gas annually for 30 years. The impact for China is also significant, with the amount of natural gas supplied enabling China to displace coal in China’s northwest region over that period.18 Russia’s President Vladimir Putin and China’s President Xi recently held a high profile event during the Beijing Winter Olympics at which they announced an additional agreement calling for another Russian gas pipeline to China, known as the Power of Siberia-2 pipeline, which is expected to have an export capacity of 50 Bcm per year19 and is scheduled to commence operations in 2030. At the February 2022 event in Beijing, Russia and China announced another 30- year contract to supply 10 billion cubic meters of natural gas to China through this new pipeline.20
Russia has also begun making a natural gas footprint in India. Although India currently only accounts for 0.2% of Russia’s natural gas exports,21 India recently entered into a 20-year contract with Russia to supply it with 2.5 million tons of LNG.22 Both countries have expressed commitments to deepening their ties and boosting LNG activity.23
As with Russia, net exports of natural gas from the United States are expected to spike through 2050. The United States just recently, in late 2021, became the world’s largest LNG exporter. Asia has been the largest destination for U.S. LNG exports since 2020, with South Korea, China, and Japan being the largest buyers in both 2020 and 2021, although the recent pledge by President Biden to supply more U.S. LNG to Europe to displace Russian gas suggests that both Europe and Asia will be receiving greater U.S. LNG shipments in coming years.
While Japan has been the largest LNG importer in the world for the past 50 years, China is poised to surpass Japan to facilitate its transition away from coal.24 The year 2021 marked this transition, as Japanese LNG imports fell 4 million tons short that of China. The U.S. recently surpassed Qatar and Malaysia as the second largest source of LNG imports to China, after Australia. The United States further cemented its relationship with this import partner in the third quarter of 2021, when China signed four long-term LNG contracts with leading U.S. LNG producers following a Chinese government directive to secure LNG at any price.25, 26
While India has historically received most of its LNG from Qatar due its geographic proximity, India is still one of the primary destinations of U.S. LNG, ranking seventh in 2019. New commercial contracts with U.S. LNG companies will continue to sustain this relationship.
Russia’s invasion of Ukraine jolted the European Union out of its complacency surrounding energy imports, exposing how the EU addiction to Russian gas has been funding Putin’s malign regime at ever greater levels, in the hundreds of billions of dollars annually, even since Russia’s 2015 annexation of Crimea. Apart from the wide-ranging geopolitical costs of the EU reliance on Russian oil and gas, the invasion of Ukraine is also suddenly forcing the EU to recognize the huge additional methane emissions of Russian gas, contributing to the EU determination to cut its dependency on Russian natural gas imports.
Asia should follow suit, on both ethical grounds to protest Russia’s unlawful invasions, but also on environmental grounds. Without a dramatic fuel shift from coal to cleaner natural gas, Asian countries have no plausible way to meet their climate commitments.
Natural gas emits about half the carbon dioxide emissions as coal when combusted. However, natural gas producers emit significant amounts of greenhouse gas in the form of methane by venting, inefficient flaring, and fugitive emissions through leaks in wells, transportation in pipelines and equipment.27 These emissions have a disproportionately large impact on the climate because the primary component of natural gas, methane, warms the atmosphere 86 more times per molecule than carbon dioxide emissions over a 20-year timeframe.28 Therefore, high fugitive methane emissions can more than offset the climate gains of switching to natural gas from coal. Studies show that gas is more climate friendly than coal only so long as methane emissions are kept below 2.7% of gas production, although some estimates range to more like 3.5% leakage rates.29, 30
In the context of Asia, natural gas imports with high methane leakage rates result in higher carbon emissions than anticipated, and in some cases, are no better from a climatic perspective than continuing the use of coal. Ultimately, Asia should not purchase any natural gas that does not have low enough methane emissions to provide climatic benefits over coal.
Moreover, Asia should prioritize the lowest verifiable methane emitting option from a lifecycle perspective, over any other natural gas alternative. Without Asia’s leadership in cutting emissions of coal and using lower-emitting natural gas, it will be difficult for the planet to stay on track for a 2 degrees Celsius goal. As this paper will discuss, leakage rates vary considerably based on the geographic location of the natural gas source, including across and within national boundaries. Therefore, comparing the climatic benefits or costs of exports of natural gas from the United States and Russia into Asia requires significant analysis.
This paper addresses the unique opportunity and associated challenges for Asia to substitute coal with low-leakage natural gas, specifically, LNG sourced from the United States. This cleaner natural gas will not only allow Asia to deliver on its policy commitments, but will also reap real and significant benefits for the climate as well as for human health, both of which have been severely threatened by decades of coal use throughout most of Asia. The decisions Asian countries make today to secure their future gas supply have enormous bearing on both their economic and social development and on climate change. Where they source their gas from is crucial to ensure high-quality natural gas imports with low leakage rates for methane emissions.
This paper is organized around a three-tiered framework for assessing the climate impact of natural gas exports from the United States and Russia. Section 3 introduces and discusses this framework at length with a comparison between the United States and Russia. Section 4 offers policy recommendations for Asia and the United States
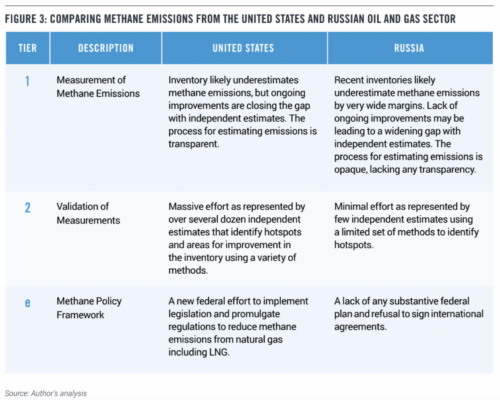
Measuring methane emissions from the natural gas lifecycle is notoriously difficult. Methane emissions can happen anywhere along the supply chain from initial production to final consumption. In addition, a small minority of leaks often explains the vast majority of any observed emissions, thereby earning the moniker of “super” or “ultra” emitting sources. For these and other reasons, there are wide uncertainties in many estimates of methane emissions, making comparing national emissions inventories alone a necessary yet insufficient step in assessing the climatic impact of different natural gas sources. Countries also put varying degrees of diligence and skill into validating national emissions. Finally, countries adopt very different policies and incentives to encourage the reduction of methane emissions. More specifically, we conceptualize three tiers of comparison as follows:
Figure 3 summarizes our main results from applying this conceptual framework to LNG exports from the United States and natural gas exports from Russia. While there is ample room for improvement in both countries, the United States clearly offers a strong relative advantage by offering a lower carbon natural gas product in the form of LNG exports. In particular, U.S. measurement of methane emissions is more accurate, the validations of those measurements are more rigorous, and the methane policy framework is more aggressive. We believe these realities confer a substantial competitive advantage on U.S. natural gas.
At the same time, we recognize that geopolitics will sometimes supersede climate protection considerations. But if climate and geopolitical considerations are not given appropriate value, Russia could wind up being the key gas supplier to what some are calling the “axis of autocracy” — countries with rulers who may favor Russia against free and democratic nations. Since Russia’s invasion of Ukraine, this group has clearly included not only China, but in some cases India. But for Asian countries struggling to grow and do their part to slow down the overheating of our planet, the evidence points overwhelmingly to the superiority of cleaner U.S. gas. These nations must be called to account on the negative climate implications of using Russian gas, especially given the increasing availability and price competitiveness of lower emitting LNG alternatives from the U.S.
Finally, recommending imports of cleaner natural gas as baseload power and heating in Asia to displace higher-emitting natural gas sources and coal should be in way no detract from aggressive efforts among Asian nations to expand production of renewable energy, nuclear power, hydrogen and other near-zero emitting sources.
In both the United States and Russia, government emissions inventories have historically likely underestimated methane emissions from the oil and gas sector compared to independent estimates, which the next section discusses in detail. A central, but not the only, reason for this is that these inventories rely on bottom-up measurements, which make assumptions regarding the quantity of equipment used (known as “activity factors”) and their emission rates (known as “default factors”) that are inherently prone to underestimation. Therefore, government emissions inventories should be taken with a grain of salt.
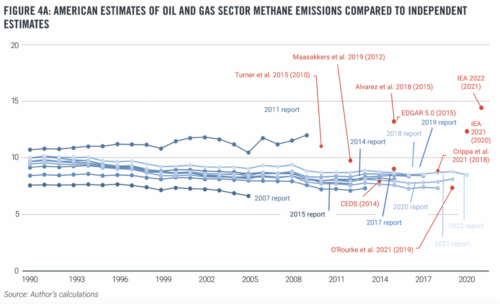
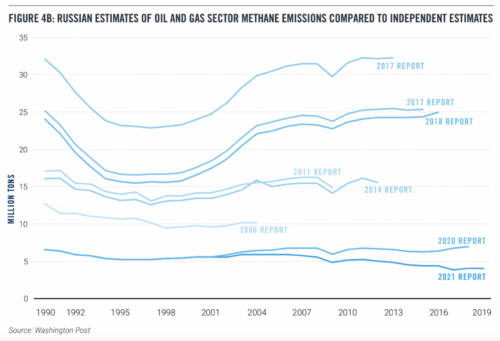
Figure 4 shows government inventories of methane emissions from the oil and gas sector compared to a selection of recent independent estimates (denoted as yellow triangles) as well as how those inventories changed over time (denoted by the dotted lines). On the first dimension, Figure 4 shows (a) that Russia initially overestimated emissions before significantly underestimating them, leading to a widening gap between government inventories and independent estimates. It also shows (b) that the United States likely underestimates emissions but that the gap between government inventories and independent estimates is quickly closing, with several academic studies roughly agreeing with the government inventories. In both cases, the notable exception outlier is IEA (2021) which accounts for ultra-emitters, an analysis that we describe in detail later in this report.
Regarding changes in government inventories over time, a recent investigation by The Washington Post shows that Russia has repeatedly and arbitrarily lowered its estimates for methane emissions from its oil and gas sector. As displayed in Figure 4A, these estimates have dropped by nearly an order of magnitude over the last 15 years with frequent revisions. According to the Post investigation, experts believe that Russia is massively underestimating its methane emissions.31 Similarly, Russia’s own estimates of methane emissions from the oil and gas sector are remarkably low in relative terms. For example, Gazprom reported a methane leakage rate of three-tenths of one percent in 2015, a number widely viewed as unbelievably low by experts,32 while the United States reported a 1.54% methane leakage rate in 2017.33 Taken together, the trend of constant downward revisions and remarkably low leakage rates immediately raises deep suspicion over the quality of Russia’s emissions inventory.
Beyond the estimates from the annual inventories, the process for making estimations is drastically different between the United States and Russia. For example, as displayed in Figure 4B, the United States also lowered its estimate for methane emissions from its oil and gas sector over the last 15 years, although to a much lesser degree than Russia. Importantly, these changes are much more gradual and accompanied by a coherent and public technical explanation in the Environmental Protection Agency’s (EPA) annual greenhouse gas inventory report. As part of this reporting process, the EPA invites and responds to public feedback — including from academics, nonprofits, and businesses — on its methodology and potential updates. On the other hand, to our knowledge, Russia does not have any such a transparent process. As such, there is no plausible explanation for why Russian estimates change so drastically or frequently, except political expediency. In addition, the Post reports that Russia does not impose substantial fines for noncompliance and that third-party audit reports in Russia cannot be trusted.34
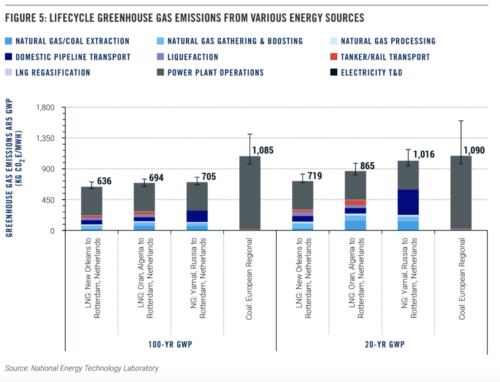
Based on the United States Greenhouse Gas Inventory and Reporting Programs, the National Energy Technology Laboratory conducted a comprehensive study comparing the lifecycle greenhouse gas emissions from different sources of energy. As illustrated in Figure 5, the study finds Russian gas piped to China has up to 5% more greenhouse gas emissions (GHGs) than Chinese coal based on a 20-year global warming potential. In contrast, liquefied natural gas (LNG) shipped to China from the United States has only 72% of the GHGs compared to Chinese coal based on a 20-year global warming potential. From a 100-year global warming potential perspective, Russian gas piped to China has about 11% more GHGs compared to United States LNG shipped to China.35, 36.
A major caveat is that, within each country, there is massive variance in leakage rates. In particular, both the United States and Russia have localized “super” or “ultra” emitting sources, as discussed in detail by a recent academic article published in the journal Science. 37 Within these regions, researchers have observed spikes in methane leakage well in excess of what would make natural gas a reasonable substitute for coal from a climatic perspective. For example, a recent study in the United States estimates that methane emissions leakage rates from the Permian Basin, a major producing region in Texas, were 3.7% of production in 2018 and 2019, suggesting a significant disadvantage from using natural gas from this region over coal.38 Approaches that account for ultra-emitting sources, such as IEA (2021), will therefore tend to yield higher estimates of methane emissions. This speaks to the importance of independent estimates, which we will turn to next.
Independent actors, including academic and environmental organizations, are another vital source of data about methane emissions from country to country. As described in detail in Appendix 1, we focus primarily on collecting independent estimates across the two countries that are comparable. These approaches primarily rely on either “top-down” satellite-based studies or “bottom-up” emissions factor studies. Particularly in the United States, there are dozens of excluded studies that use airplanes, trucks, sensors, and in-person assessments to provide detailed geographical estimates of methane emissions. These methodologies require a certain level of governmental or corporate permission to study methane emissions and, to our knowledge, this permission tends to be granted in the United States and not granted in Russia. This is one of the reasons why we know so much more about methane emissions in the United States compared to Russia.
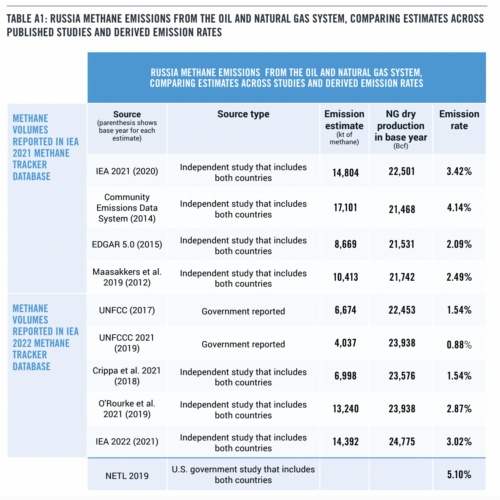
In an effort to make reliable comparisons, we have focused only on studies that employ the same methodology to ascertain national-level estimates in the United States and Russia. Our analysis reveals that the average leakage rate reported in Russia is 2.80% (ranging between 1.54 and 4.14%), substantially higher than the 1.74% average rate in the United States, (ranging more narrowly from 1.12 and 2.19%.)
Most recently, the International Energy Agency recently launched a Methane Tracker Database.39 This initiative aims to blend country-level inventories with satellite-based measurements to track methane emissions over time. It also complements the International Methane Observatory (IMO), which is expected to increase the quality of methane estimates overall.40 We calculate a methane leakage rate originating from this database equal to 2.19% for the United States and 3.02% for Russia in 2020, making Russia’s methane emissions nearly 40% higher than those from the United States. Again, the uncertainties around Russia’s methane emissions are much greater, since there are many more independent estimates conducted in the United States.
Previous academic efforts to estimate country-level methane emissions from oil and gas reflect similar trends. An article published in Atmospheric Chemistry and Physics estimates methane leakage rates of 2.11% in the United States and 2.49% in Russia for 2012.41 Another academic article published in 2017 by the journal Environmental Research Letters estimates methane leakage rates of 1.57% in the United States and 3.42% in Russia for 2012. We were unable to find any third-party country-level estimate that estimates the United States emitting at a higher methane leakage rate than Russia.42
There is also a distinction between the overall effort put in by third-parties, such as academics and nonprofits, in validating government emissions inventories. In the United States, these researchers have produced well over several dozen major studies estimating methane leakage ratios at different geographies and scopes spanning the last decade. Importantly, there is a diverse array of methods including airplane, drone, sensor, and satellite data.
In contrast, there is far less activity in Russia, with only a handful of academic studies independently estimating methane emissions. Those typically find that inventories are underestimated. For example, a 2021 article published in the journal Atmospheric Environment employs satellite imagery to estimate methane emissions from one particular region in Russia that are much higher than official figures. The authors identify widespread flaring, even though this activity was supposed to be illegal, and argue that more satellite imagery is required to validate Russia’s underestimated national data.43 Taken together, not only are third-party validation efforts more commonplace in the United States, but those validation efforts that allow for comparisons with Russia show lower comparative methane leakage rates for the United States. This means that validation efforts are stronger in the United States when compared to Russia. Of course, both countries should improve further on facilitating validation efforts, since there are large gaps between estimates from government inventories and independent estimates at local and national scales in both countries.
We are not aware of any significant policies in Russia to incentivize reductions in methane emissions. Moreover, while President Putin has called for cuts to methane emissions, Russia has not signed onto any of the recent international efforts to reduce methane emissions including, for example, the Global Methane Pledge launched by the United States and the European Union.44 For these reasons, we are unable to credit Russia with any effective policy for mitigating methane emissions.
In contrast, the United States has recently furthered its effort to reduce methane emissions from the oil and gas sector as part of its Methane Emissions Reduction Plan.45 Importantly, the United States Environmental Protection Agency is updating rules for new and existing oil and gas sources, which it estimates will reduce methane emissions by approximately 75% from covered sources. These sources will include those previously unregulated including oil wells with associated gas.
Bipartisan infrastructure legislation that President Biden signed into law also contains $16 billion in new funding to cap old or existing wells and mines that leak methane. In addition, the Bureau of Land Management will further reduce venting, flaring, and leaks on public lands and waters. This is notable because one of the main hotspots for methane emissions in the United States, the Permian Basin in New Mexico, would be subject to these regulations.
Finally, the Department of Transportation’s Pipeline and Hazardous Materials Safety Administration (PHMSA) is implementing the bipartisan PIPES Act, passed in December 2020, with the potential to reduce 20 million metric tons of carbon dioxide emissions per year by reducing or eliminating leaks or ruptures of oil and gas pipelines. Interestingly, PHMSA is proposing a rule this year to strengthen standards for LNG facilities, particularly from large scale incidents and storage tanks.
1. Asian governments should phase down and then halt the importation of Russian gas based on climate change, humanitarian, and geopolitical grounds.
2. Asian nations should also suspend and cancel the construction of natural gas pipelines from Russia since they increase lifecycle greenhouse gas emissions and are therefore inconsistent with climate goals.
3. In particular, China should cancel a proposed new gas pipeline from Russia (the so-called “Power of Siberia 2”) given its high lifecycle emissions.
4. Asian nations should construct LNG infrastructure to facilitate imports from countries with lower methane emissions, including the United States.
5. Asian countries that have carbon prices (including China, Japan, and South Korea) should, in time, consider adding a greenhouse gas import tax that regulates natural gas imports based on their lifecycle methane emissions. Carbon prices can and should be redesigned to give priority to low leakage natural gas.
6. Major greenhouse gas emitting Asian countries, especially China and India, who have not already done so should join the U.S., EU, and over 100 countries in the Global Methane Pledge to cut methane emissions from all national sources by 30% by 2030. It is notable that Russia has not joined this Pledge.
7. U.S. lawmakers and regulators (at the federal and state levels) should continue improving management of methane emissions — including measurement, validation, and policy frameworks — to work toward achieving the lowest leakage rates of any gas-producing and gas-exporting country in the world. U.S. regulators should specifically improve measurements of methane emissions by incorporating new methods, including satellites and other airborne measurements. A strong national inventory will bolster the effectiveness of any policy aimed at reducing methane emissions. U.S. regulators should pay special attention to ultra-emitters among oil and gas producers, including small producers and those in the Permian Basin.
While more aggressive regulation is necessary, the U.S. government should also use incentives and fees to challenge domestic oil and gas producers to a “race to the top” when it comes to controlling methane emissions. Several U.S. LNG exporting companies have taken measures in this direction, including “tagging” or disclosing the full lifecycle emissions of its LNG export cargoes in 2023, and new efforts to capture and store carbon at one of its U.S. export terminals.
In order to make greater amounts of natural gas available for export both Europe and Asia and to improve global climate outcomes and geopolitics while limiting domestic price, the United States must also expand the production of additional clean energy sources including renewable energy, nuclear power, geothermal and related technologies including electricity storage, carbon capture and storage, direct air capture and other advanced energy. As the Progressive Policy Institute noted in its previous reports from 2020 and 2021 on the role of natural gas in cutting domestic greenhouse emissions and those in Europe, the U.S. should enact $325 billion pending legislation to dramatically expand clean energy tax incentives this year, as well as invest in increase domestic production of gas, including expanding gas pipelines as needed.
Both gas exporting and importing governments should challenge oil and gas companies to show steady progress in reducing their methane emissions, including by encouraging companies to consider bundling their LNG shipments with carbon offsets that would enable exporters to achieve lower carbon status over the long-run, while ensuring offsets are high-quality. In time, importing nations are likely to reward these efforts with greater demand for low-emissions gas delivery.
International climate oversight bodies (including U.N. Framework Convention on Climate Change and International Panel of Climate Change) should strongly encourage all nations to provide accurate data on actual methane emissions from all sources, including oil and gas production. These organizations and IEA should also continue deploying methodologies capable of improving estimates of methane emissions in all countries, and particularly emphasize remote measurements in countries, such as Russia, that do not have robust independent estimates or transparent public processes for estimating inventories. Parties to the Paris Agreement are required to submit nationally determined contributions (NDCs), and the UNFCCC Secretariat should require each Party’s national climate plans to include plans to cut methane emissions from oil and natural gas, whether through production, exports and/or imports.
Independent third-party entities, such as nongovernmental organizations, should continue to conduct research into Russian methane emissions to fill the data gap that inhibits a thorough understanding of the magnitude of the emissions.
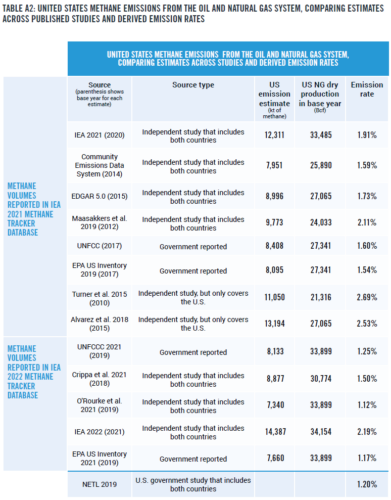
Reported volumes of estimated methane emissions across sources come from the International Energy Agency (IEA) 2021 Methane Tracker Database and the IEA 2022 Methane Tracker Database that compiled estimates across published studies and inventories.46,47 The authors retrieved the data compiled by the IEA 2021 database in February 2022 and the data from additional studies reported by the IEA 2022 database in April 2022. IEA 2021 interactive figures reported what year the reported emissions covered and both IEA 2021 and 2022 databases report volume breakdowns by the segments of the oil and gas systems that were included in each study (e.g., upstream oil, upstream gas, downstream gas). As such, all estimated methane emission volumes included in our tables are the reported numbers for national totals across the entire oil and gas systems.
To calculate a derived percent of the country’s natural gas production lost as methane emissions based on the findings from each study, the authors divide the IEA 2021 and IEA 2022 compiled methane emission volumes by the total dry natural gas production volumes for the respective countries and base years reported by U.S. Energy Information Administration (EIA) datasets. Production data for both Russia and the U.S. comes from EIA’s International data set for all years of interest except for one. The U.S. volume for 2021 comes from EIA’s dry production data series.48 Before dividing, we convert the reported kt of methane for each source to billion cubic feet (assuming 1 kiloton of methane equals 0.051921 billion cubic feet of methane).
For example, Maasakkers et al 2019 estimate that in 2012 Russia emitted 10,413 kt (or 541 Bcf) of methane from across the country’s oil and gas system.49 EIA reports that in 2012 Russia produced 21,742 Bcf of dry natural gas. The authors then calculate the emission rate by dividing the total methane from Russia’s oil and gas systems in 2012 as estimated by Maasakkers et al 2019 by the Russian dry natural gas volume reported by EIA for 2012 (541/21,742= 2.49%).
NETL 2019 calculate the cradle through delivery emission rate of Russia natural gas via pipeline to Shanghai as 5.1% and of U.S. LNG to Shanghai, assuming gas comes from Appalachia, as 1.2% (see exhibit 6-8).50 This study may underestimate LNG methane emissions because NETL 2019 assumes Appalachian upstream methane emissions for its U.S. LNG calculation that may be lower than the upstream methane emissions for other major natural gas regions in the United States.
37. T. Lauvaux et al., “Global Assessment of Oil and Gas Methane Ultra-Emitters,” Science 375, no. 6580 (April 2022): pp. 557-561, https://doi.org/10.1126/science.abj4351.
38. Yuzhong Zhang et al., “Quantifying Methane Emissions from the Largest Oil-Producing Basin in the United States from Space,” Science Advances 6, no. 17 (2020), https://doi.org/10.1126/sciadv.aaz5120.
39. “Methane Tracker Data Explorer,” International Energy Agency, February 2022, https://www.iea.org/articles/methane-tracker-dataexplorer.
40. International Methane Emissions Observatory Launched to Boost Action on Powerful Climate-Warming Gas,” European Commission, October 31, 2021, https://ec.europa.eu/commission/presscorner/detail/en/IP_21_5636.
41. Joannes D. Maasakkers et al., “Global Distribution of Methane Emissions, Emission Trends, and OH Concentrations and Trends Inferred from an Inversion of GOSAT Satellite Data for 2010–2015,” Atmospheric Chemistry and Physics 19, no. 11 (2019): pp. 7859-7881, https://doi.org/10.5194/acp-19-7859-2019.
42. Lena Höglund-Isaksson, “Bottom-up Simulations of Methane and Ethane Emissions from Global Oil and Gas Systems 1980 to 2012,” Environmental Research Letters 12, no. 2 (2017): p. 024007, https://doi.org/10.1088/1748-9326/aa583e.
43. Iolanda Ialongo et al., “Satellite-Based Estimates of Nitrogen Oxide and Methane Emissions from Gas Flaring and Oil Production Activities in Sakha Republic, Russia,” Atmospheric Environment: X 11 (2021): p. 100114, https://doi.org/10.1016/j.aeaoa.2021.100114.
44. “Russia Not among COP26 Methane Pledge Signatories,” The Moscow Times, November 2, 2021, https://www.themoscowtimes.com/2021/11/02/russia-not-among-cop26-methane-pledge-signatories-a75472.
45. “U.S. Methane Emissions Reduction Action Plan,” The White House, November 2021, https://www.whitehouse.gov/wp-content/uploads/2021/11/US-Methane-Emissions-Reduction-Action-Plan-1.pdf.
46. Methane Tracker Database (2022),” International Energy Agency, Accessed April 14, 2022.
47. “Methane Tracker Database (2021)”, International Energy Agency, Accessed February 2022.
48. “Natural Gas Gross Withdrawals and Production,” U.S. Energy Information Administration, May 31, 2022, https://www.eia.gov/dnav/ng/ng_prod_sum_a_EPG0_FPD_mmcf_a.htm.
49. Maasakkers et al., “Global Distribution of Methane Emissions.”
50. Roman-White et al., “‘Life Cycle Greenhouse Gas.

