Tariff rates on two Russian imports
Palladium, “MFN”: 0%
Palladium, “Column 2”: 0%
King crab, “MFN”: 0%
King crab, “Column 2”: 0%
The Biden administration’s ban on Russian oil, coal, and gas is a large though not total trade sanction, cutting off about 60% of American imports of Russian goods. (Last year’s import total was $26 billion; energy made up $16 billion.) Congress, meanwhile, is considering a bill to revoke Russia’s “Most Favored Nation” tariff status. Some observations on this more complex measure:
Fundamentally, it means the tariff rates a country applies generally — as an example, the U.S.’ 6.5% “MFN” tariff on umbrellas (tariff line 66019100) applies to European umbrellas, Chinese umbrellas, Brazilian umbrellas, etc. (Following the late Senator Daniel Moynihan’s noble but forlorn hope to make trade policy terms of art more comprehensible, the U.S. also uses the term “permanent Normal Trade Relations or “NTR” to mean the same thing, but others don’t.) MFN tariffs are also a core feature of relationships among WTO members, as membership entails accepting a “non-discrimination” obligation requiring them to give one another equal tariff rates.
What then does “revoking” MFN status mean? In practice, should Congress pass such a law, buyers of Russian goods would no longer pay the current U.S. tariff rate. Instead they would pay the rates created in the 1930 “Smoot-Hawley” Tariff Act during the Hoover presidency. These rates are now listed in “Column 2” of the U.S. Harmonized Tariff Schedule; as an example, an umbrella gets a 40% Column 2 tariff. More broadly, standard estimates of Smoot-Hawley average tariffs are (a) about 20% overall, based on dividing tariff revenue by import value, as opposed to 2.8% in 2021 (or 1.4% excluding the Trump-era tariffs on Chinese goods and metals) or (b) an even higher average of 59% excluding duty-free goods.
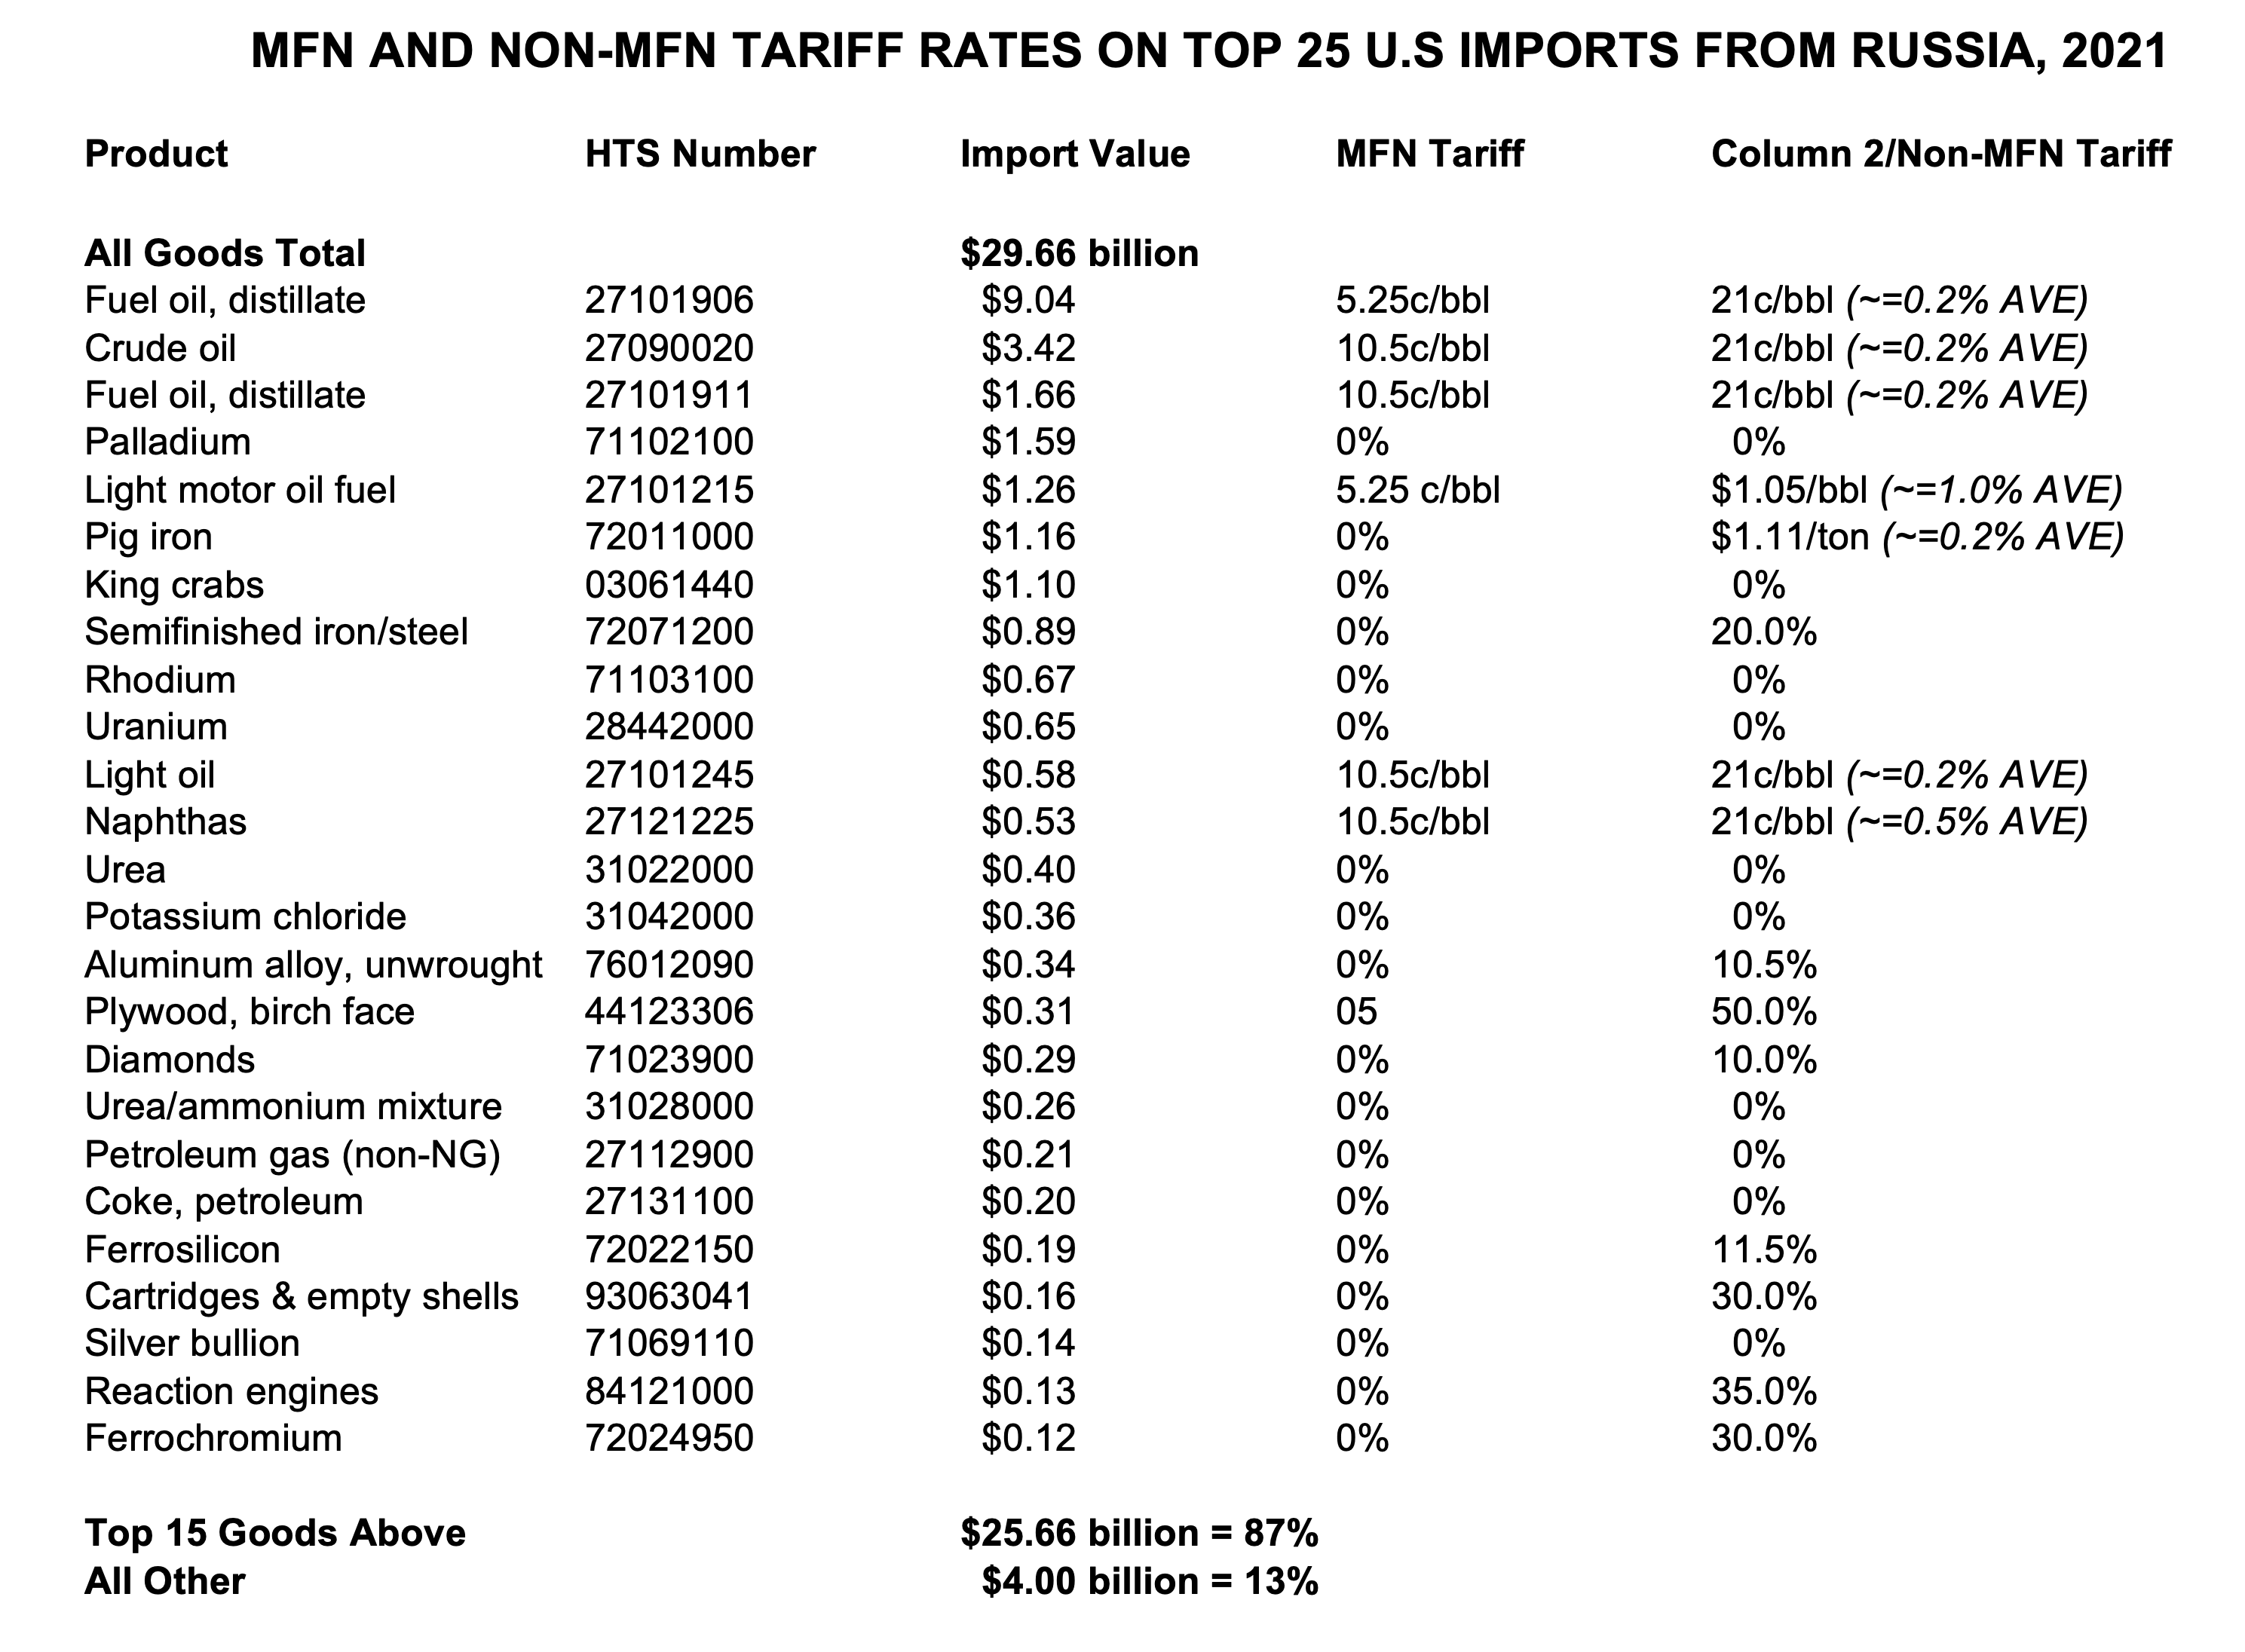
As the averages and the umbrella example both suggest, non-MFN tariffs are generally seen as quite punitive, and often are so in reality. However, they are much less punitive in the specific Russian case. This is because Russia is mainly a natural-resource exporter, and Column 2 tariffs on natural resources are actually rarely high and often zero. In 1930, both Congress and Mr. Hoover wanted very high tariffs on manufactured goods and farm products, but avoided them on raw materials to keep costs low for U.S. factories. These sorts of things — energy, specialty metals, chemical inputs for fertilizer — make up most of America’s 21st-century purchases from Russia. A look at MFN and “Column 2” rates on the U.S.’ top 25 Russian imports last year (accounting for $22 billion of a $26 billion total) yields this result:
1. Energy ($16 billion): Eight crude and refined oil, gas, and coal products made up about 60% of all U.S. imports from Russia last year. The Column 2 tariff on crude oil is 21 cents per barrel —twice the “MFN” 10.5 cents per barrel, but still insignificant. So revoking MFN tariffs on energy would be unlikely to change trade flows at all, since the increases basically raise rates from about 0.1% to about 0.2%. If the goal is to impose economic costs, yesterday’s ban will do a lot more.
2. Four specialty metals ($2.1 billion): palladium, rhodium, uranium, and silver in bullion form. Here, revoking MFN changes nothing, as U.S. tariffs are zero on these things at MFN, and also zero in Column 2.
3. Five natural resources and basic chemical products (also $2.1 billion): Diamonds are zero at MFN, and 10.5% in Column 2; likely some impact, but not a huge one. The others — king crab, potassium chloride, urea, and urea/ammonium mixture (the latter two used as fertilizer precursors) — are all zero tariff now and also zero in Column 2.
4. Four industrial metals ($2.5 billion): The largest is pig iron at $1.2 billion, for which rates rise from zero to $1.11 per ton. This was probably a lot in 1930, but is about 0.2% — not significant — at the 2022 market price of about $500 per ton. Increases are higher for the other three: zero to 10.5% for unwrought aluminum alloy, zero to 11.5% for ferrosilicon, and zero to 30% for ferrosilicon.
5. Four value-added manufactured products ($1.5 billion): Here, a shift to Column 2 means a steep tariff increase. For birch-faced plywood, tariffs rise from zero to 30%; for bullets and cartridge shells, zero to 50%; for semi-finished steel products, zero to 20%; and for reaction engines, zero to 35%.
Altogether, then, revoking MFN status for Russia imposes some penalties, but in most cases not very significant ones given Russia’s unusual export pattern. It may nonetheless be an appropriate symbolic and moral gesture, in particular if many WTO members join in it. But as a policy measure meant specifically to impose economic cost, the energy import ban is the one with practical real-world impact.
President Biden on blocking Russia energy imports; also summarizes current sanctions, coordination with allies, and measures to ease impacts at home.
Trade Subcommittee Chair Rep. Earl Blumenauer on the case for revoking Russia’s PNTR.
Finance Committee Chair Wyden with a similar bill.
A quick PPI table: The top 25 U.S. imports from Russia (at HTS-8 level in tariff lingo, accounting for 87% of the $26 billion in U.S. imports from Russia last year), with import value, tariff code, and MFN/non-MFN rates:
Tariff System Background
The Harmonized Tariff Schedule, from the U.S. International Trade Commission (MFN rates in Column 1, non-MFN in Column 2).
Also from the ITC, the invaluable (though a bit challenging for those not yet initiated into tariff codes) Dataweb allows you to check imports, exports, and balances country-by-country and product-by-product.
And trade policy historian Doug Irwin looks back at the notorious Tariff Act of 1930.
A Note on Platinum-Group Metals
Where does it hurt? Overall, Russia is a modest U.S. trading partner, supplying 1% of U.S. imports and buying 0.3% of exports. Though the largest chunk of this is energy (again, $16 billion of $26 billion in total imports, and of $32 billion in total trade), adjustment for the U.S. might be most challenging in a few specialty metals (e.g. palladium and rhodium, “platinum-group” metals used in automotive engines to absorb pollutants in exhaust, in medical device manufacturing, and so on). The U.S. Geological Survey’s summary of platinum-group metal reserves around the world suggest it isn’t impossible. Russia has a lot, but South Africa has more, and the U.S. and Canada have some, too.
Here’s where it is — Sibanye Stillwater, a South African-owned U.S. mine in Montana, is the principal non-Russian source of palladium.
Ed Gresser is Vice President and Director for Trade and Global Markets at PPI.
Ed returns to PPI after working for the think tank from 2001-2011. He most recently served as the Assistant U.S. Trade Representative for Trade Policy and Economics at the Office of the United States Trade Representative (USTR). In this position, he led USTR’s economic research unit from 2015-2021, and chaired the 21-agency Trade Policy Staff Committee.
Ed began his career on Capitol Hill before serving USTR as Policy Advisor to USTR Charlene Barshefsky from 1998 to 2001. He then led PPI’s Trade and Global Markets Project from 2001 to 2011. After PPI, he co-founded and directed the independent think tank ProgressiveEconomy until rejoining USTR in 2015. In 2013, the Washington International Trade Association presented him with its Lighthouse Award, awarded annually to an individual or group for significant contributions to trade policy.
Ed is the author of Freedom from Want: American Liberalism and the Global Economy (2007). He has published in a variety of journals and newspapers, and his research has been cited by leading academics and international organizations including the WTO, World Bank, and International Monetary Fund. He is a graduate of Stanford University and holds a Master’s Degree in International Affairs from Columbia Universities and a certificate from the Averell Harriman Institute for Advanced Study of the Soviet Union.
Read the full email and sign up for the Trade Fact of the Week

