| Country | Value |
|---|---|
| Iran | 54 |
| China | 42 |
| Russia | 36 |
| Saudi Arabia | 34 |
| Canada | 26 |
| World Total | 24 |
| India | 23 |
| United States | 19 |
| Indonesia | 17 |
| Japan | 16 |
| European Union | 10 |
| United Kingdom | 8 |
| Sweden** | 5 |
| Ireland** | 5 |
| Singapore** | 5 |
| Switzerland** | 5 |
Source: EDGAR, the EU’s “Emissions Database for Global Atmospheric Research”
** A 4-way tie for lowest emissions intensity rate among major economies.
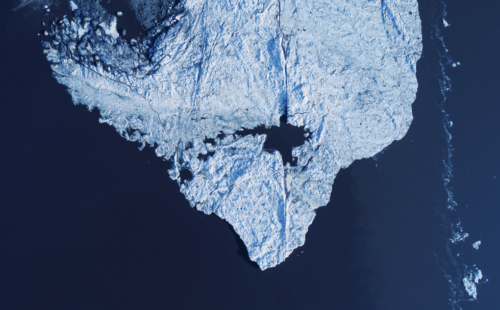
The Arctic sea ice expands and contracts like a lung, growing through autumn and winter to a late-March peak, then shrinking back over the summer to a mid-September “minimum.” The 2024 minimum is likely this week. Reviewing their 46 years of data, the National Snow and Ice Data Center in Colorado concludes that it will be the fourth-smallest on record:
“With the waning of sunlight, the pace of sea ice loss in the Arctic is slowing, and the seasonal minimum is expected in mid-September. While a new record low is highly unlikely, extent at the beginning of September is below many recent years. Both the northern and southern Northwest Passage routes have largely cleared of ice, as has the Northern Sea Route. … Antarctic ice extent is approaching its seasonal maximum and is near last year’s record low. Arctic sea ice extent as of August 31 was 4.55 million square kilometers (1.76 million square miles), fourth lowest in the 46-year passive microwave record for that date.”
NSDIC says Arctic ice cover has contracted by about 10% per decade since the millennium. The cumulative loss of ice, averaged over a full year, comes to 3.2 million square kilometers — a space of water about as big as India — and means ice coverage is down about 40% from the 8 million square kms typical of the 1980s. The ice is also (a) thinner — now mostly 2 to 3 meters from top to seawater, which is about half the 5-meter average Norwegian polar explorer Fridtjof Nansen found on his first-ever Arctic ice transit in 1893 — and (b) younger. In the 1980s, “old” ice four years old or more made up about a third of polar ice volume, and “new” ice less than one year old likewise a third; this decade, about 5% of ice is “old” and 70% “new.”
The diminished polar ice cap is an especially visible reminder that governments and industries have limited time to think and argue. Moving from ice to emissions, statistics from the EU’s EDGAR database — updated Thursday for 2023 emission totals, a day after the NSIDC published its 2024 Arctic minimum estimate — suggest three things. One, worldwide, the “battle” to contain climate change, if “battle” is the right metaphor, is being lost. Two, it’s being lost mostly in large middle-come countries – though carbon emissions from rich countries are now falling, those from China in particular, and also India and some other big countries, more than offset these drops; and three, the “battle” isn’t lost yet. Here’s a summary:
Totals: The number that counts for ice, forests, corals, northern mammals, sea life, arable land, and coastal community safety is the level of greenhouse gases in the atmosphere. Here the annual human contribution continues to rise. In 2000, human carbon dioxide emissions came to 25.2 billion tons. The 2023 total was 39.0 billion tons, meaning annual CO2 emissions are up 50% so far this century. Alternatively, since 2020 (an unusually low year because of the COVID pandemic), carbon emissions are up by 2.9 billion tons, or 8%.
Emission by country: Within this big emissions total, smaller country-by-country shares (based on territorial output) have sharply changed. The “developed” world — the U.S. and Canada; the EU, the U.K., Switzerland, Norway, and Iceland; Japan, Taiwan, and Korea; Israel; Australia and New Zealand — has cut annual carbon dioxide emissions by 2.5 billion tons since 2000. Though they are still far from “net zero,” they are trending down at an accelerating pace. Annual CO2 emissions from the rest of the world, though, are up 16 billion tons, including by 9.6 billion tons in China, 2.0 billion tons in India, and about 4.0 billion tons elsewhere. In sum, the growth of Chinese and middle-income country emissions has far outdistanced the “developed” countries’ reduction.
“Emissions intensity”: Against this overall growth of emissions, trends in emissions “intensity”– that is, the amount of carbon produced per dollar of output — offer some reason for guarded optimism. The United States and Europe have not cut emissions by getting poorer but by growing more efficient. In 2000, Americans produced 38 grams of carbon for each dollar of (real, inflation-adjusted) GDP, and EU countries 21 grams. By 2023, the U.S. was down to 19 grams per dollar, and the EU to 10, and the world’s most carbon-efficient economies suggest that there’s still a lot of room to improve. The U.K. and France are at 8 grams of carbon per dollar, Denmark 6 grams, and Sweden, Ireland, Singapore, and Switzerland set the world standard at 5 grams.
This positive trend isn’t unique to the wealthy world: Chinese emissions intensity is down 44% – from 73 grams per dollar in 2000 to a still-high 42 last year since 2000 — and India’s by 24%. In only three of the top 20 emissions sources — Iran, Saudi Arabia, and Vietnam — has intensity grown since 2000. Here’s a table summarizing emissions from the largest country sources, including total CO2 emissions in 2023, change in this total since 2000, and change in emissions intensity since 2023, with positive trends colored green and negative ones red:
| Country | 2023 Emissions (billion tons) | Change 2000-2023 | Emissions/GDP ratio change since 2000 |
|---|---|---|---|
| World | 39.0 | +13.3 billion tons | -27% |
| China | 13.3 | +9.6 | -44% |
| United States | 4.7 | -1.2 | -50% |
| India | 3.0 | +2.0 | -24% |
| EU | 2.5 | -0.9 | -52% |
| Russia | 2.0 | +0.4 | -36% |
| Japan | 0.9 | -0.3 | -36% |
| Iran | 0.8 | +0.4 | +10% |
| Indonesia | 0.7 | +0.4 | -26% |
| All other | 8.1 | -0.2 | -44%** |
* Using EDGAR data released last week. Other estimates, such as those by IEA, differ slightly but not fundamentally.
** Not available in EDGAR; PPI estimate using World Bank GDP data.
Final point: The Ireland/Singapore/Sweden/Switzerland 5-grams-per-dollar intensity standard is much better than any very large emissions source country has achieved. But their diverse economic mix — Ireland and Singapore with lots of high-end manufacturing and big computer servers; Sweden, Switzerland, and Ireland with big farm and livestock sectors; Sweden with its six auto plants; Switzerland and Singapore as services and logistical centers — suggests that bigger countries should be able to match their record. Had the world’s top 8 emissions sources done so, their emissions would have been 5.8 billion tons rather than 28 billion tons last year, and as a group, they would have been 80% of the way to net zero. So, that’s not an impossible goal, or even an unrealistic one. The ice bulletins say clearly that the ‘battle’ isn’t now being won. But it isn’t yet lost.
Ice at the Pole –
The National Snow and Ice Data Center reports on this year’s Arctic ice minimum.
… and for a look at the mountains, the National Park Service on Glacier Park.
Emissions data sources –
The European Union’s EDGAR (“Emissions Database for Global Atmospheric Research”) database, out last Thursday.
The International Energy Agency’s report for 2023, from last March.
Direct reports –
German scientist Markus Rex recounts the two-year “MOSAIC” mission, in which a specially equipped icebreaker sealed itself into the Arctic ice in 2022 north of Svalbard, and came out on the other side near Greenland two years later.
Fridtjof Nansen’s wooden Fram did the same thing in the first successful Arctic Ocean research and survey mission, from 1893 to 1896. The Fram bogged down (though it was later recovered); Nansen, after making the first estimates of Arctic ice thickness, ocean depth, and wildlife diversity, got to Greenland by sled and kayak.
Trade & policy –
The European Union’s Carbon Border Adjustment Mechanism.
The International Maritime Bureau on efforts to cut ship emissions (which, per EDGAR, are about 0.8 billion tons of carbon dioxide a year, roughly equivalent to seventh-ranking Iran).
Policy and research from top performers and one of the most threatened countries –
Singapore, with Asia’s most efficient emissions intensity, looks at climate change impact at home.
Ireland’s Environmental Protection Agency.
Sweden’s Bolin Institute at the University of Stockholm.
Switzerland’s climate strategy.
And Bangladesh’s Ministry of Environment, Forests, and Climate Change.
Ed Gresser is Vice President and Director for Trade and Global Markets at PPI.
Ed returns to PPI after working for the think tank from 2001-2011. He most recently served as the Assistant U.S. Trade Representative for Trade Policy and Economics at the Office of the United States Trade Representative (USTR). In this position, he led USTR’s economic research unit from 2015-2021, and chaired the 21-agency Trade Policy Staff Committee.
Ed began his career on Capitol Hill before serving USTR as Policy Advisor to USTR Charlene Barshefsky from 1998 to 2001. He then led PPI’s Trade and Global Markets Project from 2001 to 2011. After PPI, he co-founded and directed the independent think tank ProgressiveEconomy until rejoining USTR in 2015. In 2013, the Washington International Trade Association presented him with its Lighthouse Award, awarded annually to an individual or group for significant contributions to trade policy.
Ed is the author of Freedom from Want: American Liberalism and the Global Economy (2007). He has published in a variety of journals and newspapers, and his research has been cited by leading academics and international organizations including the WTO, World Bank, and International Monetary Fund. He is a graduate of Stanford University and holds a Master’s Degree in International Affairs from Columbia Universities and a certificate from the Averell Harriman Institute for Advanced Study of the Soviet Union.

