| 1917-1918 | -11.8 years |
| 1902-1904 | -3.9 years |
| 1942-1943 | -2.9 years |
| 2019-2021 | -2.4 years |
The first April edition of the Centers for Disease Control’s (CDC) Mortality and Morbidity Weekly is uncharacteristically upbeat. It reports that in 2022, American life expectancy rose by a year and a month, to 77.5 years from the 76.4 years of 2021, pushed u by falling COVID mortality, a two-year drop in homicide rates, and other factors. This jump, though, followed a loss of 2.6 years during the COVID-19 pandemic, from 78.8 years in 2019 to 77.0 in 2020 and then 2021’s 76.4. The two-year decline was America’s worst in the 80 years since World War II, and the fourth-worst in CDC’s records going back to 1900.
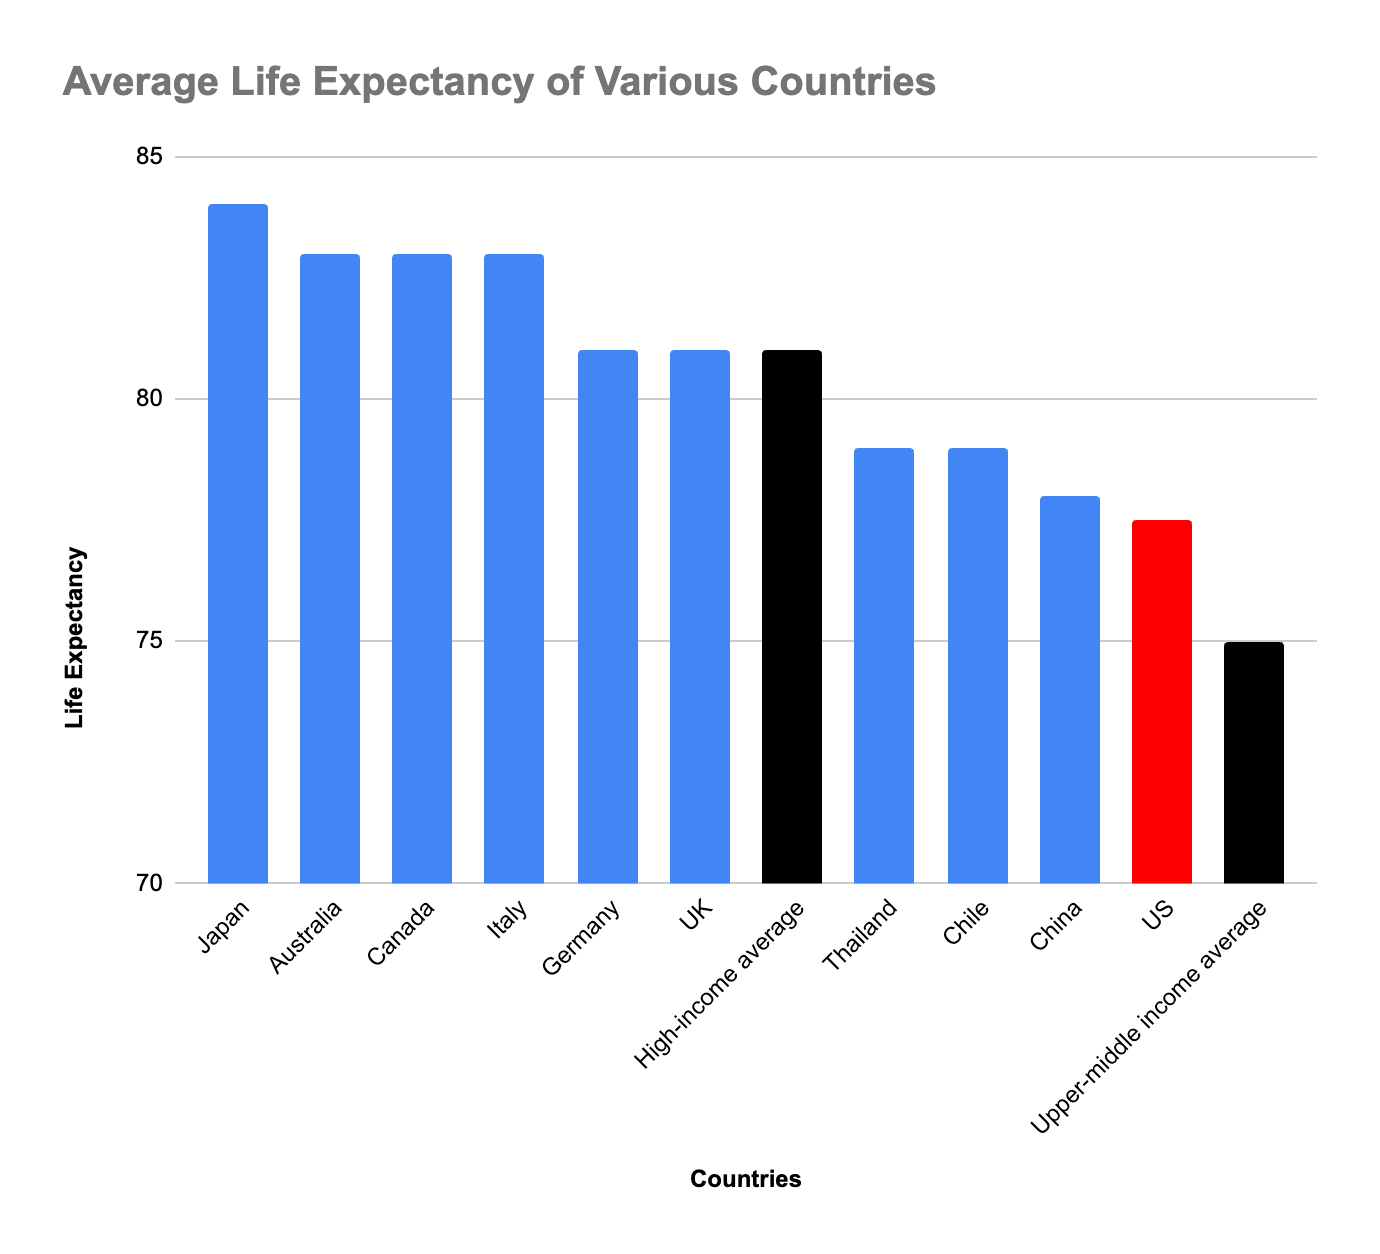
In international context, American’s overall pandemic life expectancy decline was sharp but not extraordinary. The World Bank reports a 2-year average life expectancy loss across the globe, and the actual difference might be less, since the Bank rounds to full years rather than using the CDC’s tenths. But nonetheless, the overall U.S. level remains strange, disturbing, and low: Americans get two years less life expectancy than the Bank’s 80-year “high-income country” average, and seven years less than the 84 and 85 reported for Switzerland, Korea, Japan, and Hong Kong at the very top of the World Bank’s table. The U.S., meanwhile, is in a group near the top of the Bank’s middle-income bracket, a bit below the 79-year averages for Thailand, Chile, and the United Arab Emirates, and equal to China’s 78.
The temptation is to ask: Why is American life so short? But this probably puts the question the wrong way. The single 77.5-year U.S. national life-expectancy average conceals extreme variation — by place, by race and ethnicity, by gender, and by education – with some groups of Americans in the high-income tier, and others with life expectancy more like those of lower-middle income or even least-developed countries. The COVID-19 pandemic loss likewise was not identical across the country, but magnified for some groups. In particular, research by Anne Case and Angus Deaton shows that from 2019 to 2021, life expectancy fell by one year for college-educated Americans while plunging by four for their high-school-only neighbors. A more detailed look suggests both reasons for the disparities and the dramatically different effects of the pandemic: pre-existing health patterns and their effects; the lag in regions where state governments have not expanded Medicaid; and the poor crisis-era presidential leadership in 2020. As a point of departure, here’s a table of life expectancies at birth worldwide and in the United States, using the World Bank’s figures for countries and regions and CDC’s for American states and demographic groups:
| Asian American women (2022) | 86.3 years |
| Japan (2021, longest country life expectancy) | 84 years |
| Hawaii (2020, longest U.S. state life expectancy) | 80.7 years |
| High-income country average (2021) | 80 years |
| Thailand (2021) | 79 years |
| U.S. (2022) | 77.5 years |
| U.S. (2021) | 76.4 years |
| U.S. (2019) | 78.8 years |
| Mississippi (2020, shortest U.S. state life expectancy) | 71.9 years |
| World (2021) | 71 years |
| Brazil (2021) | 71 years |
| Mexico (2021) | 70 years |
| Native American men (2022) | 64.6 years |
| Haiti (2021) | 63 years |
| Least-developed country average (2021) | 62 years |
| Chad (2021, shortest country life expectancy) | 53 years |
With this in the background, a more precise question might be: Why are the lives of some groups of Americans so much shorter than others? Look closer:
States and regions: The CDC’s most recent state-by-state table covers 2020, a year into the pandemic decline. It reveals a gap of nine years between the lowest- and highest-expectancy states. At the low end, Mississippi’s 71.9 years and West Virginia’s 72.8 resemble national figures for Peru, Armenia, Bangladesh, and Mexico. More generally, life expectancies are shortest — 71 to 74 years — across the Deep South and Appalachia, whose international regional matches include the Middle East at 73 years and the Caribbean at 72. Hawaiians, the longest-lived Americans, have life expectancies equal to the 81-year expectancies in Germany and the U.K. Washington, Minnesota, California, Massachusetts, New Hampshire, Oregon, and Vermont are a bit lower, clustered around 79 years. By region, the longest lifespans – the group between 78 and 81 years in 2020 – are in New England, the West Coast, and the Rocky Mountain West. This doesn’t match the Japan/Switzerland/Hong Kong tier, but it is close to Western Europe, China, and Taiwan. A policy/social observation: in the regions with the lowest life expectancy, homicide rates are highest and governments are least likely to have expanded Medicaid eligibility.
Race/gender/ethnicity: U.S. life expectancy varies even more widely by race, gender, and ethnicity than by geography. Dividing the population this way yields a life-expectancy range of 23 years, within sight of the 32-year spectrum dividing the world’s shortest-lived country (Chad at 53) from its longest-lived (Japan at 84). The 11 million Asian-American women now have a life expectancy of 86.3 years, longer than any of the 228 countries and territories in the World Bank’s tables. (But still a shade below the 87 years for women in Japan.) The 2.5 million Native American men are the shortest-lived group with a life expectancy of 64.6 years — barely above the 64-year average across the UN’s least-developed countries and Haiti’s 63 years, even with a two-year rebound from the 62.2 years in 2021. Between these poles, life expectancy in 2022 was 84.5 for Asian Americans; 80.0 for American Hispanics; 77.5 for non-Hispanic white Americans, mirroring the national average; 72.8 for African Americans; and 67.9 for Native Americans. In each case, women on average outlived men, by four to seven years.
Education level: Finally, using a somewhat different approach — healthy life expectancy at 25, as opposed to at birth — Americans with college degrees can expect nine years more life than Americans with high school diplomas or less. This gap widened sharply during the COVID pandemic, when (measuring from 2019 to the 2021 low), high-education Americans lost one year of life expectancy and non-college Americans four years. Three contributors to this sudden widening of the gap:
(a) Pre-existing vulnerabilities: Pre-COVID risk indicators show that less educated people were more vulnerable to a pandemic to begin with. Obesity and smoking rates, for example, are 36% and 28% among Americans with less than a college education, as opposed to 28% and 6% for college graduates.
(b) More exposed during the pandemic: Differing pandemic-era work patterns left working-class people more exposed. Workers in many upper-education careers — law firms, financial services, universities, high-level civil service, business managers – were often able to work from home in relative safety. Blue-collar workers — bus drivers, security guards, janitors, food-manufacturing workers, grocery store stockers and cashiers — by contrast were more likely to work on-site, and so were in greater danger.
(c) Poor presidential leadership: COVID vaccination rates were lower among non-college Americans — a 2023 NIH review shows 79% vaccination rates for college graduates and 49% for high school diploma or less – making infection more dangerous for this group. This suggests that less educated people, in particular, those attracted to “populism,” may have been more susceptible to anti-vaccination propaganda and premature de-masking, and more likely to be misled by Mr. Trump’s erratic and perhaps panicky oscillation between vaccine advocacy and flirtation with pseudo-remedies such as irradiation and animal medicines.
With this in the background, America’s low life expectancy seems less a general national problem than an acute issue concentrated in specific regional and demographic groups, and influenced both by state-level policy and crisis leadership. So reading the Morbidity and Mortality Weekly offers a mix of reassurance about recovery from the pandemic, sadness about poor choices, and longer-term hope that the country’s record can in principle get better.
Overall:
CDC’s take on 2022, in the April 4th Mortality and Morbidity Weekly.
And the World Bank’s life expectancy by country/region/world, mostly through 2021.
More detail:
CDC’s report on 2021, from National Vital Statistics’ November 2023 release.
… State-by-state life expectancy from 2018 to 2020.
… and a map of obesity prevalence correlates fairly closely with state life expectancy.
The National Institutes of Health report on vaccination rates, including by education.
Anne Case and Angus Deaton, writing for the Brookings Institution last year, highlight the life expectancies gaps separating college-educated from high-school-only Americans, and the COVID-era plunge for the latter.
Long-term perspective:
The CDC’s figures over the past 125 years show life expectancy at a dismal 47 years in 1900. (No vaccinations, no blood transfusions in accidents, no antibiotics or anti-inflammatory medicines, infant mortality at 157 deaths per 1,000 births as opposed to today’s 5.5.). Having risen to 54 by 1916, this crashed back down to 39 in 1918 — easily the worst event in the CDC’s statistical records, reflecting the 126,000 AEF soldiers killed in spring and summer World War I campaigns, and the 675,000 dead in that autumn’s Spanish Flu epidemic. Rebounding in the early 1920s, life expectancy reached 60 years by 1930 and 66 by 1941, then fell back to 63 in 1943. (Meaning the COVID pandemic’s impact was close to that of World War II.) The 70-year mark comes in 1960, after which life gets steadily longer for 50 years — 71 years in 1970, 74 in 1980, 75 in 1990, 77 in 2000, and 79 in 2010. Then came a plateau till 2019, followed by the 2.4-year drop to 2021 and the 2022 rebound. The CDC’s long view.
And the longest-lived country:
Asahi Shimbun on Japanese life expectancy, also slightly down during the pandemic.
Ed Gresser is Vice President and Director for Trade and Global Markets at PPI.
Ed returns to PPI after working for the think tank from 2001-2011. He most recently served as the Assistant U.S. Trade Representative for Trade Policy and Economics at the Office of the United States Trade Representative (USTR). In this position, he led USTR’s economic research unit from 2015-2021, and chaired the 21-agency Trade Policy Staff Committee.
Ed began his career on Capitol Hill before serving USTR as Policy Advisor to USTR Charlene Barshefsky from 1998 to 2001. He then led PPI’s Trade and Global Markets Project from 2001 to 2011. After PPI, he co-founded and directed the independent think tank ProgressiveEconomy until rejoining USTR in 2015. In 2013, the Washington International Trade Association presented him with its Lighthouse Award, awarded annually to an individual or group for significant contributions to trade policy.
Ed is the author of Freedom from Want: American Liberalism and the Global Economy (2007). He has published in a variety of journals and newspapers, and his research has been cited by leading academics and international organizations including the WTO, World Bank, and International Monetary Fund. He is a graduate of Stanford University and holds a Master’s Degree in International Affairs from Columbia Universities and a certificate from the Averell Harriman Institute for Advanced Study of the Soviet Union.

