| Country | 2000 | 2022 | Decline |
|---|---|---|---|
| Sierra Leone (highest rate 2022) | 138.3 | 76.0 | -45% |
| Estonia (lowest rate 2022) | 8.7 | 1.5 | -83% |
| Least-developed countries | 108.6 | 42.3 | -61% |
| World | 53.0 | 27.9 | -47% |
| High-income countries | 6.9 | 4.1 | -41% |
| United States | 7.1 | 5.6 | -22% |
Deaths in the first year of life, per thousand live births. World Bank for world and regions; CDC’s most recent release for the U.S. rate in 2022. Note that the CDC has recalculated the U.S.’ 2000 figure to 6.9 per 1000.
“Natalism,” the view that governments should encourage people to have children, can come in modest and supportive forms: child tax credits, cash subsidies for child care, and so on. Few are extremely successful. More exotic approaches — e.g. Vice Presidential candidate Vance’s haranguing of childless couples as in some way letting down the country — aren’t at all likely to do better. An alternative suggestion: improve the protection of children once they’re born. Here a remarkable 21st-century international success — a sharp drop in infant mortality almost everywhere, fastest on average in poorer countries but also clear in Europe, Australia, and Japan — highlights an area where Americans should do better. The background and the contrast:
20th-century success: In the very long view, American infant mortality has declined drastically — by 99.4% — since 1915, when the Labor Department’s newly formed Children’s Bureau first estimated a national infant mortality rate. Their statisticians found 99.9 deaths in the first year of life per every 1,000 births that year, for a 10% infant mortality rate. Earlier rates were likely even higher — Michigan’s health department, for example, reported 15.7% state infant mortality in 1900 — and the Bureau believed 30% of all deaths in the U.S. were of children five years or younger. To put these figures in perspective, the death rate for soldiers in the Union Army was 13.4%; and according to World Bank tables, the highest national infant mortality rates today are Sierra Leone’s 76 per 1,000 and the Central African Republic’s 74. Or, to move from data to family life, early childhood death was common, and neither power and wealth, nor education, nor medical education seem to have been defenses: three of Abraham and Mary Lincoln’s four children died young, as did four of Karl and Jenny Marx’s seven, three of Louis and Marie Pasteur’s five, and two of Charles and Emma Darwin’s ten.
The causes were fairly simple: (a) bad sanitation, especially contaminated milk and water; (b) no vaccines, anti-inflammatory medicines, or antibiotics; and (c) poor or non-existent primary health care. Over the next decades, with public health and sanitation laws, new medicines, vaccination campaigns, Medicaid insurance for the poor, and other policy innovations, the figures collected by the Children’s Bureau and its successors at the Centers for Disease Control steadily improved: 60 deaths per thousand births by 1930, 40 by 1940, 26 by 1960, 10 by 1980, and 7.1 (since recalculated to 6.9) as CDC published its “Achievements in Public Health ” retrospective in 2000.
But more recently: Placed against this 20th-century achievement, the U.S.’ 21st-century record looks mediocre at best. CDC’s most recent calculation of the national infant mortality rate (for 2022, out in late July) is 5.6 deaths per 1,000 births. This is 22% below the rate of 2000 and actually up from 5.4 deaths in 2021 – the largest jump in 20 years.
Meanwhile, the rest of the world has cut infant mortality by nearly half. It’s tempting to put the relatively poor U.S. performance in a good light by noting that the high worldwide rate reflects remarkable successes in lower-income countries, and/or assuming that public health policy might have a diminishing rate of return, with infant mortality reduction slowing naturally as rates fall and at some point stopping.
The first of these points is true. Most of the low- and middle-income world has cut infant and childhood deaths deeply and fast since 2000. Uzbekistan, for example, has cut infant mortality by 77% since 2000, Cambodia by 76%, Armenia and Morocco by 66%, Bangladesh by 62%, Ethiopia 61%, Egypt 59%, El Salvador 57%, Indonesia 56%, Honduras 55%, Timor-Leste 53%, and Ghana 51%. But the second isn’t. The U.S.’ rate was near the ‘developed’-world average in 2000, is now clearly higher, and has fallen more slowly than most. As an example, Japan’s 3.2 per 1000 rate was the world’s lowest in 2000, and has fallen at exactly the world average rate to 1.7 per 1000. A representative table of large and advanced economies:
| Country | 2022 Infant Mortality Rate | Drop since 2000 |
|---|---|---|
| China | 4.8 | -84% |
| Australia | 3.2 | -63% |
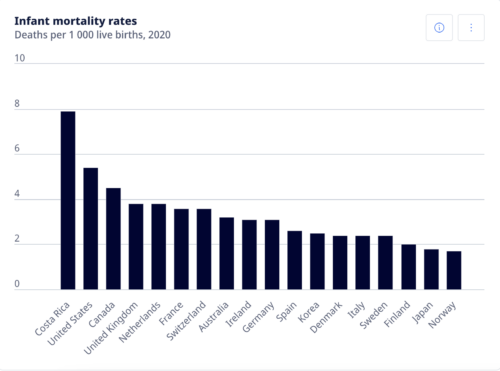
| Korea | 2.5 | -63% |
| Ireland | 2.7 | -60% |
| India | 25.5 | -62% |
| Italy | 2.2 | -53% |
| World | 27.9 | -47% |
| Japan | 1.7 | -48% |
| Spain | 2.5 | -43% |
| United Kingdom | 3.6 | -39% |
| Germany | 3.0 | -32% |
| United States | 5.6 | -22% |
| France | 3.3 | -19% |
| Canada | 4.3 | -19% |
What explains this? And what might be done?
One explanation comes from internal disparities: differing experiences by geography, by race, and ethnicity, and differing rates of change over time. Some comparisons:
* State and region: By state, Massachusetts has the lowest U.S. infant mortality rate at 3.2 per 100 births; Mississippi’s 9.1 per thousand is the highest. By region, rates in New England, the mid-Atlantic, and the West Coast are well below the national averages and within a standard rich-country range. Rates in the deep South and Vance’s Ohio-Indiana-West Virginia region are typically above 7 per thousand.
* Race and ethnicity: Infant mortality rates range from 3.7 per thousand in Asian American families through 4.4 in non-Hispanic white families, 4.8 in Hispanic families, 7.5 in Native American, and 10.6 in African American families.
* Change over time: By race and ethnicity, declines over time are not vastly different. Regionally, however, some parts of the country have cut infant mortality noticeably faster than others. The best state record since 2000 is the District of Columbia’s 60% reduction, followed by drops of 45% in New Jersey and North Dakota, 39% in Rhode Island, 36% in Massachusetts, and 35% in New Hampshire. Recent studies suggest a couple of commonalities in the latter group. One is non-participation in the Affordable Care Act’s Medicaid expansion, which improved access to prenatal and maternal care for lower-income moms. Another is the imposition of abortion restrictions since the Supreme Court overturned Roe v. Wade in 2022, often vaguely written and applicable to many different situations, which may be both keeping patients from seeking care and deterring providers from working in the relevant areas.
Perhaps related to both of these themes is an ominous trend in rural health care: maternity care seems to be getting steadily harder to find, and both expectant mothers and infants therefore face rising risk. Health consultancy Chartis summarizes:
“More than 400 maternity programs closed nationwide between 2006 and 2020. In rural communities, the disappearance of OB services has been particularly impactful. Between 2011 and 2021, 267 rural hospitals closed OB services, representing 25% of all rural OB units in the United States.”
To put these figures in context, there are 2,168 maternity hospitals in the United States. So at least in remote areas, health care options are fewer and further away than they were a generation ago. And bringing this from policy and data to family life, the CDC reports 20,577 infant deaths in 2022. Had the U.S. achieved Japan’s world-standard 1.7 per thousand infant mortality rate, 14,300 of them would have lived. The EU’s 3.1 per thousand rate — which is certainly possible, since it’s not far away from the New England average — would have kept 9,200 alive.
So: For those wanting more American children, Vance’s “browbeating” approach is pretty certainly useless, and more prosaic things — child tax credits and child care support, better access to prenatal and perinatal care, primary health in general, “keeping clinics open in places where they’re closing” — are good ideas. We can, really, do a lot better.
Source: OECD
U.S. –
CDC has infant mortality rates, overall and by race and ethnicity.
… a state-by-state map.
Chartis on closures of rural maternity wards.
NIH on Medicaid expansion.
… and a study looking at Medicaid expansion, post-Dobbs abortion restrictions, and changes in infant mortality rates.
World perspective –
The World Bank has rates for 1990, 2000, and 2014 through 2022 across all countries and for regions and income groups.
… and a sample of its data:
| Country | 2000 | 2022 | Decline |
|---|---|---|---|
| China | 29.9 | 4.8 | -84% |
| Estonia | 8.7 | 1.5 | -82% |
| Uzbekistan | 51.4 | 11.9 | -77% |
| Mongolia | 48.4 | 11.5 | -76% |
| Turkey | 30.9 | 8.5 | -73% |
| Cambodia | 79.0 | 22.3 | -72% |
| Armenia | 27.0 | 9.2 | -66% |
| Australia | 5.1 | 3.2 | -63% |
| Bangladesh | 63.0 | 24.1 | -62% |
| Least-developed countries | 108.6 | 42.3 | -61% |
| Ethiopia | 87.4 | 33.9 | -61% |
| El Salvador | 24.6 | 10.5 | -57% |
| Indonesia | 40.9 | 18.1 | -56% |
| Honduras | 30.5 | 13.8 | -55% |
| Ireland | 6.0 | 2.7 | -55% |
| Italy | 4.7 | 2.2 | -53% |
| Timor-Leste | 87.3 | 41.5 | -53% |
| Mexico | 23.6 | 11.5 | -51% |
| Japan | 3.3 | 1.7 | -48% |
| European Union | 5.9 | 3.1 | -47% |
| World | 53.0 | 27.9 | -47% |
| Jordan | 22.6 | 12.2 | -46% |
| Sierra Leone | 138.6 | 76.0 | -45% |
| High-income countries | 6.9 | 4.1 | -41% |
| United States | 7.1 | 5.6 | -24% |
| Canada | 5.3 | 4.3 | -19% |
| Jamaica | 17.5 | 16.1 | -8% |
Success stories –
In 2000, the capital’s infant mortality rate, at 13.5 deaths per 1,000 births, was nearly twice the national average. As of 2022, it was 5.5, down by 60% and equal to the national average. Mayor Bowser’s health division, with links to perinatal and infant health services and reporting.
UNICEF looks at newborn health care in Uzbekistan.

