Summary: Based on new “digital economy” data from a recent BEA working paper, we calculate that the labor share of the digital sector has risen since 2007, while gross margin of the digital sector has fallen over the same period. This result is consistent with strong competition in the digital product and labor markets (see the research note here).
In March 2018, the Bureau of Economic Analysis (BEA) released a working paper called “Defining and Measuring the Digital Economy.”[1] The working paper presented BEA’s initial work “to lay the foundation for a digital economy satellite account.”
The BEA authors focus on outlining their definition of the digital economy, and calculating its real growth and share of GDP. However, their data allows us to calculate two other policy-relevant measures of the digital economy: Labor share and gross margin.
Labor share is a measure of how much of the income of an industry is going to workers. For the purposes of this paper, we define the labor share as compensation (COMP) divided by value-added (VA), expressed as a percentage. [2]
Gross margin is a measure of the profitability of an industry per unit of sales. In the business literature, gross margin is a company’s total sales revenue minus its cost of goods sold, divided by total sales revenue, expressed as a percentage.[3]
For our purposes, we define gross margin as an industry’s total gross output (GO), minus the cost of intermediate inputs (II) and labor compensation (COMP), divided by total gross output, expressed as a percentage.[4]
Based on this definition, labor share in the private sector has trended down since at least 1990 (Table 1). Similarly, private sector gross margin have trended up since at least 1990. Since 2007, private sector labor share has fallen by 0.8 percentage points, and private sector gross margin has risen by 1.9 percentage points.[5]
| Table 1: Private Sector: Falling Labor Share, Rising Gross Margin | |||
| 1990 | 2007 | 2016 | |
| Labor Share | 52.2% | 50.6% | 49.8% |
| Gross Margin | 26.0% | 26.7% | 28.6% |
| Data: BEA (as of April 2018) | |||
| Table 2: Digital Sector: Rising Labor Share, Falling Gross Margin | |||
| 2007 | 2016 | ||
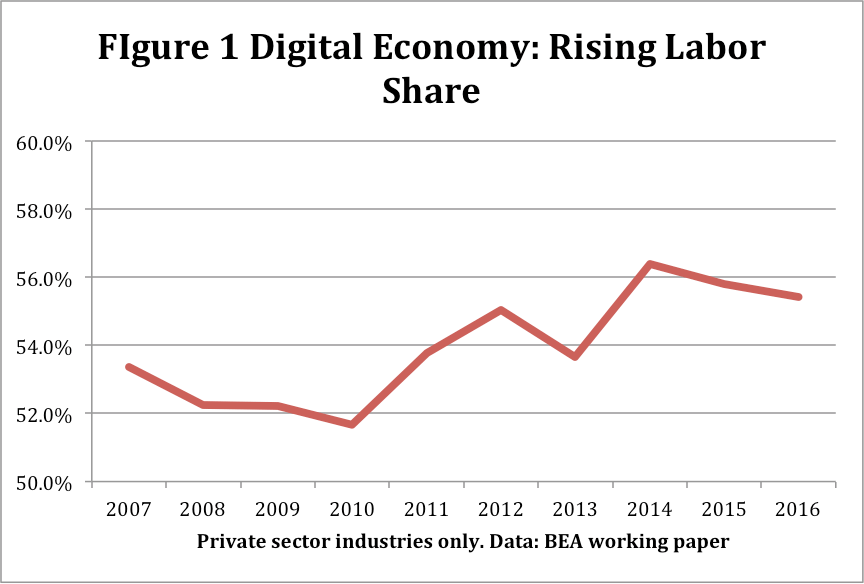
| Labor Share | 53.4% | 55.4% | |
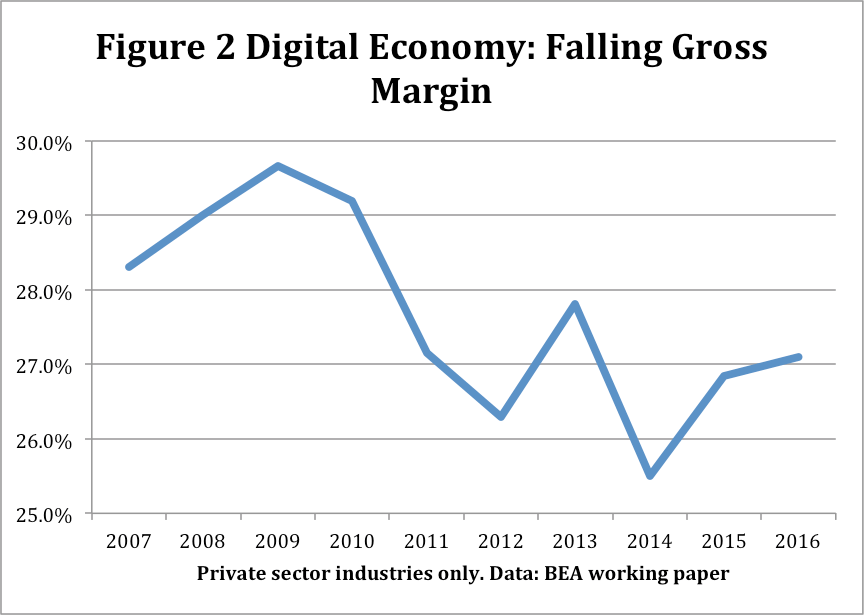
| Gross Margin | 28.4% | 27.2% | |
| Private sector industries only. Data: BEA working paper | |||
The digital economy data from the BEA allows us to calculate the labor share and gross margin for the digital sector of the economy (Table 2). We see that labor share for private industries in the digital sector rose by 2 percentage points in the post-2007 “tech boom” period. Gross margin fell by 1.2 percentage points.
Figures 1 and 2 show the change in the labor share over time. Please note that this data was released prior to the July 2018 benchmark revision.
These results suggest that benefits of productivity growth in the digital sector since 2007 are being shared with workers and customers. This is consistent with strong competition in the digital product and labor markets. By contrast, companies in the broader private sector are benefitting from lower labor share and higher gross margin, which suggest that market power is rising outside of the digital sector.
The PDF version of this research note are found here. The results in this note are drawn from a forthcoming PPI policy paper, “Taking Competition Policy Seriously.”
Definition of Measures
Labor share = COMP/VA
Gross margin = (VA-COMP)/GO = (GO- II-COMP)/GO
VA = value-added
COMP = labor compensation
GO = Gross output
II= Intermediate inputs
[1] Kevin Barefoot, Dave Curtis, William Jolliff, Jessica R. Nicholson, Robert Omohundro. “Defining and Measuring the Digital Economy,” March 2018. https://www.bea.gov/digital-economy/_pdf/defining-and-measuring-the-digital-economy.pdf
[2] Several alternative measures of the labor share all have the same general trend.
[3] https://www.investopedia.com/terms/g/grossmargin.asp#ixzz5No688Apd
[4] The numerator includes profit-type income, such as profits, rents, and interest. It also includes taxes on production and imports that are chargeable to business expenses, such as state and local sales and property taxes, and a hodgepodge of state, local, and federal excise taxes.
[5] All data in this note is prior to the July 2018 benchmark revision. We focus only on private industries.

