Our tax code is broken. It’s a simple fact that nearly everyone agrees on, yet year after year our government leaders fail to address it. Meanwhile, the consequences of the overly complex and poorly designed system are felt by middle-class families and entrepreneurs. They benefit little from the existing array of incentives and loopholes, which are mainly targeted to special interests and the wealthy.
However, the hard work of tax reform is now underway. House Ways & Means Chairman Dave Camp (R-Mich.) and Senate Finance Committee Chairman Max Baucus (D-Mont.) are barnstorming the country to hear directly from Americans – learning first-hand about the inefficiencies of the current system, and how taxpayers will be impacted by an array of proposed reforms.
Ultimately, the most likely feedback they will hear is the need for simplification of a system that has simply grown too complex for most Americans to understand, with damaging consequences to the nation’s economy. The tax code’s byzantine complexity costs business and individuals hundreds of billions in compliance. The IRS’s National Taxpayer Advocate estimated that individual and business taxpayers spend 6.1 billion hours to complete filings. This is money and time wasted.
Foreign Direct Investment (FDI)—investment in the United States by foreign-based companies—has yet to recover to pre-recessionary levels. In 2011, FDI remained 25 percent below 2008 levels, and preliminary 2012 figures suggest an even further drop.
Indeed, almost 6 years after the Great Recession began, the United States continues to wallow in an investment drought. Such weak investment—both from U.S. and non-U.S. based companies—is almost certainly a key factor behind today’s slow-growth economy.
Investment is a critical part of any high-growth strategy. It is the building block for innovation and economic growth. Investment that increases U.S. production— of goods, services and data—creates high-skill, globally competitive jobs and raises incomes.
This report highlights several important facts about foreign investment that shed light on sectors of the U.S. economy. First, energy is one of the fastest growing areas for foreign investment in America, just as it is for U.S.-based company investment. Official data shows foreign direct investment in “petroleum”—oil and gas extraction, refining, and distribution—more than doubled from 2008 to 2011.
Second, our research shows the United States continues to be an important platform for non-U.S. motor vehicle manufacturers. Moderate investment by non-U.S. motor vehicle manufacturers to upgrade and expand existing production lines show the U.S. market continues to be an important part of their business model.
Third, relatively low investment by non-U.S. industrial manufacturers suggests the greatly heralded manufacturing renaissance may not be as robust as some believe. Our research shows companies in this sector engaged in relatively little U.S. investment activity, and in some cases previous U.S. investments were unsuccessful. Such lackluster investment should be considered by policymakers on federal and state levels designing pro-investment growth strategies that target manufacturing.
Finally, a lack of good data on investment from many non-U.S. based companies, particularly those outside of the energy sector, presents a challenge for designing effective U.S. investment policy. Not having access to quality information on the U.S. activities of large non-U.S. companies makes it difficult to why certain companies are investing while others are not.
For this report, PPI considered three categories of investment: energy, motor vehicle, and non-motor vehicle industrial manufacturing. We chose these categories because of their importance to facilitating broader growth in the U.S. economy. We calculated the U.S. capital expenditures for companies in each category in 2011 and 2012, using publicly available financial reports.
This report is part of our “Investment Heroes” series, and follows from our 2012 report “U.S. Investment Heroes: Who’s Betting on America’s Future?” that ranked U.S.-based companies by their 2011 U.S. capital expenditures.
Writing on youth unemployment, Fortune’s Nin-Hai Tseng quotes Diana Carew:
“They’re not in school, so what are they doing?” says Diana Carew, economist at Progressive Policy Institute, who studies youth unemployment. She points out that July’s jobs report shows that the share of unemployed 16- to 24-year-olds not in school stood at 17.1%, compared with 11% six years ago. And while workers in general have been leaving the labor force, partly because they’re aging into retirement, it’s especially worrisome when young people drop out: In July, 8.4 million 16- to 24-year-olds stopped looking for work altogether, a rise from 6.8 million a year earlier.
However slowly the economy has been creating jobs, it’s still surprising why so many young people, particularly those who aren’t in school, are still having a tough time. The bulk of jobs created in July were in retail, restaurants, and bars. These certainly aren’t the highest-paying gigs, but they demand fewer skills and would naturally attract those with less education. What’s played out is what Carew calls “The Great Squeeze,” where the dearth of middle-skilled jobs have forced many workers to settle for whatever they can get, taking lower-skilled jobs for less pay and therefore squeezing those with less education and experience out of the workforce.
Does innovation create or destroy jobs? The rush of new ideas and new technologies can turn formerly rock-solid companies into sand that melts away even as we watch. The sale of the Washington Post is a case in point. By making that deal, the Graham family is acknowledging that they could not see a good strategy for survival.
We know what will happen next: Fewer journalists will be working at the Post a year from now than today. The Grahams allowed the operation to run mammoth losses which Jeff Bezos, rich as he is, will not tolerate. Many people will suffer.
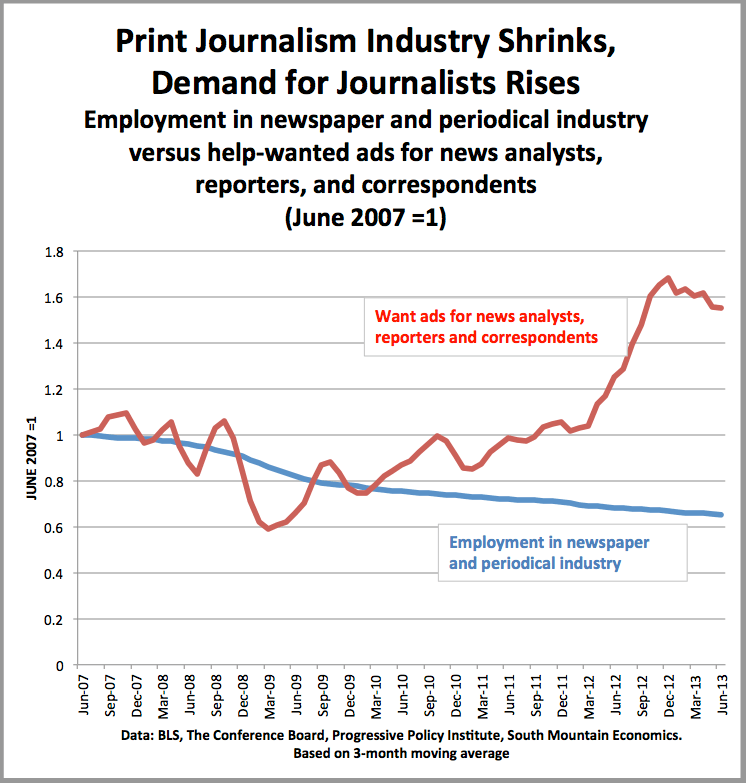
But remember this: Old industries can decline even as new jobs growth. In fact, the field of journalism is going through a massive innovative spurt that is creating jobs even as others are being destroyed. About a month ago I did a post on exactly this subject, where I looked at unpublished BLS data and help-wanted data from The Conference Board. Here’s what I found:
Employment at newspapers is down about 5% over the past year.
The number of help-wanted ads for “news analysts, reporters, and correspondents” is up 15% compared to a year ago.
More people are telling the BLS that they are working as a news analyst, reporter, or correspondent compared to a year ago.
Roughly half the want-ads for news analysts, reporters and correspondents contain the words ‘digital’, ‘internet’, ‘online’, or ‘mobile’.
Let me do this as a chart.This chart plots employment in the newspaper and periodical industry (the blue line) against want ads for “news analysts, reporters, and correspondents” (the red line) We start with June 2007, right before the recession started, and go to June 2013.
We see that print media employment and demand for journalists track pretty well through December 2009. Both drop around 20%. The annual data from the BLS CPS survey (not shown on chart) tells roughly the same story. From 2007 to 2009 employed “news analysts, reporters and correspondents” dropped from 84K to 65K, also roughly a 20% decline.
Ah, but starting with 2010, we see a divergence. Employment in the legacy print media business continues to drop, with no sign of a turnaround. Both newspapers and periodicals continue to close and lay off workers, undermined by online competition in both the news and ad business.
But the demand for journalists picks up sharply. According to data from The Conference Board, the number of want ads for news analysts, reporter, and correspondents more than doubled from early 2010 to today! Moreover, it is noteworthy that the BLS annual series show a 25% gain in the number of working journalists from 2009 to 2012 (not shown on chart)
Now, let’s be realistic. I’m not saying that the true demand for journalists doubled between the beginning of 2009 and today, although given that no one was hiring in the depths of the recession, that statement might be literally true. In fact, the help-wanted series is an example of naturally-generated ‘big data’, meaning that it can be affected by changes in business practices, such as the way jobs are posted. The nature of journalism jobs may also be changing.
However, there seems little doubt that technology and innovation in journalism is creating new jobs in different industries even as the old companies and old industries are being undermined. I’m pretty sure that jobs at Politico are not being reported not in the same industry as jobs at the Washington Post, even if Politico hires a WaPo reporter to cover more or less the same things.
As innovation accelerates, we’ll see more examples of this kind of divergence: Declining old industries, growing new jobs. Our task is to identify where the new jobs are and encourage them.
In July 2013, just 36 percent of Americans age 16-24 not enrolled in school worked full-time, 10 percent less than in July 2007. It’s no secret that young people are struggling economically, but my analysis of Friday’s BLS release sheds light to what extent. The fact that so many young people are not realizing their true earnings potential in these formative years could have serious long-term consequences.
Friday’s numbers are the latest sign the recovery is passing young Americans by. The below chart shows the share of young Americans not enrolled in school working full-time fell with the recession and have yet to return to 2007 levels. This is true even if we divide it by age – that is, for both young Americans age 16-19 and age 20-24 not enrolled in school in July.
While the initial drop in full-time employment is not surprising, what is startling is that is that either age group is showing much, if any, improvement since the recovery began four years ago. The same trend holds even if we look at months where more students are enrolled in school (i.e., January). The non-recovery is also true if we look at total employment and overall labor force participation.
What’s more, education matters in how likely young people are to work full-time. As shown in the next chart, for those with less than a high school diploma, 14 percent worked full-time, compared to 66 percent with a Bachelor’s degree or higher. This re-emphasizes the importance of higher education in successfully finding full-time work in today’s economy.
Of the 17 million Americans age 16-24 not enrolled in school or working full-time in July 2013, 5.6 million were working part-time, 3.2 million were unemployed – a 17.1 percent unemployment rate – and another 8.4 million were not in the labor force altogether.
Together, these charts suggest the problem facing young Americans is structural. If worsening labor market conditions were a temporary effect of the recession, we would have expected to see improvement with the recovery. Instead, young Americans appear stuck in their post-recessionary state.
What could be behind the stubborn labor market for young Americans? One explanation is the Great Squeeze, which I’ve written about before. The dearth of middle-skill jobs is forcing workers unqualified for today’s high-skill, high-wage jobs to take lower skill jobs for less pay, squeezing those with less education and experience down and out of the workforce.
The struggles facing young Americans should not be ignored. It’s clear the policies in place now to prepare and integrate young Americans into the workforce are not sufficient. If we are serious about moving from a slow-growth economy to a high-growth economy, it’s something policymakers will have to address.
Note: For those interested in the effect of rising college enrollment on overall labor force participation of young people, there are several points to consider. One, in July most college students are not enrolled, and would be counted here. Second, the number of young Americans age 16-24 not enrolled in school and not working continues to rise. In July 2007 labor force participation for this group was 73.3 percent; in July 2013 it was 68.8 percent. Third, college enrollment has actually been falling for the last two years, with the decline actually accelerating. Finally, many college students also work. According to the same BLS data 42 percent of people age 16-24 enrolled in school also were in the labor force in July 2013.
As the housing sector continues its apparent recovery, some U.S. lawmakers are turning their attention to a looming crisis in the commercial real estate market, which is threatened by an avalanche of debt as loans made during the heady days of the early aughts start coming due over the next five years.
Reps. Kevin Brady, R-Texas and Joseph Crowley, D-N.Y., this week introduced a bill that would make it easier to finance this coming wave of debt. Following similar proposals in the Senate and President Obama’s budget, it would stop penalizing foreign investors in U.S. commercial property.
Here’s the problem they’re trying to solve: colossal amounts of real estate loans – totaling more than $1.7 trillion – are due to mature from now to 2018. Commercial mortgages are not like your average home mortgage. They aren’t fixed at a rate for 30 years. The standard commercial loan must be refinanced, paid down or sold after 10 years. What’s coming now is a huge wave of commercial debt that originated in the bubble years between 2003-2008.
Back then, real estate values were inflated and lending standards much looser. That means we can expect significant volumes of maturing mortgages to be in some sort of distressed state. In a 2010 Congressional oversight report, lawmaker’s panel served up this scary scenario:
A significant wave of commercial mortgage defaults would trigger economic damage that could touch the lives of nearly every American. Empty office complexes, hotels, and retail stores could lead directly to lost jobs. Foreclosures on apartment complexes could push families out of their residences, even if they had never missed a rent payment.
This is what progress looks like: Not easy, not pretty, but indispensable.
An article in the Wall Street Journal, Google’s Data-Trove Dance, graphically outlines the internal conflicts within Google about privacy versus more extensive of use of data. The article said.
under increased regulatory scrutiny in the U.S. and Europe, executives are engaged in wide-ranging internal debates and in some cases slowing product launches to address privacy concerns
The debates within Google mirror the debates in the broader society. On the one hand, embracing the data-driven economy will increase quality of life, create jobs, and improve fiscal trade-offs. On the other hand, the data-driven economy raises important privacy concerns that cannot be wished away.
What’s going on here? In the data-driven economy, data is an important new input to economic activity. In fact, just today the BEA released an important new revision to GDP which counts investment in ‘intangibles’.
The benefits of data are profound. Because people are contributing their data about their location, you know which traffic-clogged roads to avoid, and which restaurants to patronize. Because people are contributing their data about jobs and skills, we have much more transparency about career paths and the job market, so potential workers can learn what kind of education and training they need. Because people are contributing their words and pictures, we’ve been able to build communities that go beyond our immediate geographical borders.
Back in 2005, Benjamin Friedman of Harvard released a fascinating book entitled The Moral Consequences of Economic Growth. Friedman argued that “our conventional thinking about economic growth fails to reflect the breadth of what growth, or its absence, means for a society.” Growth encourages social virtues such as fairness, tolerance, and mobility, while the absence of growth undercuts social virtues such as democracy.
So the debate is not simply about privacy vs growth. We care about privacy, but we also care about the social benefits generated by growth. And that’s why I believe we should say ‘yes’ to the data-driven economy.
Today Senators King and Blunt introduced the Regulatory Improvement Act of 2013, which “would create a Regulatory Improvement Commission to review outdated regulations with the goal of modifying, consolidating, or repealing regulations in order to reduce compliance costs, encourage growth and innovation, and improve competitiveness.”
The framework for this new commission is modeled after PPI’s proposal for an independent Regulatory Improvement Commission (RIC). Under this proposal the RIC would review duplicative and outdated federal regulations as submitted by the public with the intention to either remove or improve them. The Commission would be authorized by Congress on an as-needed basis, with bipartisan participation, and would require complete transparency during each stage of the review process. At the end of the review, the RIC would submit a package of regulatory changes to Congress for an up or down vote.
The Regulatory Improvement Act of 2013 is a significant proposal that could have a tremendous economic impact. Regulatory accumulation – the natural accumulation of federal regulations over time – imposes an unintended but significant cost to businesses to businesses and economic growth. No satisfactory process currently exists for retrospectively improving or removing regulations.
PPI congratulates Senators King and Blunt for introducing a bill that could finally address this long-standing issue that affects the ability of America’s businesses to grow, invest, innovate, and succeed.
The GDP revisions which come out on Wednesday are likely to reshape our perception of the Great Recession. The BEA will have new data available, notably on corporate profits. Moreover, the BEA is adding in R&D and other intangible investments into GDP for the first time.
The BEA is a completely professional and nonpolitical organization, doing their best to improve statistics with a limited budget. Nevertheless, my best guess is that these changes will have several politically significant consequences. I could be very wrong, but I expect that: (added)
1. The savings rate will be revised up, something for President Obama to boost about.
2. The fall into recession in 2008 and 2009 will look steeper, as companies cut scientists and engineers. The President and his economists will highlight this drop as a sign that the situation was worse than it seemed when he took office.
3. The recovery will look weaker, as domestic business R&D has apparently languished. Not good news for the President.
4. Productivity gains will be slower.
Added: Let me reiterate: All of the statistical agencies, including the BEA, are devoted to producing the best possible statistics on a limited budget, with no politics involved. Nevertheless, whenever big revisions change our view of the economy, these will have political consequences.
Overhauling the federal tax system is one of the most important steps U.S. political leaders can take to promote economic growth and fairness. It is also that rarest of issues in today’s Washington—one that commands broad support on both sides of the political aisle. For these reasons, the Progressive Policy Institute urges the White House and Congress to give top priority to fixing our broken tax system over the next 12 months.
Everyone knows our tax code is too complicated, too inefficient and too riddled with preferences for special interests. Americans deserve better. PPI believes we need a federal tax system that is simpler and more progressive; that steers investment into productive, job-creating activity; that enables U.S. workers and companies to compete on an even footing in world markets; and, that serves the most basic purpose of any tax system—raising enough revenue to finance the government while ensuring fairness to taxpayers.
Comprehensive tax reform obviously poses daunting political obstacles. Nevertheless, it’s a goal Democrats and Republicans share. The Senate Finance Committee has published 10 papers on various options while the House Ways and Means Committee has organized 11 subgroups to consider different areas of the tax law. Over 1000 comments have been filed. With Sen. Max Baucus retiring this year, and Rep. Dave Camp term-limited as chair of the House Ways and Means Committee, the two most important players on tax policy are strongly motivated to get something done.
This paper will not offer a sweeping blueprint for reform. Instead it focuses on one crucial aspect of reform: Simplification. PPI has long argued that our tax system is too complex and ill-fitted to the needs of middle-class families and small entrepreneurs. They benefit little from the existing array of incentives and loopholes, which are mainly targeted on special interests or people with a level of income and wealth they can only dream about. The code’s byzantine complexity also costs business and individuals hundreds of billions in compliance. In a recently released annual report to Congress, the IRS’s National Taxpayer Advocate, Nina Olson, estimated that individual and business taxpayers spent 6.1 billion hours to complete filings. The bloated federal code contains almost four million words and on average has more than one new provision added to it daily.
The code is so complex that nearly 60 percent of taxpayers hire paid preparers and another 30 percent rely on commercial software to prepare their returns.
In fact, according to PricewaterhouseCoopers, only four nations have more pages of “primary tax legislation” than does the United States. And the World Bank’s www.doingbusiness.org ranks 61 nations as having tax systems friendlier to business than does the United States, while the World Economic Forum puts the U.S. tax system in 107th place in a ranking of the efficiency of 117 national tax regimes.
Congress perennially fiddles with the code, and it takes a full-time army of lobbyists to keep track of all the changes: the Treasury Department reports that there have been more than 14,400 revisions since 1986. It is imperative, then, that any comprehensive overhaul of the federal tax system not make the code even bigger and more complicated. Tax reform without dramatic simplification should not be considered genuine reform.
While I was waiting for my plane at Heathrow on Sunday, I spent a bit of time looking through BEA statistics on investment spending by industry. (That activity may sound remarkably dull and boring, but remember I read stuff like this so you don’t). I put this together this little table showing which industries invested the most in equipment and software in the years 2007-2011
News flash: The top industry for investment in equipment and software from 2007 to 2011 was broadcasting and telecommunications. In many ways, that’s not surprising, given the data-driven economy, but it’s good to see in black and white.
Healthcare would be number one by a small amount if we combined hospitals and ambulatory care services.
Last week the FT did a long article on the broad divergence between U.S. corporate profits and investment. https://www.ft.com/intl/cms/s/0/8177af34-eb21-11e2-bfdb-00144feabdc0.html#axzz2aKVhUHNE The author, expressing surprise at the strength of profits compared to the weakness of corporate investment, ran through a long list of potential reasons, included the financial crisis, the information revolution, short-sighted managers, mismeasurement of intangible investment, and monopoly power.
Notably missing from the article, though, is any mention of globalization. In fact, the author apologizes in the comments, noting that “Globalisation is another possible factor that I couldn’t manage to fit in.”
But globalization gives the simplest explanation of the “mysterious” divergence. Because of the way that the national statistics are constructed, increased investment in China can produce higher domestic profits in the United States.
How does this work? Suppose that a large retailer is sourcing a product from an American supplier. Then a Chinese manufacturer invests $100 million in a Chinese factory to make the same product for half the price(aided by all of the Chinese infrastructure spending ).
When the retailer shifts from the American supplier to the Chinese supplier at the lower price, the retailer makes some gain in profits, and passes some on to the consumer. All of those extra profits are booked by economic statisticians as domestic profits.
Ta da! An increase in investment overseas shows up as domestic profits. Imagine the same story multiplied a hundred fold, and that goes a long way to explaining why the divergence is happening in the US.
The larger story, though, is that we have to start thinking globally rather than domestically. I don’t know whether global profits diverge from global investments, but we have to figure in China and other developing countries as well. Second, if we are talking about a fall in the labor share of income, we have to add in rising wages in China as well.
National income accounting is just that—national. And that may give misleading answers in an era of globalization.
It’s become conventionalwisdomamongpundits that the tech and data boom is generating lots of wealth, but not much in the way of jobs or economic growth. The skeptics point to lack of job gains in the “information” sector, as defined by the Bureau of Labor Statistics, and to the country’s sub-2 percent GDP growth figures.
But as the U.S. shifts to a data-driven economy, the benefits of fixed and mobile broadband are showing up in ways that are not counted by traditional statistics. For just one example, take the number of jobs generated by the development and deployment of mobile apps. According to a new calculation by the Progressive Policy Institute, employment in the App Economy now comes to 752,000 jobs, up roughly 40% over the past year. This is a conservative estimate, based on tracking online help-wanted ads.
Auto companies are hiring software developers and testers to turn their vehicles into highly connected data platforms. Drugstores are going online to let their customers know when prescriptions are ready. Hospitals are ramping up their employment of clinical data managers to help handle the shift to electronic health records. Bed and breakfasts have shifted their entire booking operations online, driven by digital ads.
More broadly, demand for tech workers in the New York City region outstrips every other metro area, including San Francisco and San Jose, according to figures from The Conference Board. That reflects demand in finance, advertising, and media.
In his article for the July/August issue of the Washington Monthly, Barry Lynn correctly notes that the slow pace of technological progress in many fields could help explain many of the ills of today’s economy. That’s an absolutely key point. Faster, broader innovation could help create more jobs at higher pay, and help the United States escape the slow-growth trap.
But having identified the right field of battle, Lynn points his rhetorical guns at the wrong target. What’s worse, they are loaded with the wrong policy ammunition.
Lynn argues that technological stagnation is due to “a concentration of economic control that enables a few corporate bosses to manipulate technological advance entirely outside of any open and competitive marketplace.” Looking back to Franklin Delano Roosevelt and the New Deal, Lynn’s solution seems to be “stepped up antitrust enforcement with the forced licensing of key patents held by monopolistic enterprises.”
In the current day, Lynn’s prime examples of innovation-sapping monopolies are drawn from the tech industry. He spends some time on Monsanto and Pfizer, but he primarily focuses on tech companies such as Microsoft, Intel, Oracle and Google. Drawing the analogy with the 1911 antitrust case against Standard Oil, he notes that “it’s not hard to identify which corporations could be renamed Standard Operating System, Standard Semiconductor, Standard Enterprise Software, Standard Storage, and Standard Search.”
Unfortunately for Lynn’s analysis, the tech sector is the one part of the economy where innovation is proceeding at a breakneck pace. In particular, the introduction of the iPhone by Apple in 2007, followed by the release of the Android mobile operating system by Google, rapidly transformed the way that people in the U.S. and around the world do business and live their lives. Continue reading “Who Says Tech Innovation Moves Too Slowly?”→
Following a half-century of economic decay and depopulation, there was a tragic inevitability to Detroit’s decision last week to declare bankruptcy. Motown must now restructure $18 billion in debt owed to 100,000 creditors and bondholders, deciding who gets paid, how much and when.
That’s the plan to deal with Detroit’s past. But what about a plan for the city’s future?
Like Pittsburgh, Baltimore and other former industrial hubs, Detroit must now reinvent itself. At this stage, no one knows what a New Detroit might look like. So before they start courting businesses and looking for investments that generate new jobs and tax receipts, city leaders should focus on the fundamental preconditions for an economic revival.
That means making Detroit safe and livable for its citizens, and “right-sizing” a city that once was home to 2 million people but now has only 700,000 residents. How do you do that? One answer lies in the 78,000 abandoned homes that litter Detroit proper.
In 2010, Mayor Dave Bing launched a pilot program called “Project 14.” The city took 200 foreclosed homes and offered them to police officers for $1,000. They then used federal stimulus funds to offer up to $150,000 to owners to re-hab the homes into good condition. That’s a start, but with a murder rate at a 40-year high, 5,000 fires a year and an ailing public school system, Detroiters still have plenty of good reasons to flee for the suburbs.
To help staunch the bleeding, the city should engage in wholesale “urban homesteading”: Take those 78,000 abandoned homes and offer them for free – that’s right, for free – to new police officers, firefighters, EMS and public school teachers. This would create a new infusion of human capital into Detroit, and help it emulate the success of other big cities in bringing down crime rates and replacing “dropout factories” with new and better schools. It would implant the backbone of a new middle class.
Recently I wrote about how the job gains from Internet/tech growth were spreading from San Francisco and Silicon Valley to other parts of California (The Rebalancing of the California Economy, May 2013).
Now let’s look at another striking phenomenon: The strength of the New York metro area as a tech hub. I looked at employer demand for computer and mathematical occupations, as reflected in the number of want ads for software developers, web developers, data analysts and the like. What I found was quite surprising.
1. The New York metro region is #1 in the country in demand for computer and mathematical occupations.* The Washington DC metro area is second, though demand has sharply fallen since a year ago.
2. The New York metro region is #1 in the country in demand for web developers, by a wide margin. Washington is second, and the Los Angeles metro area is third.
3. The New York metro region is #1 in the country in demand for app economy workers, slightly ahead of San Francisco, San Jose, and Seattle.
4. The. New York metro region is #2 in the country in demand for information security analysts, behind Washington DC.
5. The New York metro region is #4 in the country in demand for software developers, behind Seattle, San Francisco, and San Jose.
In some ways, New York’s strength reflects the sheer size of the region. Still, it’s remarkable that New York competes so well agains the tech powerhouses on the West Coast.
*Demand reflect the number of help-wanted ads in a metro region. These results are preliminary, pending additional validation. Computer and mathematical occupations, as defined by the Bureau of Labor Statistics, include occupations such as software developers, web developers, and statisticians, but not electronics engineers. All results based on number of help-wanted ads in June 2013, as reported by The Conference Board HWOL database. App economy jobs were defined in The Geography of the App Economy from South Mountain Economics LLC.
(Computer and mathemeatical occupations include software developers and web developers, but not electrical engineers. )
(based on June 2013 data from The Conference Board HWOL database).