A healthy U.S. economy is finally emerging from inflation’s shadow, enabling Americans to see and feel its underlying strengths. Is the good news coming in time to give Vice President Kamala Harris a boost in the November election?
Normally, a vibrant economy lifts political incumbents, but polls show U.S. voters are still preoccupied with high living costs. Harris offers a slew of proposals for driving down the cost of housing, food, health care and other necessities.
That’s essential, but with inflation and interest rates falling, Democrats have a stronger economic hand to play. They can point at growing evidence that working families are benefiting from the U.S. economic boom, and point out that Donald Trump’s slapdash economic ideas and frantic pandering threaten to derail it.
Research by my colleague Michael Mandel shows that with inflation easing, wages for working-class Americans have risen higher than they were on Election Day 2020. In other words, U.S. workers are better off today than they were under Trump.
In addition to milder headwinds from inflation, Mandel attributes the rise in real wages to a revival of U.S. productivity growth, driven by a combination of strong government and corporate investment since 2020.
New analysis sheds light on how charter schools are making strides in leveling the academic playing field for students in low-income areas, suggesting a brighter future for these children in areas that don’t shy away from school choice.
The Progressive Policy Institute’s (PPI’s) report titled “Searching for the Tipping Point: Scaling Up Public School Choice Spurs Citywide Gains,” authored by educational equity advocate Tressa Pankovits, suggested cities with robust public charter school options for low-income families are seeing beneficial outcomes for all students.
Charter schools, according to the Georgia Department of Education, are publicly funded schools that operate “under the terms of a charter, or contract, with an authorizer, such as the state and local boards of education,” but receive flexibility in certain areas “in exchange for a higher degree of accountability for raising student achievement.”
“Our report belies the oft-heard but unfounded criticism that charters somehow drain legacy schools of the ‘best’ students and resources, to the detriment of those left behind,” Pankovits’ analysis states. “Evidently, the growth of enrollment in charter schools creates a positive competitive dynamic with the traditional district schools, which have to up their game to attract parents and students.”
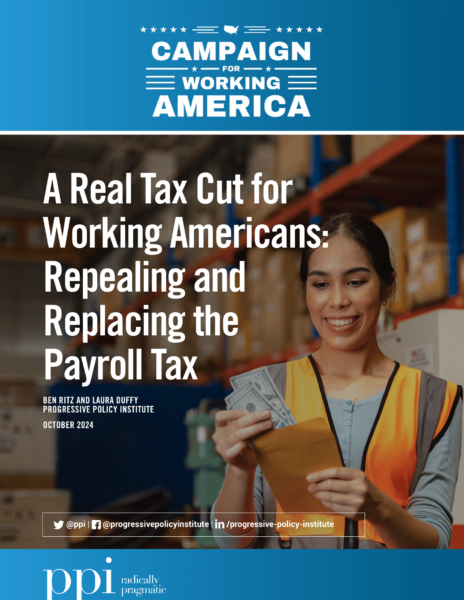
WASHINGTON — With major provisions of the Tax Cuts and Jobs Act set to expire at the end of next year, the president and Congress elected less than two weeks from today will have a historic opportunity to craft a new tax code that is fairer, more pro-growth, and more fiscally responsible. The Progressive Policy Institute (PPI) today released a new report, “A Real Tax Cut for Working Americans: Repealing and Replacing the Payroll Tax,” that offers a bold proposal to do just that by repealing the regressive and anti-work payroll tax, which is the biggest tax 123 million American households pay on their hard-earned wages.
This new publication, which is authored by Ben Ritz, Vice President of Policy Development for PPI, and Laura Duffy, a Policy Analyst at PPI’s Center for Funding America’s Future, is a key output of PPI’s Campaign for Working America, launched earlier this year in partnership with former U.S. Representative Tim Ryan of Ohio. The Campaign aims to develop and test new themes, ideas, and policy proposals that help Democrats and other center-left leaders make a compelling economic offer to working Americans, bridge divides on cultural issues like immigration and education, and rally public support for the defense of democracy and freedom globally.
“Donald Trump has spent months pandering to workers by offering to exempt everything from tips to overtime pay from taxation. But these proposals would collectively add trillions of dollars to inflationary budget deficits while providing little benefit to the overwhelming majority of working Americans who earn most of their income through ordinary wages,” said Ritz. “PPI’s proposal, on the other hand, would increase most workers’ take-home pay while reducing our nation’s unsustainable deficits.”
The report proposes adopting a value-added tax to replace the revenue lost by repealing the payroll tax, which would spread the burden of taxation from workers’ wages to other forms of business income and previously accumulated wealth. PPI estimates that the swap could increase after-tax income for up to 90% of working families while also reducing annual budget deficits by up to $300 billion. It would also lower marginal tax rates on most workers’ wages, boosting individuals’ incentives to work and driving the innovations that grow our economy.
“Virtually all of the United States’ peer countries rely on value-added taxes to finance their social programs because they’re good at raising revenue in a relatively pro-work and pro-growth way,” Duffy added. “Transforming the U.S. tax code to tax consumption instead of payrolls would therefore be a progressive and fiscally responsible way to reward work and improve the lives of working families.”
The Progressive Policy Institute (PPI) is a catalyst for policy innovation and political reform based in Washington, D.C. Its mission is to create radically pragmatic ideas for moving America beyond ideological and partisan deadlock. Learn more about PPI by visitingprogressivepolicy.org.Find an expertat PPI andfollow uson Twitter.
###
Media Contact: Ian O’Keefe – iokeefe@ppionline.org
Regardless of who wins in November, the next president and Congress will have to rewrite our nation’s tax code. At the end of 2025, the individual tax provisions in the Tax Cuts and Jobs Act (TCJA) enacted by Republicans in the first year of Donald Trump’s first term will expire. Simply extending all the expiring provisions would saddle future generations with at least $4.6 trillion in debt over the next ten years, with nearly half of the benefit going to the top 5% of households. Working Americans will pay the price for any unfunded extension of these tax cuts, whether it is through higher inflation today or higher taxes needed to fund larger interest payments on the ballooning national debt down the road.
Donald Trump seems to be hoping that working Americans will give him a second term and overlook the costs of extending his 2017 tax cuts by sweetening the pot with additional tax cuts that sound better targeted toward their interests, such as by exempting tips and overtime pay from taxation. But while working-class Americans disproportionately work jobs with hourly wages that are supplemented by tips and overtime pay, many have income tax liabilities that are too low to significantly benefit from such a tax cut. Meanwhile, many working Americans who don’t earn tip income or overtime pay would end up facing higher tax burdens than higher-earning workers who do, such as service workers at high-end establishments.
Trump has also proposed income tax cuts for high-income Social Security beneficiaries that would do nothing for working families other than hasten the insolvency of the program and put their benefits in greater jeopardy. The hole will be even deeper because Trump has also called for repealing one of the few TCJA provisions that actually raised revenue — a $10,000 limit on the amount of state and local taxes that itemizers can deduct from their federal taxes, which would effectively result in a $2 trillion transfer from working families and future generations to the highest-income households. Altogether, the pandering grab bag of Trump Tax Cuts 2.0 would more than double the cost of extending the original.
But Trump’s “plan” to pay for all this by imposing staggeringly high tariffs of 10% to 20% on all imports and up to 60% on goods from China is potentially his worst idea so far. Tariffs are largely passed through to consumers, so Trump’s tariff plan would raise the prices of everyday goods bought disproportionately by working families. It would also cause far greater economic harm by raising input prices for domestic industries, weakening the market for American exports, inviting retaliatory tariffs from other countries, and redirecting investment away from heavily impacted industries such that it would destroy far more jobs than it creates. Plus, the declines in both trade and household incomes that Trump’s tariff would cause mean that his idea would come nowhere close to paying for all of his other tax cuts, leaving current and future generations of working families to foot the bill.
Instead of expanding TCJA’s regressive and costly tax provisions, PPI proposes what would actually be the biggest tax cut on working Americans’ wages in history: repealing the regressive payroll tax. Unlike Donald Trump, who would add the cost of his unaffordable and inflationary tax cuts to the national debt, PPI proposes to more than make up for the lost revenue by adopting a progressive consumption tax. This transformational shift in the tax code would slash taxes for the vast majority of American workers, particularly the 123 million lower- and middle-income households who pay more in payroll taxes than in income taxes, while also reducing the deficit. Our approach would put working families first with a tax code that is both more progressive and more pro-growth.
TRADE FACT OF THE WEEK: The U.S. economy has grown by 13.5% since 2020 and employs 17 million more workers.
THE NUMBERS: 2024 vs. 2020 & 2019 –
2024
GDP (real 2023 dollars)
$28.2 trillion?*
Employment
159 million jobs
2020
GDP (real 2023 dollars)
$24.8 trillion
Employment
142 million jobs
2019
GDP (real 2023 dollars)
$25.3 trillion
Employment
149 million jobs
* International Monetary Fund, using their April 2024 World Economic Outlook database’s estimates of a $27.36 trillion GDP for the U.S. in 2023, and 2.7% real growth in 2024. Data for 2020 and 2019 from the Bureau of Economic Analysis database, with GDP converted from BEA’s “constant 2017 dollars” to “constant 2023 dollars.”
WHAT THEY MEAN:
Are we better off? In some ways, the question is harder to answer than usual, since the COVID pandemic can make comparisons of output, employment, and associated data for 2020 misleading. So accepting this and trying to provide the appropriate context when necessary, here are four then-to-now comparisons plus one optimistic bit of future-oriented data:
Size: The economy is noticeably larger. Measured by “GDP,” the U.S. economy of 2024 is likely to come in at about $28.1 trillion in “real,” inflation-adjusted, 2023 dollars or perhaps a little more depending on the last two quarters’ growth rates. In these “real dollars,” this is about 13.5% larger than the $24.8 trillion of 2020, and 11% larger than the $25.3 trillion of 2019. Put another way, the $3.4 trillion or so added since 2020 is slightly below the IMF’s forecast for India’s $3.9 trillion total GDP and the UK’s $3.5 trillion, and nearly double Russia’s $2.05 trillion.
Employment: More Americans are working. This autumn, 159 million workers, execs, and interns go to offices, labs, factories, construction sites, and so forth each morning. (Or to the restaurant kitchen in the evening, the farm or home office any time of day, the hospital ward or security office for a night shift.) That’s 17 million jobs, more than the 142 million of January 2021, and 10 million more than the pre-COVID 149 million of January 2020. An additional 10 million workers, as a point of comparison, is the same as the total labor force of the Netherlands; 17 million would fall between Australia’s 14 million workers and Canada’s 22 million.
Income: The “distribution” of money to all these people has become a bit less skewed, as we noted earlier this month, and a bit better for hourly-wage workers. The Census Bureau’s data for “median family income” — that is, income for the family in the exact middle of America’s 131 million households — provides one angle: median income (again in “real” inflation-adjusted dollars) at $80,610 as of 2023, up $1,050 from the $79,560 of 2020, with African American family median income growing fastest at $2,650. Or, taking the “worker” rather than the “household” perspective, the Bureau of Labor Statistics’ “real wage” reports show something similar: wages are up about 2% on average from the levels of early 2020 just before the pandemic, with especially fast growth in some blue-collar fields: 9% real wage growth for gas station attendants, 5% for clothing retail staff, 7% for hotel workers, 8.7% in auto repair shops, and 8.0% for beauty shop and hair salon specialist.
Composition: The economy has shifted a bit. The Commerce Department’s Bureau of Economic Analysis (the official GDP tracker) reports that growth has been fastest in information and services industries, making them now somewhat larger relative to the other parts of the economy than they were four or five years ago. Using 2019 as a base, BEA’s “GDP by Industry” reports show “information industries” — internet, computer networks, media – up by 36% or by $380 billion in real, inflation-adjusted terms, as the digital economy has grown about four times as fast as the rest of the economy. A related BEA category, with the vague and expansive title of “miscellaneous professional, scientific, and technical services,” is up 32% or by $300 billion. Elsewhere, real estate is up by 17% or (given its large original base) $410 billion), manufacturing by 12% or $200 billion, retail likewise by 12% and $150 billion; restaurants and food service, are still not fully recovered from their especially severe pandemic shock, are down by -1% or by $6 billion.
Science: Finally, looking ahead, the research-and-development workforce has boomed. Since January 2021, 150,000 new R&D scientists have joined the sci/tech workforce — 885,000 now, 735,000 then. If you start at pre-COVID January 2020, the jump is even higher: 190,000 net new lab rats. Figures for R&D spending take a few years to tabulate, but the National Science Foundation’s reports show U.S. R&D spending up from 3.0% of GDP in 2019 to 3.4% in 2022 — about 30% of all world research, and relative to the economy the U.S. ranks fourth in the world, behind only South Korea, Taiwan, and Sweden. All this hints at new inventions and rising productivity in the late 2020s and early 2030s.
So: To answer the basic question, yes, we do seem better off: a larger economy, with inflation down after the Treasury and Federal Reserve’s successful pandemic-aftermath macro management; more and better-paid workers and unemployment rates low; faster income growth in the lower tiers of the income tables; and reason for optimism about what’s coming next. The country is by no means short of problems to fix and policies that could be improved or replaced. But as the campaign season nears its end, some of the country’s largest risks come from bad ideas — trade and security isolationism, for example — or problems left untended such as long-term debt buildup. Or, put another way, from costly mistakes that voters can prevent, and from long-term challenges governments can address if they choose. In general, a pretty good record, and lots of reasons for optimism.
Ed Gresser on the risk of the Trump campaign’s economic and political isolationism, trade and hourly-wage America, and Vice President Harris’ opportunity.
Using currency-basis comparisons (current 2024 dollars, so the U.S.’ figure is slightly larger than the 2023-dollar estimate above), here’s their data on the U.S. in the larger world economy of 2024:
World
$110.4 trillion
United States
$28.8 trillion
European Union
$19.0 trillion
China
$18.5 trillion
Latin America & Caribbean
$7.0 trillion
Middle East & Central Asia
$5.0 trillion
Japan
$4.2 trillion
ASEAN-10
$4.1 trillion
United Kingdom
$3.5 trillion
India
$3.9 trillion
Canada
$2.2 trillion
Russia
$2.1 trillion
Korea
$1.8 trillion
Australia
$1.8 trillion
Sub-Saharan Africa
$1.5 trillion
All Other
$3.7 trillion
This year’s 26.2% U.S. share of world output is up from the 25.5% share of 2020, and the 24.6% share of 2019, reflecting the relatively stronger U.S. recovery after the COVID pandemic and also relatively high dollar values vis-à-vis other currencies. Note that this currency-basis approach, affected by foreign exchange rates, gives the U.S. an especially large GDP share, though. The alternative “purchasing-power parities” (avoiding currency-value distortions, and trying to calculate a world in which basic services cost as much in lower- and middle-income countries as in wealthier countries) makes the world economy much bigger — $187 trillion, with China, India, Latin America, ASEAN, Africa, and the Middle East all larger — while the U.S. count is identical and the EU, UK, Canada, Japan, Australia, and Korea pretty much the same.
The global App Economy was born 16 years ago, in July 2008, when Apple unveiled the first App Store. Soon after, Google opened the Android Market, which later became Google Play. In this way, Apple and Google created a whole new global market for mobile applications, leading to an unprecedented wave of mobile apps in gaming, entertainment, social media, finance, e-commerce, productivity, health, and other areas.
In addition to benefiting smartphone users, the App Economy has become a potent source of job growth worldwide and in Argentina. Starting from zero 16 years ago, the Progressive Policy Institute (PPI) estimates that Argentina’s App Economy includes 28,000 workers as of September 2024. These include workers who help develop, maintain, and support mobile applications and keep them safe and secure.
One of the hottest new areas of the App Economy has been the application of artificial intelligence (AI) to mobile apps. We will see a wide variety of AI-enabled mobile applications developed to improve efficiency and userfriendliness in areas such as health care, manufacturing, agriculture, mining, and government. Such applications of AI to mobile apps may be easier and quicker to develop than more massive “foundational” systems, such as ChatGPT and its competitors.
From the perspective of Argentina — which is fighting a serious economic downturn as of the date of this paper — this trend offers new opportunities for the country to participate in the global tech boom. President Javier Milei, who took office in December 2023, has been encouraging investment and hiring by global tech firms and positioning Argentina as a potential global AI hub. One way Milei’s effort could succeed is by using the combination of AI and the App Economy to help boost the IT sector
This paper takes an initial look at the potential convergence of AI and the App Economy in Argentina. First, the paper estimates the number of workers employed in Argentina’s App Economy, using a methodology we have applied globally. We estimate the size of the iOS and Android ecosystems and give examples of App Economy jobs in Argentina. Second, the paper estimates the number of workers employed in AI-related jobs in Argentina using the same methodology and gives examples of AI-related jobs. Third, the paper discusses how AI can help grow Argentina’s App Economy.
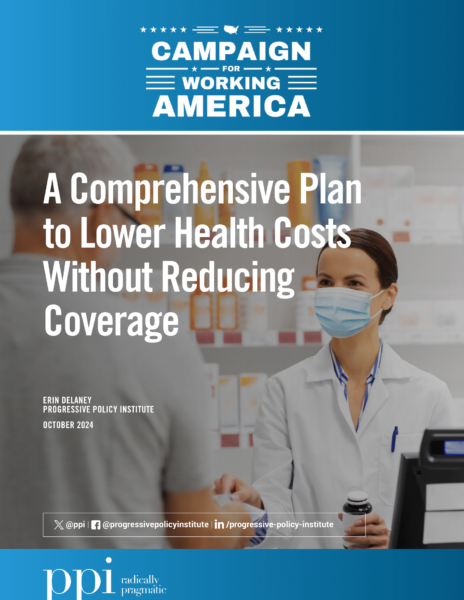
WASHINGTON — As the 2024 U.S. presidential election draws near, high health care costs remain a top concern for voters without a four-year degree. A new report from the Progressive Policy Institute (PPI), “A Comprehensive Plan to Lower Health Costs Without Reducing Coverage,” outlines a set of innovative reforms to reduce health care costs for working Americans.
This new publication is a key output of PPI’s Campaign for Working America, launched earlier this year in partnership with former U.S. Representative Tim Ryan of Ohio. The Campaign aims to develop and test new themes, ideas, and policy proposals that help Democrats and other center-left leaders make a compelling economic offer to working Americans, bridge divides on cultural issues like health care, immigration, and education, and rally public support for the defense of democracy and freedom globally.
As part of PPI’s Campaign for Working America, this report, authored by Erin Delaney, PPI’s Director of Health Care Policy, addresses the growing affordability crisis in health care and offers a range of policy solutions to lower costs for working families. According to a recent YouGov poll commissioned by PPI, rising medical bills are a critical financial worry for voters without college degrees, with health insurance, hospital costs, and prescription drugs cited as the most significant burdens. Delaney highlights that high prices, exacerbated by an inefficient fee-for-service model, have made health care inaccessible for many working-class Americans.
“Health care costs are outpacing inflation, putting significant strain on household budgets,” said Delaney. “Our recommendations focus on targeted reforms that will make health care more affordable while ensuring families have access to the care they need.”
Capping prices for out-of-network care based on Medicare rates to curb excessive charges and lower premiums, ensuring site-neutral payments to eliminate discrepancies in costs between different care settings, banning anti-competitive practices like “pay-for-delay” and “evergreen patents” to improve access to affordable generic drugs, and expanding telehealth services under Medicare to provide more convenient, cost-effective care for working families.
Delaney emphasized that addressing the structural drivers of medical inflation is essential to keeping health care costs in check: “Without bold reforms, health care costs will continue to rise, further squeezing working families.”
The report also explores solutions to improve maternal health, expand the nursing workforce, and support reproductive health services, ensuring comprehensive care for all Americans.
The Progressive Policy Institute (PPI) is a catalyst for policy innovation and political reform based in Washington, D.C. Its mission is to create radically pragmatic ideas for moving America beyond ideological and partisan deadlock. Learn more about PPI by visiting progressivepolicy.org. Find an expert at PPI and follow us on Twitter.
###
Media Contact: Ian O’Keefe – iokeefe@ppionline.org
The U.S. economy is growing at a healthy clip, but working Americans continue to identify high prices and living costs as their chief economic worry in this crucial election year. According to a recent YouGov poll commissioned by PPI, soaring medical bills are a top financial concern for voters without college degrees. Asked specifically which health care costs hit them hardest, they say health insurance, hospitals and drugs.
According to a 2023 report from the Centers for Medicare & Medicaid Services (CMS), health care spending increased by 4.8% in 2022, outpacing the 3.2% rise in the Consumer Price Index (CPI), which measures inflation. This disparity underscores the worsening affordability crisis in health care, where the cost of medical services, including hospital visits, prescription drugs, and insurance premiums, is escalating more rapidly than general living costs. Consequently, households are feeling the pinch as a larger portion of their budgets is consumed by health care expenses, leaving less room for other essential needs.
Every dollar that is spent on out-of-pocket medical costs is a dollar less to pay for food, gas, and other household necessities. Three out of every four families report they are worried about being able to afford unexpected medical bills, which have left millions of households collectively shouldering more than $200 billion in medical debt. Anxiety about household expenses is especially acute in households making less than $40,000 annually, leading families to prioritize pressing financial needs over preventive or routine medical care.
Voters generally have greater trust in the Democratic Party than the Republican Party when it comes to managing high health care costs and ensuring access to abortion services. Surveys consistently indicate that a majority of voters trust Democrats more when it comes to reproductive health and reducing health care expenses.
During her debate with former President Donald Trump, Vice President Kamala Harris committed to capping insulin prices, limiting patient cost-sharing for generic drugs, and expanding Medicare’s authority to negotiate drug prices. She also vowed to protect and enhance the Affordable Care Act (ACA), promising to make permanent the Biden-Harris administration’s enhanced tax credits, which have lowered premiums by an average of $800 annually for millions of Americans.
Despite his repeated failures to convince Congress to repeal the ACA during his presidency, Trump in the debate vowed again to replace it with “something better.” When pressed for specifics, however, he could only reference a vague “concept of a plan,” nearly a decade after his initial promise to provide a viable alternative. Over that period, public support for the ACA has risen dramatically, from 38% to 62%, according to polling by KFF.6 Nonetheless, Congressional Republicans are still trying to weaken the law by pushing for the elimination of enhanced tax credits passed during the COVID-19 pandemic. This would mean higher premiums for working Americans with modest incomes.
Trump also is trying to distance himself from the public backlash against the Supreme Court’s decision striking down abortion rights. Since the Court overturned Roe v. Wade in June 2022, Republican-controlled states enacted laws that either ban abortion outright or impose strict restrictions on access to reproductive health care, affecting 25 million women. This shift has resulted in a patchwork of laws, with many states erecting significant barriers to abortion access. Consequently, millions of American women are at risk of not receiving timely reproductive health care.
Beyond restricting abortion access, the impact of the Roe decision has complicated life for women seeking maternal care services. Many hospitals in states with stringent abortion laws have closed their maternity wards or significantly reduced maternal health services in response to legal challenges from right-wing politicians and pressure groups. Tragically, this led to the death of Amber Thurman, a 28-year-old nursing assistant and mother of a six-year-old son who succumbed to an infection after medical providers delayed care for the effects of a medication abortion in a state with such a ban, according to an investigation by ProPublica.
Maternal mortality review committees, like the one in Georgia that examined this case, typically operate with a two-year delay in reviewing the cases they investigate. As a result, experts are only now beginning to assess deaths that occurred after the Supreme Court’s ruling. As this data is reviewed and released, more such stories are likely to emerge.
Having stacked the Supreme Court with antiabortion ideologues, Trump now offers the ludicrous defense that Americans — who strongly supported the national right to abortion established by Roe — were clamoring for states to decide whether abortion should be legal. He now claims to support exceptions to abortion bans for rape and incest, drawing fire from outraged Christian conservatives who’ve accused him of political opportunism. Trying to avoid another minefield, the former president has also declared himself a “leader in fertilization” and proposed mandating free access to in vitro fertilization (IVF). Congressional Republicans, however, have blocked the Right to IVF Act.
Harris has vowed to push for national legislation restoring Americans’ reproductive rights; assuring access to contraception; and safeguarding families’ rights to access IVF if they can’t have children on their own. She also promised to continue to advocate for access to FDA-approved abortion drugs and select judges who uphold reproductive freedom.
In addition, Harris’ proposals provide a promising foundation for lowering medical bills for working families. But Democrats should be thinking about a bolder, more comprehensive attack on the structural drivers of medical inflation, which makes the U.S. health care system by far the most expensive in the world. In this report, PPI offers a radically pragmatic slate of new ideas for assuring access to providers, driving down medical prices, and improving health care outcomes for working Americans.
In this episode of the Talk Eastern Europe Podcast, Adam sits down with Tamar Jacoby, an American reporter and the Kyiv-based director of the Progressive Policy Institute’s New Ukraine Project. They discuss the current moods in Ukraine, the upcoming US election and its impact on Ukraine and how the West can help right now.
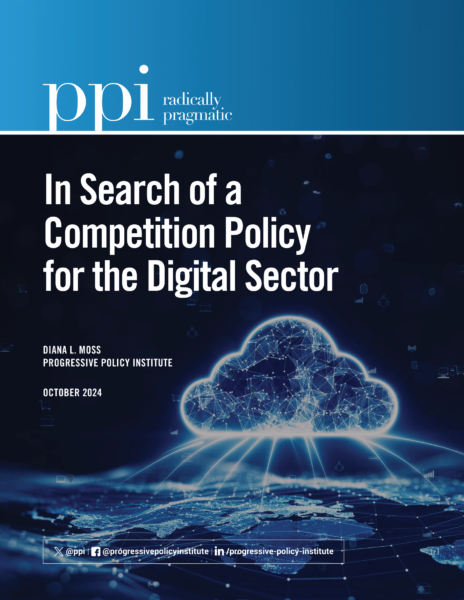
WASHINGTON — The digital economy continues to expand at a rapid pace. The emergence of the second- and third-generation digital ecosystems and advances in cloud computing and artificial intelligence continue to transform how businesses operate and how consumers engage with technology. As this transformation accelerates, the need for a coherent competition policy becomes ever more critical. U.S. antitrust enforcement has struggled to keep up with the digital transformation, testing the limits of merger and monopolization enforcement and emerging concerns over algorithmic collusion.
Today, the Progressive Policy Institute (PPI) released a groundbreaking new report, “In Search of a Competition Policy for the Digital Sector,” authored by Diana L. Moss, Vice President and Director of Competition Policy at PPI, calls for a more clearly defined, coherent U.S. competition policy in the face of the ongoing expansion of the digital economy. Moss highlights how the digital sector’s unique economic business models and growth through acquisition pose challenges for competition enforcement.
“U.S. merger enforcement was largely dormant during the growth of the first-generation digital ecosystems.” said Moss. “Only recently have antitrust enforcers brought several digital merger cases while pursuing a number of monopolization actions against the oldest, large digital ecosystems. This “catch up” approach raises questions about the ability of antitrust to control the concentration of economic power in the digital sector, against the backdrop of rapid growth and innovation.”
PPI’s analysis puts out the call to revisit digital competition policy. The report describes the unique business models, economic features, and model of growth through acquisition that bear on market power in the digital sector. It then turns to unpacking antitrust’s difficult legacy, leading to three major recommended initiatives to help shape a more coherent future digital competition policy:
A blue ribbon commission: Convene a group of experts to identify digital competition policy approaches that address both market power and innovation.
Retrospectives on past mergers: Commission a detailed review of past digital merger investigations and cases to assess the role of merger control in promoting competition and innovation.
Updated antitrust guidance: Issue comprehensive new guidelines on antitrust remedies, particularly for mergers and monopolization cases in the digital sector.
Moss emphasized the urgency of the issue, noting that rapid innovation continues to outpace antitrust enforcement efforts. “As digital firms expand in cloud and AI, antitrust agencies need to reassess policy approaches and directions for promoting competition.” she added.
The report serves as a call to action for the next U.S. administration and antitrust enforcers to modernize their approach to digital competition, ensuring that the digital sector remains a driver of innovation without concentrating power in the hands of a few major players.
The Progressive Policy Institute (PPI) is a catalyst for policy innovation and political reform based in Washington, D.C. Its mission is to create radically pragmatic ideas for moving America beyond ideological and partisan deadlock. Learn more about PPI by visiting progressivepolicy.org. Find an expert at PPI and follow us on Twitter.
###
Media Contact: Ian O’Keefe – iokeefe@ppionline.org
Competition policymakers have a difficult relationship with the digital sector. The large digital ecosystems, in particular, pose a unique challenge. The combination of economic features that foster high concentration and market power, rapid growth via M&A, and high levels of innovation go a long way toward explaining competition policy’s legacy in the digital sector.
This legacy features virtually no challenges to digital mergers across two massive cycles of mergers and acquisitions (M&A) beginning in the mid-1990s. These cycles include the expansion of the now mature, first-generation digital ecosystems and the most recent build-out of cloud and artificial intelligence that continues to drive the digital transformation and its impact on innovation and economic growth.
Antitrust enforcement, which works to spur innovation by promoting competition, must find a way to address market power in the digital sector against a backdrop of rapid growth and innovation. It has been reticent to do so. Only recently have enforcers more vigorously engaged with the digital ecosystems. But a recent series of merger challenges in the U.S. have proved unsuccessful. Moreover, the recent surge of monopolization cases against large players will take years to resolve and the remedies that will ultimately emerge in successful cases remain uncertain.
This approach to U.S. antitrust enforcement is not likely to be effective in a rapidly transforming digital sector that is charging ahead at warp speed. By the same token, the compliance-based ex ante regulation of digital platforms in Europe is no panacea. Few competition policy experts, however, have asked whether a more coherent policy approach to promoting competition in the digital sector is desirable, or needed. This PPI report, “In Search of a Competition Policy for the Digital Sector,” concludes that it is.
PPI’s analysis unpacks the major factors that collectively bear on the need for a more clearly articulated digital competition policy. These include the unique economics and business models in the digital sector, rapid growth through acquisition, and high levels of innovation and dynamism. The analysis evaluates the policy implications, against this unique backdrop, of antitrust’s late arrival on the digital scene. It proposes three initiatives that lay the groundwork for framing a coherent digital competition policy:
• The next political administration should convene an expert “blue ribbon” commission to identify digital competition policy approaches that address both market power and innovation in the digital sector.
• The U.S. antitrust agencies should commission a comprehensive set of retrospectives on past digital merger cases, including cases that were challenged, and those that were investigated but did not lead to an enforcement action.
• The U.S. antitrust agencies should issue guidance on antitrust remedies, including updated guidance on merger remedies but also anticipated approaches to restoring competition in successful digital monopolization cases.
TRADE FACT OF THE WEEK: U.S. Constitution: “Congress shall have Power to lay and collect Taxes, Duties, Imposts, and Excises.”
THE NUMBERS: Tariff collection 2018-2024 –
Congressionally authorized “MFN” tariff system: $216 billion
Administratively created “301” and “232” tariffs: $249 billion
WHAT THEY MEAN:
The 2024 election’s core questions are more basic than policy choices. Such as: Can a person who has attempted to overthrow a settled election, and called for “termination” of unspecified parts of the Constitution, take and keep an oath to ‘faithfully execute the office of President of the United States’ and ‘preserve, protect, and defend the Constitution’? With this in the background, here’s the person in question talking about Congress and his tariff plan (10%, or 20% tariff on all products, and a 60% tariff on Chinese-produced goods):
“I don’t need them. I don’t need Congress, but they’ll approve it. I’ll have the right to impose them myself if they don’t.”
Such ideas would have big daily-life impacts. (How would a 20% tax on the $300 billion in U.S. energy imports affect heating and gas bills? on the $139 billion worth of auto parts bought by factories and repair shops? on family budgets for over-the-counter medicines, clothes, and groceries?) The insistence on going without Congress, though, raises a more basic and abstract question of governance: who should be able to impose a tax?
The Constitution gives a pretty clear answer. Its four sentences on trade policy all come from “Article I” (on Congress), with two from Section 8’s “enumerated powers” list, and two from Section 9’ “denied powers” list. The first (see below for the others) says flatly that “The Congress shall have Power to lay and collect Taxes, Duties, Imposts, and Excises.”
Giving Congress this power wasn’t a big Constitutional-drafting controversy. The “taxes, duties, imposts, and excises” clause, in fact, appears to have survived untouched from the first draft presented to the Constitutional Convention on August 6, 1787, to its publication on September 19th. James Madison’s notes of the August 16 session (the day the Convention debated import and export taxes) report none of that day’s 15 speakers arguing that a president should be able to set tariff (or other tax) rates. Why not? A single individual given power to set tax rates could use them to reward self and friends, punish critics, impoverish political or business rivals, etc.. A big Congress with lots of mutually suspicious factions might not find this impossible, but would have much more trouble agreeing to do it.
This pristine separation-of-powers approach thinned over time for practical reasons, as 19th-century case law (Brig Aurora in 1813, Field v. Clark in 1892) and 20th-century trade bills alloyed it with several forms of “delegation.” “Trade remedy laws,” for example, authorize tariffs in cases of ‘dumping’ and subsidies; “trade promotion authority” bills set out content and implementation rules for free trade agreements and similar ‘liberalizing’ policies, after giving detailed descriptions of when Congress would like Presidents to do these things. Whatever one’s opinion of the merits of trade remedy laws and trade agreements, “delegation” in these cases seems clearly a convenience in which Congress defines policy and asks presidents to execute it without the need for a new law, and courts have decided this is reasonable.
Three or four other laws, though, may have inadvertently provided presidents with something closer to genuinely arbitrary power. “Section 232” and “Section 301” of the U.S. trade law code give presidents rights to impose tariffs by themselves, respectively, as a negotiating tactic to eliminate “policies and practices” burdening U.S. commerce, and as a way to defend expansively described national security interests. The first Trump administration used “232” to raise tariffs on steel and aluminum, and “301” to do this for most Chinese-made goods. As a practical matter, this roughly doubled the size of the tariff system, with the new administratively created tariffs yielding slightly more than twice as much tax revenue as the Congressionally legislated “MFN” tariff system. Two other laws, “Section 338” and the International Emergency Economic Powers Act, have comparable “president says there is an emergency” approaches.
None of these laws, of course, envisions a president deliberately bypassing Congress to create a new tax system “by myself.” So there’s room to wonder about whether courts would strike down an attempt to try. If they didn’t — see below for two speculative, but legally-well-informed, short essays on different sides of this question) — the talk of “terminating” at least one important part of the Constitution wouldn’t seem idle.
FURTHER READING
From the National Archives, the Constitution transcript.
For the record, here are the Constitution’s four trade policy sentences. All are “Article I”, on Congressional organization and powers, with two in Section 8’s “enumerated powers” list, and two in Section 9’s “denied powers”:
Section 8: “The Congress shall have Power to lay and collect Taxes, Duties, Imposts, and Excises” and [power] “to regulate Commerce with foreign Nations, and among the several States, and with the Indian Tribes.”
Section 9: “No Tax or Duty shall be laid on Articles exported from any State” and “No Preference shall be given by any Regulation of Commerce or Revenue to the Ports of one State over those of another; nor shall Vessels bound to, or from, one State be obliged to enter, clear, or pay Duties in another.”
What if somebody tried?
Do current trade laws abandon or override the “Taxes, Duties, Imposts, and Excises” clause? Two informed views –
Warren Maruyama, former U.S. Trade Representative Office General Counsel and likewise long-time trade law practitioner, joins CSIS’ Bill Reinsch and Lyric Galvin in the other view – courts typically ‘defer’ to Congressional laws delegating powers, and would likely do so again.
Some past Supreme Court practice –
Brig Aurora (1813, involving the seizure of cargo carried on a British merchant ship during the War of 1812).
Field v. Clark (Chicago retail pioneer Marshall Field complaint against Clark, a Harrison administration official in charge of collecting tariffs at the Chicago port, for imposing retaliatory tariffs under an 1890 law).
Ed Gresser is Vice President and Director for Trade and Global Markets at PPI.
Ed returns to PPI after working for the think tank from 2001-2011. He most recently served as the Assistant U.S. Trade Representative for Trade Policy and Economics at the Office of the United States Trade Representative (USTR). In this position, he led USTR’s economic research unit from 2015-2021, and chaired the 21-agency Trade Policy Staff Committee.
Ed began his career on Capitol Hill before serving USTR as Policy Advisor to USTR Charlene Barshefsky from 1998 to 2001. He then led PPI’s Trade and Global Markets Project from 2001 to 2011. After PPI, he co-founded and directed the independent think tank ProgressiveEconomy until rejoining USTR in 2015. In 2013, the Washington International Trade Association presented him with its Lighthouse Award, awarded annually to an individual or group for significant contributions to trade policy.
Ed is the author of Freedom from Want: American Liberalism and the Global Economy (2007). He has published in a variety of journals and newspapers, and his research has been cited by leading academics and international organizations including the WTO, World Bank, and International Monetary Fund. He is a graduate of Stanford University and holds a Master’s Degree in International Affairs from Columbia Universities and a certificate from the Averell Harriman Institute for Advanced Study of the Soviet Union.
Presidential elections are rarely decided on foreign policy, and this year will be no exception. But poll after poll shows a deepening, bipartisan fatigue with foreign entanglements.
The question we face, as important as who will be the next president, is will America slide into isolationism and a disastrous retreat from world affairs?
A new survey by the Wall Street Journal placed that fatigue in stark relief. It asked voters in seven battleground states which presidential candidate they thought was best equipped to guide American foreign policy—specifically, the conflicts in Ukraine and the Middle East. The result was stunning. Trump leads by a mile: 50 percent to 39 percent on who is best able to handle the war in Ukraine and 48 percent to 33 percent on managing the contest between Israel and Hamas. Also striking, on this issue, the former president enjoys a wide lead among independent voters and even garners significant support among Democrats.
“When I look at what it was I wanted to achieve in the first 100 days and ask myself, have we done what I wanted us to do, what I planned for us to do, the answer is yes.”
Claire Ainsley, chair of the Building Back Britain Commission and a former director of policy to Starmer, told BBC Radio 4’s Today programme that it was “daft to deny” the government had seen choppy moments.
But she argued that “some of the big judgement calls I think they have got right” – pointing to Starmer’s international diplomacy efforts and “honest” assessment of the state of the public finances.
For at least the last 25 years, the primary goal of K-12 schools in the United States has been “college for all”—the ideal that all high school graduates go to college. As a result, America’s schools do not typically provide young people with work experience or make career education central to their offerings. This gap leaves high school students with little understanding of work and the practical pathways to jobs, careers, and further education.
Today, college for all is losing public support. When Americans were asked to rank their priorities for K-12 education, “being prepared to enroll in a college or university” dropped from the 10th highest priority (out of 57) in 2019 to 47th in 2022, according to the nonpartisan think tank Populace. Other surveys reveal a growing skepticism about the value of a four-year degree. More than half of Americans (56 percent) think a degree is not worth the cost, with skepticism most pronounced among college-degree holders ages 18 to 34.
Many employers, meanwhile, no longer use a college degree as the gatekeeper credential for jobs, shifting from degree-based to skills-based hiring. And a study published by Strada Education Foundation of the careers of more than 60 million workers and millions of online job postings found that 10 years after degree completion, 45 percent of graduates were underemployed in jobs not requiring a degree.
The Biden administration’s steadfast support for Ukraine in its fight against Russian aggression has been laudable. But an inordinate and unwarranted fear of “escalation management” has hamstrung American policy.
Administration officials agonize over whether supplying certain weapons to Ukraine will be seen by the Kremlin as somehow escalatory. As a result, the provision of crucial military hardware like tanks, long-range rockets and fighter jets has been held back — only to eventually be provided without much more than grumbling from Moscow.
Even then, however, the administration persists in setting too many constraints on when and where Kyiv can use U.S. weapons for fear of antagonizing Vladimir Putin.