Category: Uncategorized
Pennsylvania Produces 1.5% of All World Energy
TRADE FACT OF THE WEEK: Pennsylvania produces 1.5% of all world energy.
THE NUMBERS: World energy production, 2022, in BTUs* –
| Area | Energy production |
| World | 598 quadrillion BTUs |
| China | 137 quadrillion |
| U.S. | 99 quadrillion |
| (Texas) | 25 quadrillion |
| (Pennsylvania) | 10 quadrillion |
| (New Mexico) | 7 quadrillion |
| Russia | 60 quadrillion |
| Saudi Arabia | 30 quadrillion |
| India | 22 quadrillion |
| Canada | 22 quadrillion |
| All other | 228 quadrillion |
* Energy Information Administration. A “BTU” (British Thermal Unit) is the amount of energy needed to raise the temperature of a pound of water by one degree Fahrenheit.
WHAT THEY MEAN:
From the “oil shocks” of the 1970s until recently, energy policy arguments featured mostly moaning, grim charts illustrating the consequences of “energy dependence” on unstable parts of the world, and predictions that things would get worse. Here’s what’s actually happened, using the year 2003 — 20 years ago — as a point of departure:
Starting point: According to the Energy Information Administration (the Department of Energy’s data and research arm), in 2003, Americans produced 67.3 quadrillion “BTUs” worth of energy, and used 95.8 quadrillion BTUs. This meant Americans bought, on net, about 28.5 quadrillion BTUs from foreigners, mostly in the form of crude oil. The resulting economy (a) employed 130 million people, (b) produced $11.7 trillion worth of farm products, manufactured goods, movies, government programs, and other goods and services (which, converted to the Bureau of Economic Analysis’ “constant 2017 dollar” figures to allow for meaningful comparisons with today’s economy, would be $14.9 trillion), and (c) released 5.7 billion tons of carbon dioxide.
Since then, two big changes in the energy figures:
More production: Scarcity and price instability produced curiosity about whether we might find more at home. With heavy deployment of solar panels and wind turbines, drilling for natural gas, and so forth, the BTU count of domestically produced energy has grown from 67.3 quadrillion in 2003 to 91.9 quadrillion in 2020, and 102.8 quadrillion in 2023. In other words, domestic energy production has jumped by 40% since 2003, and by 10% since 2020. According to the Bureau of Economic Analysis, Pennsylvania — the site of the world’s first oil well in 1859 — has seen energy income rise like this:
| Year | Energy Income |
| 2023 | $8.1 billion |
| 2019 | $5.3 billion |
| 2003 | $0.3 billion |
More Efficiency: Likewise, scarcity and price instability produce caution, efficiency, and savings. As America’s energy production has grown, use has dropped from 95.8 quadrillion BTUs in 2003 to 93.6 quadrillion in 2023. To put this 2.2 quadrillion BTU drop in perspective, total annual energy “consumption” figures are 10.8 quadrillion BTUs in Brazil, 1.6 quadrillion in Sweden, and 4.9 quadrillion in Taiwan. Carbon dioxide emissions, meanwhile, have dropped by about 25%, from 6 billion tons a year in the mid-2000s to 4.5 billion as of 2023.
Endpoint: As of 2023, the $28 trillion U.S. economy – $22.7 trillion in BEA’s constant 2017 dollars — employed 156 million people. Converting all this into BEA’s inflation-adjusted “constant 2017 dollars,” the 2% decline in energy use, and the accompanying 25% drop in carbon dioxide emissions, have accompanied the following big-picture changes:
| 2003 | 2023 | Change | |
| ‘Real’ GDP | $14.9 trillion | $22.7 trillion | +52% |
| Manufacturing | $1.7 trillion | $2.3 trillion | +36% |
| Mining | $0.16 trillion | $0.34 trillion | +111% |
| Agriculture | $0.14 trillion | $0.19 trillion | +36% |
| Employment | 130 million | 156 million | +26 million |
With respect to trade, meanwhile, the “dependence” of the 1970s through 2000s has not totally vanished — Americans still buy lots of crude oil from the Middle East, lots of solar panels from Southeast Asia, and lots of electricity from Canada. But fundamentally, the world depends on the U.S. to sell energy, not the other way around. Trade balance data, converted into BTUs, look like this:
Year US Trade Balance (BTUs)
2023 +9.2 quadrillion BTUs
2020 +3.5 quadrillion BTUs
2010 -21.7 quadrillion BTUs
2000 -24.9 quadrillion BTUs
1980 -12.1 quadrillion BTUs
What can we expect next? Energy trading will likely change sharply in the next decade, as fossil fuel use falls and countries rely more frequently on materials and machines used to generate and convert electricity, and thus use electricity in ways that look like “stocks” than “flows.” Neither renewable technologies like wind turbines nor electrified end-use technologies like heat pumps and batteries, for example, use fuels to operate. So perhaps “trade” will include fewer BTUs overall, and more materials and machines used to generate and convert electricity. Having surprised everyone by evolving into the world’s top source of energy since 2003, the U.S. now likely needs more powerful domestic clean energy supply chains to stay in the role.
* The “British Thermal Unit,” like the 159-liter/42-gallon “barrel ” of oil, is a defiantly non-metric energy unit. The BTU and the annual amount of dollar-trading on forex exchanges are the only indexes of human activity measured in quadrillions, and BTUs will likely soon hit the 1 quintillion — 1,000,000,000,000,000,000 — plane. As a comparison, the mass of the moon is about 78 quintillion tons.

FURTHER READING
PPI’s Elan Sykes and Paul Bledsoe on energy and the next American economy.
Gov. Josh Shapiro’s Pennsylvania energy strategy.
Data & rankings
The Energy Information Administration has the basic BTU-as-trade data … and ranks energy output by country.
Note on this: China is the world’s top energy producer, but rankings look different depending on the type. Of China’s 138 quadrillion BTUs, 106 quadrillion come from coal. India is the No. 2 coal producer at 17 quadrillion BTU, and Indonesia is third at 12 quadrillion; together with China, this is 80% of world energy from coal. The U.S. however edges China by 15 quadrillion to 14 quadrillion in “nuclear, renewables, and other”; the U.S. is also first in both natural gas at 37 quadrillion BTU (above Russia’s 23 quadrillion and Iran’s 10 quadrillion), and petroleum at 32 quadrillion as against Saudi Arabia’s 25 and Russia’s 23.
… EIA defines the “British Thermal Unit”.
ABOUT ED
Ed Gresser is Vice President and Director for Trade and Global Markets at PPI.
Ed returns to PPI after working for the think tank from 2001-2011. He most recently served as the Assistant U.S. Trade Representative for Trade Policy and Economics at the Office of the United States Trade Representative (USTR). In this position, he led USTR’s economic research unit from 2015-2021, and chaired the 21-agency Trade Policy Staff Committee.
Ed began his career on Capitol Hill before serving USTR as Policy Advisor to USTR Charlene Barshefsky from 1998 to 2001. He then led PPI’s Trade and Global Markets Project from 2001 to 2011. After PPI, he co-founded and directed the independent think tank ProgressiveEconomy until rejoining USTR in 2015. In 2013, the Washington International Trade Association presented him with its Lighthouse Award, awarded annually to an individual or group for significant contributions to trade policy.
Ed is the author of Freedom from Want: American Liberalism and the Global Economy (2007). He has published in a variety of journals and newspapers, and his research has been cited by leading academics and international organizations including the WTO, World Bank, and International Monetary Fund. He is a graduate of Stanford University and holds a Master’s Degree in International Affairs from Columbia Universities and a certificate from the Averell Harriman Institute for Advanced Study of the Soviet Union.

Read the full email and sign up for the Trade Fact of the Week.
Lewis for RealClearHealth: We Can Further Reduce Smoking
For what are often very different reasons, Republicans and Democrats are prone to anger when government doesn’t work. Conservatives are, by nature, skeptical of regulation. Progressives, by contrast, are frustrated when bureaucratic bungling gives the government a bad name. So it’s no surprise that there is growing bipartisan outrage over the Food and Drug Administration’s (FDA) failure to efficiently review novel reduced-risk products and allow them to enter the marketplace. Expediting consumer access to these products is both an obvious and commonsense approach to reducing the harm of smoking. The bottom line is clear: With the invention of new, safer nicotine delivery products, we have at our disposal a technology that is poised to dramatically reduce the nearly 500,000 smoking-related deaths that occur each year in America. But despite these innovations, the FDA is dragging its feet in making these devices available. At a moment when faith in public institutions is, in fact, flailing, the current predicament is utterly outrageous.
If we had the power to end the scourge of unhealthy choices in America, it would surely be for the greater good. But until someone invents that magic wand, smart public health policy demands that we steer people away from the most dangerous behaviors. As many know, among the most harmful ways to consume tobacco is through smoking it. Cigarette smoke fills the lungs, and that smoke and tar put smokers at great risk of a whole range of illnesses and conditions, with cancer and emphysema among them. That’s where smokeless tobacco and nicotine products come in. These new products are an incredibly effective strategy for reducing harm. Why, then, are federal regulators preventing so many of them from hitting the market?
Keep reading in RealClearHealth.
Johnson for The Bulwark: Economic Growth Is Good, Actually
By Jeremiah Johnson
RECENTLY, A THREAD THAT CALLED FOR a return to communal kitchens and handwashing laundry went viral on X, prompting a high-pitched conversation about the concept of “degrowth.” Mainstream liberals and conservatives both got in some entertaining dunks on the idea, but the episode also gave rise to some worthwhile discussions on the nature of economic growth. The ideology of degrowth as it’s most often articulated is stupid, and I won’t rehash the many good arguments against it here. What’s harder to explain is exactly why we value growth as opposed to other possible core values.
Keep reading in The Bulwark.
Moss in Bloomberg Law: Hotel-Casino Rulings Reveal Flaws in AI Price-Fixing Allegations
The hotel-casino rulings by Williams and Chief Judge Miranda Du of the US District Court for the District of Nevada add “contours” to evolving case law on algorithmic price-fixing, like whether algorithms can be used to reach an agreement among competitors, said Diana L. Moss, vice president and director of competition policy for the Progressive Policy Institute.
“The courts in the United States are pretty good at taking traditional principles and applying them to new settings, and the new setting of course is the digital setting,” Moss said. “At the end of this, we are going to have a body of case law, where a lot of these questions are going to be answered around whether algorithms can in fact serve as a method of communication to fix prices.”
But the judges in both the Las Vegas and Atlantic City cases applied the same rationale in their dismissals, saying the hotel-casinos weren’t required to accept pricing recommendations from the Rainmaker software and were free to make their own independent decisions.
“The courts are struggling with this issue—if members of the agreement were able to deviate, what does that mean for the allegations of a conspiracy?” Moss said.
Trade Fact of the Week: Is U.S. income inequality starting to decline?
FACT: Is U.S. income inequality starting to decline?
THE NUMBERS: U.S. “Gini coefficient” –
| Year | U.S. Gini coefficient |
| 2023 | 0.485 |
| 2022 | 0.489 |
| 2021 | 0.494 |
| 2020 | 0.488 |
WHAT THEY MEAN:
Last week’s Bureau of Economic Analysis calculations report that, since 2020, the U.S. economy has “grown” from $21.3 trillion to about $29.0 trillion this year, with “wages and compensation” making up about half of the total growth. Discounting inflation, the U.S. economy of 2024 is about $3.2 trillion larger than that of 2020, and incomes — workers, executives, farmers, self-employed, etc. — perhaps $2 trillion more. Who is making all this extra money? BEA gives you lots of ways to divide it, but one heartening point: with income inequality diminishing in 2022 and 2023, low-income and “working” families are getting a bit more of it than they were before.
As a point of departure, the “Gini coefficient,” devised by Venetian statistician Corrado Gini in 1912 (see more below on this unlovable person), provides a widely used measure of income equality. The “coefficient” runs from 0.000 to 1.000. At the theoretical 0.000 extreme, every clone-like individual (or every household, depending on what you’re measuring) would make exactly the same amount of money. The other end, 1.000, represents a Pharaoh-like state in which one single person gets every nickel. No country is especially close to either 0 or 1, but the U.S. shows up on the “more unequal” side. World Bank data for high-income countries, for example, finds only Chile and Panama with more “unequal divisions of income.” Here’s a representative sample of countries from their list (using only countries for the Bank has results for 2020 r more recent years), bracketed by Colombia at the “most income-unequal” end of the spectrum and Slovakia as “most equal”:
| Country | Gini coefficient |
| Colombia | 0.548 |
| Brazil | 0.520 |
| Zimbabwe | 0.503 |
| Costa Rica | 0.467 |
| United States | 0.413 |
| China | 0.357 |
| Thailand | 0.349 |
| Australia | 0.343 |
| United Kingdom | 0.329 |
| Germany | 0.324 |
| India | 0.328 |
| Canada | 0.317 |
| Denmark | 0.283 |
| Netherlands | 0.257 |
| Slovakia | 0.234 |
This placing for the U.S. in 2022 reflects the end-point of a longstanding trend, in which American incomes have been growing apart for about five decades. (Or, more precisely, the top end has been stretching up, relative especially to the bottom tiers.) Census records, which use a different approach than the Bank’s but find similar outcomes, put America’s Gini coefficient at 0.397 in 1967, then a slightly higher 0.403 in 1980, 0.462 in 2000, 0.481 in 2016, and 0.494 in 2021. In more real-world terms (with numbers adjusted for inflation), here’s how the Census sees family incomes changing from 2000 to 2021:
| Income Group | Income 2020 | Income 2021 | Growth |
| Top 20% | $237,300 | $301,600 | +27.1% |
| 4th “quintile” | $109,500 | $129,300 | +18.1% |
| Middle “quintile” | $70,430 | $79,830 | +13.3% |
| 2nd “quintile” | $42,490 | $45,940 | +8.1% |
| Lowest 20% | $16,940 | $16,640 | -1.8% |
Obviously, bare income data blurs some important points and conceals others altogether. Census uses “pre-tax income”; were they to add health insurance subsidies, student aid, nutrition programs, and so on, inequality and income measurements would look somewhat different, and the second and first “quintiles,” in particular, would fare better. Likewise, the quintiles of 2000 aren’t the same as those of 2023: a larger share of lowest-20% families, for example, may be recent immigrants expecting better things soon. But this noted, the patterns do suggest that (a) America’s affluent families gained ground faster in the century’s first two decades than the middle class, and the middle class faster than working families and the poor; and (b) inflation and rising housing prices (and taxation of clothes, spoons, and life necessities) hit lower-quintile families hardest.
Returning now to the most recent BEA and Census income and equality data, the record since the COVID-19 pandemic, and over the Biden/Harris administration’s first three years, looks strikingly better.
Census published its income figures for 2023 last month. They show the national “Gini coefficient” peaking at 0.494 in 2021, then falling to 0.489 in 2022 and 0.485 in 2023 — still high in historic terms, but the lowest figure since 2017. Meanwhile, the bottom three quintiles’ share of national income rose from 24.8% in 2021 to 25.5% in 2023, while the top 5%’s share fell from 52.7% to 51.9%. Taking this from percentages to actual income, in 2023 families earned about $17 trillion (including wages and salaries, plus pension payments, investment earnings, rental properties and farm incomes). Assuming shifting income distribution doesn’t change the totals, moving 1% of this $17 trillion from the wealthiest 5% to the bottom 60% means an additional $170 billion for the 83 million American middle- and low-income households, or an average of $2,000 each.

FURTHER READING
At home –
Census on incomes, equality and inequality:
BEA tallies U.S. GDP, growth, incomes, and more.
International comparisons –
The International Monetary Fund’s World Economic Outlook database (note updates coming in a couple of weeks) has growth, GDP size, and lots more for the world, regions, and countries.
The World Bank’s table comparing income inequality across countries, with (generalizing a bit) Latin America and southern Africa as the world’s least equal regions, and central and northern Europe most equal:
Background and more comparisons from Our World in Data:
And more on Corrado Gini –
Dr. Gini, though a pioneer of modern statistics, was also a sinister political nitwit. Head of the International Statistical Society in the 1920s, Gini also moonlighted as president of the Italian Eugenics Society, believed the “reproductive instinct” was in long-term decline, and as an enthusiastic Mussolini supporter wrote tracts such as the English-language article The Scientific Basis of Fascism. Later on he changed his mind and adopted a totally different view of the world, proposing in 1944 that the United States annex all the other countries and form a world government. A bio.
ABOUT ED
Ed Gresser is Vice President and Director for Trade and Global Markets at PPI.
Ed returns to PPI after working for the think tank from 2001-2011. He most recently served as the Assistant U.S. Trade Representative for Trade Policy and Economics at the Office of the United States Trade Representative (USTR). In this position, he led USTR’s economic research unit from 2015-2021, and chaired the 21-agency Trade Policy Staff Committee.
Ed began his career on Capitol Hill before serving USTR as Policy Advisor to USTR Charlene Barshefsky from 1998 to 2001. He then led PPI’s Trade and Global Markets Project from 2001 to 2011. After PPI, he co-founded and directed the independent think tank ProgressiveEconomy until rejoining USTR in 2015. In 2013, the Washington International Trade Association presented him with its Lighthouse Award, awarded annually to an individual or group for significant contributions to trade policy.
Ed is the author of Freedom from Want: American Liberalism and the Global Economy (2007). He has published in a variety of journals and newspapers, and his research has been cited by leading academics and international organizations including the WTO, World Bank, and International Monetary Fund. He is a graduate of Stanford University and holds a Master’s Degree in International Affairs from Columbia Universities and a certificate from the Averell Harriman Institute for Advanced Study of the Soviet Union.
Read the full email and sign up for the Trade Fact of the Week.
PPI Report Highlights Key Strategies for Democrats to Win Working-Class Voters
WASHINGTON — The 2024 UK General Election was nothing short of extraordinary, with Keir Starmer’s Labour Party securing a sweeping victory. But beneath the celebration lies a critical divide: Labour dominated the graduate vote, yet it lagged behind among non-graduates, an electorate that remains pivotal to long-term success. If Labour wants to sustain its victory — and if Democrats in the U.S. hope to learn from it — there is work to be done.
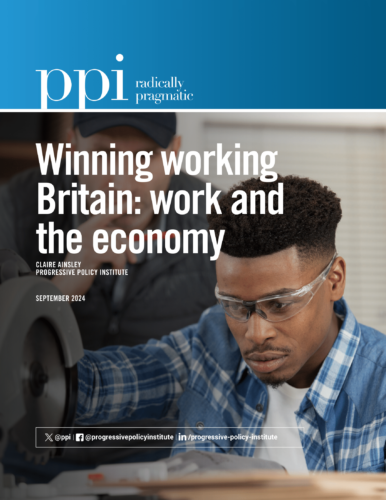
Today, the Progressive Policy Institute (PPI) unveiled a new report, Winning Working Britain: Work and the Economy, authored by Claire Ainsley, Director of the Project on Centre-Left Renewal at PPI. The report reveals that Labour’s margin among working-class voters was far narrower than its lead among graduates, and if the party is to maintain its electoral strength, it must address the needs of non-graduates, who remain skeptical.
“Labour’s success in winning back working-class voters is a remarkable achievement, but to build a sustainable coalition, the party must pay greater attention to non-graduates,” said Ainsley. “The same lesson applies to Democrats in the U.S. who have long struggled to balance their support base between college-educated voters and those without degrees.”
The report highlights key policies favored by working-class voters, particularly non-graduates. Among these, the top priority is affordable non-degree pathways to well-paying jobs, such as short-term training programs that combine work and learning. British workers also expressed a strong desire for more well-paid jobs that don’t require a university degree, especially in trades and the digital economy — sectors they see as offering the best opportunities for their children.
“Labour’s challenge now is to deliver on these economic aspirations. By focusing on expanding non-degree career opportunities and boosting wages for those without a college education, the party can bridge the gap and ensure its long-term success,” Ainsley added.
The report concludes with actionable recommendations for center-left parties, emphasizing the need to elevate the voices and interests of non-graduates. It serves as a roadmap not only for Labour but also for Democrats in the U.S. as they seek to rebuild their own coalition ahead of the 2024 elections.
Read and download the report here.
For further U.S.-focused insights, former PPI Director of Workforce Development Policy Taylor Maag highlights better career alternatives to college and offers specific policy recommendations for the U.S. audience in her report, “Career Pathways: How to Create Better Alternatives to College.”
The Progressive Policy Institute (PPI) is a catalyst for policy innovation and political reform based in Washington, D.C. Its mission is to create radically pragmatic ideas for moving America beyond ideological and partisan deadlock. Learn more about PPI by visiting progressivepolicy.org. Find an expert at PPI and follow us on Twitter.
###
Media Contact: Ian O’Keefe – iokeefe@ppionline.org
Ainsley for LabourList: ‘Why Labour needs to be the champion for non-graduates too’
The July general election result was extraordinary in many ways, not least because of the stark divide in the votes of graduates and non-graduates. Labour ate up votes amongst those with a university degree, defeating the Conservatives by 42 points to 18.
But the Tories did slightly better than Labour amongst those with GCSEs or lower (31 vs 28). And if Reform hadn’t stood, that gap might have been wider, as 23% opted for Reform this time around.
With a 411 majority, its tempting to bank the wins. But in the longer term, and certainly by the time of the next election, Labour would do well to pay attention to how the party can improve its position amongst non-graduates.
Keep reading in LabourList.
Winning Working Britain: Work and the Economy
Introduction
On 4th July 2024, Keir Starmer’s Labour Party achieved a landslide victory at the UK General Election, winning 411 out of 650 parliamentary seats in towns, cities, suburbs across England, Scotland and Wales.
Labour reversed its historic decline amongst working-class voters, as a result of a specific strategy to reconnect the party with voters that had formed a critical part of their founding electoral coalition. This matters not just for its symbolism, but because there is simply no route to a parliamentary majority in British politics without winning significant numbers of working-class voters. It also matters because it shows to center-left parties around the world that it is possible to win over lost working-class voters, a crucial part of the winning electoral coalition.
However a sizable portion of working-class voters in particular opted for new party Reform UK, and underneath Labour’s considerable achievement is a recognition that many voters feel sceptical that any party can really deliver for them. As Labour moves from campaigning to governing, they will need to be just as focussed on winning over working-class voters as they were in opposition.
Using data collected in the run up to the UK General Election, this new PPI report outlines the priorities of Britain’s working-class voters on the area that matters most to them: work and the economy. It builds on the foundational report on the global center-left, PPI’s ‘Roadmap to Hope’ published in October 2023. The reports are the UK companion to PPI’s Campaign for Working Americans, which aims to refocus the Democrats on regaining the allegiance of working Americans by championing their economic aspirations and moral outlook.
Our aim is to help catalyse a dynamic, modern center-left that can win the support of workingclass voters by providing better answers than the political right to the challenges they face. We are willing UK Labour to succeed in government, and the Democrats to succeed in their campaign to retain the Presidency. The opportunity facing the centre-left is to be the dynamic force that brings back hope to working class voters, so that they face the future with optimism about the prospects for themselves and the next generation.
In ‘Roadmap to Hope’, PPI research found that working-class voters felt the deal whereby if you worked hard you can get on in life had broken down. We argue that the centre-left cannot win and sustain power purely by being the beneficiaries of disenchantment with the political right, but by building a programme that addresses people’s security and prospects for the future.
PPI outlined a set of practical ideas to re-make the deal for working people with the following goals:
1. Relentless focus on raising wages for those on low to middle incomes
2. Stabilise supply and costs of essential goods and services
3. Open up housing investment to the next generation
4. Reform school education to become the driver of progress
5. Replace ‘one rule for them’ with ‘same rules apply’, including on immigration.
This report focusses on the experience and wants of working-class voters on work, costs and the economy, and the political and policy solutions to form the winning centre-left agenda.
Read the full report.
Manno for Forbes: The “Saving Grace” Of Today’s Community Colleges
By Bruno Manno
“Community colleges may prove the saving grace of college-level learning in America,” wrote historian Sean Trainor in a 2015 article in TIME magazine.
Today, almost a decade later, two recent reports echo this notion in their call for community colleges to up their game and make a major contribution to improving the futures of young people and working-class Americans who don’t have college degrees.
Both reports describe the role these institutions should play in expanding America’s workforce education and training efforts, especially by greatly increasing the number of employer-connected apprenticeships and creating a new learning campus that combines paid work and education.
Keep reading in Forbes.
Manno for National Affairs: Earn-and-Learn Education
By Bruno Manno
For at least the last 25 years, the primary goal of American K-12 schools could be summed up in three words: college for all. As a consequence, most K-12 schools today don’t see career education as central to what they offer. Emphasizing vocational training and experience is thought to undermine the lofty ideal of ensuring that every student attends college and completes a four-year degree.
Though it stems from noble intentions, our focus on preparing students for higher education does not serve them well. Rather, it fails to provide young people with the practical knowledge and skills that would benefit them once they graduate. It also produces an experience gap. Young people leave high school with little understanding of the world of work and the pathways to employment. This disconnect makes it more difficult for them to transition from school to a career.
Today, college for all has lost significant public support. Many no longer believe that a college degree is the default route to success. At the same time, older ways of preparing for a career are gaining popularity.
Keep reading in the National Affairs Fall 2024 Issue.
Marshall in USA Today: ‘Adult money’ and no college debt: Harris and Trump back alternative routes to good jobs
While both Democrats and Republicans expressed support for alternative pathways to college – and even passed the 2015 American Apprenticeship Initiative, giving more than $100 million to expand registered apprenticeships into new sectors – much of the focus remained on higher education.
Will Marshall, founder and president of the Progressive Policy Institute, a center-left think tank, said he remembers being criticized by more liberal friends for not embracing college-for-all policies. Marshall had advocated for public investment in apprenticeships and non-college career programs.
The tone began to change, he said, shortly after Trump was elected in 2016.
“People began to look at what I think is the most important development of national politics, which is the polarization of the parties along educational lines,” Marshall said.
That year, Trump won more support from voters without a college degree, whereas his opponent, Hillary Clinton, garnered more votes from college graduates.
The outcome was a wake-up call for progressives, Marshall said.
“It dawned on people that the non-college majority, including the hardcore Trump supporters, weren’t looking for college, they were looking for short-term training and accreditation programs, other ways to break into the labor market,” Marshall said.
“We’re living at a time where partisanship seems to be off the charts,” Marshall said. “Even issues that aren’t intrinsically ideological or partisan can get caught up in the new imperative of non-cooperation.”
For instance, the Biden administration in 2021 rescinded a Trump-era rule that allowed industry and trade groups to develop and oversee their own apprenticeship programs. They argued the industry apprenticeships were often inferior to ones approved by the Department of Labor.
Like most policy, Marshall said passing workforce solutions under the next president – whether it’s Trump or Harris – will require some give and take.
“People are looking for alternative pathways,” he said. “It’s the responsibility of our nation’s political leaders to make sure that we have a system for non-degree folks to earn and learn that is as robust as our post-secondary or higher education system.”
Jacoby for NYP: AI is reshaping drone warfare in Ukraine
By Tamar Jacoby
It looked like an ordinary, modest house on the outskirts of Sloviansk, a small city just behind the front line in eastern Ukraine. But the parlor’s heavy furniture had been replaced by folding tables and six big flat-screen TVs. Five men in fatigues monitored the images flashing across the screens: direct feeds from some three dozen first-person-view (FPV) drones hovering above the front line just 15 miles away.
There were no fighters in the images and no weapons or military vehicles. Both Russians and Ukrainians have learned to keep all that hidden from the drones constantly swarming overhead. But the invaders could still advance at any moment, and the soldiers in the command center — members of a new unit called “Heavenly Punishment” — scoured the video feeds, zooming in and out on tree lines and scattered rocks that might disguise foxholes.
A sixth screen integrated the information from the feeds: a giant animated map showing both sides’ positions and assets — a Russian tank here, a Russian surveillance drone loitering there. No one spoke as the men watched and probed, waiting for the opportunity to order a strike, either by an attack drone or one of the unit’s few remaining artillery cannons.
Keep reading in New York Post.
Jacoby for Bulwark: Ukraine Isn’t Ready for Pro-Putin GOP
By Tamar Jacoby
Ukrainian President Volodymyr Zelensky made a couple of unforced errors in the last few weeks. They were all small things, the kind of missteps we all make occasionally, and even on the world stage, they might have gone unnoticed. But the Ukrainian leader had no idea what he was up against—a Republican party determined to turn him and the global conflict in Ukraine into this cycle’s political football.
Zelensky and his team had been working for months to cultivate Donald Trump and his entourage. It wasn’t just, as Zelensky said in the letter he sent to Trump on Thursday, that he had always tried to show “respect” for the former president. Like other governments across Europe, the Ukrainians were well aware that Trump had at least an even chance of retaking the White House, and they were determined to establish a relationship. Some even hoped that Trump could be a friend—that unlike Joe Biden and Kamala Harris, who have given Kyiv just enough help to hold off the Russian army but not enough to win, Trump might be more decisive, forcing a definitive outcome that might benefit Ukraine.
Kyiv worked tirelessly to forge ties to anyone who might have Trump’s ear—former Secretary of State Mike Pompeo, Sen. Lindsey Graham, former British Prime Minister Boris Johnson, and others. Zelensky held his tongue no matter what Trump said about Ukraine or what foolish boasts he made about ending the war in 24 hours. The Ukrainian leader even called Trump after the first assassination attempt, and the two had what Trump reported was a “very good” conversation.
Keep reading in The Bulwark.
Marshall for The Hill: What Keir Starmer’s victory means for Kamala Harris
Vice President Kamala Harris has righted her party’s capsized ship and opened a small but consistent lead over Donald Trump in national polls. Now comes the decisive test: Charting a winning course in the Electoral College.
To attain a majority of 270 votes or more, Harris and her running mate, Minnesota Gov. Tim Walz (D), must carry at least three, and in some scenarios four of the seven battleground states. All look like dead heats today.
They can count on a strong turnout by a reenergized Democratic base, but that won’t be enough. You can’t win swing states without winning swing voters. The campaigns are spending prodigiously in these states to sway roughly 3 million voters who tell pollsters they’ve yet to make up their minds.
Ritz in MSNBC: Trump’s own followers literally laughed at his crypto debt idea
But the GOP presidential nominee wasn’t kidding about his magical solution for the national debt, which Republicans only seem to care about during Democratic presidencies. In fact, Trump made the same suggestion in a Fox News interview last month, saying that “a little crypto check” could “wipe out” the $35 trillion. If it were that easy, one wonders why he didn’t do it during his first term.
Now, the suggestion — as dumb as it sounds — seems like a way to reward the crypto bros who’ve backed Trump’s campaign. To better understand how disastrous this idea could ultimately be in practice, I recommend reading this Forbes article by analyst Ben Ritz, and this Medium article by crypto entrepreneur Tavonia Evans.
In the meantime, it appears we can add cryptocurrency to wind power, basic economics, climate change and reproductive health to the long list of topics about which Trump is utterly clueless.