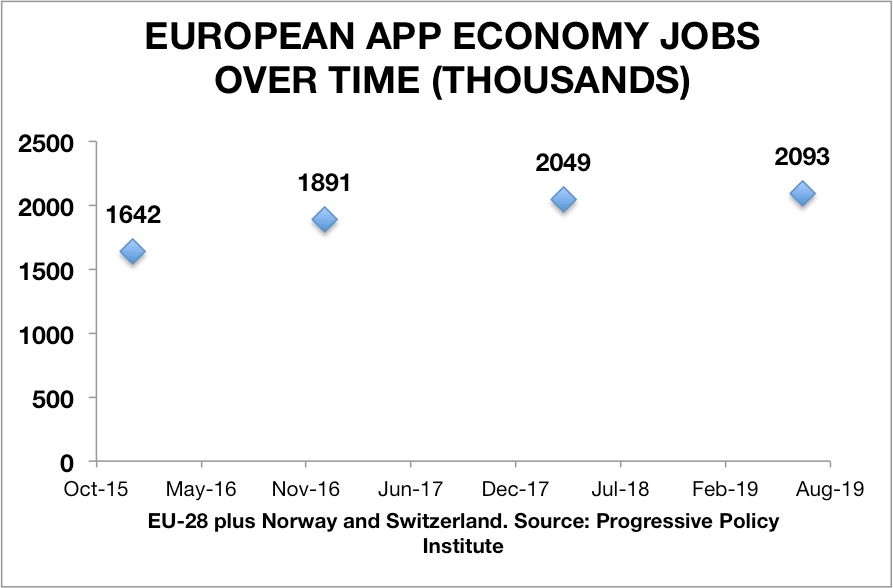
In this note we update our previous estimates of European App Economy jobs. Our latest research estimates that the EU-28 countries (plus Norway and Switzerland) have 2.093 million App Economy jobs as of July 2019. That’s up 27% from the 1.642 million jobs that we estimated for January 2016 in our first European App Economy jobs report (released June 2016). We follow the methodology described in the appendix to our 2017 European App Economy report. For a summary description of the basic approach, see the recent update on U.S. App Economy jobs.
We also estimate European App Economy jobs by mobile operating system. As of July 2019, there were 1.584 million jobs in the European iOS ecosystem and 1.693 million jobs in the European Android ecosystem. (The iOS and Android numbers add up to more than the total, because many App Economy jobs belong to both ecosystems).
| European App Economy Jobs by Operating System (July 2019)* | |||||
| (thousands) | |||||
| Total app economy | 2093 | ||||
| iOS ecosystem | 1584 | ||||
| Android ecosystem | 1693 | ||||
| *30 country total. Includes estimates for Norway and Switzerland | |||||
| Data: ILO, PPI, Indeed | |||||
Our approach allows us to estimate European App Economy jobs by country and leading cities. The top country for App Economy jobs is the United Kingdom, followed by France, Germany, the Netherlands, Spain and Sweden. The UK is the leader in iOS ecosystem jobs, with France closely followed by Germany. France and the UK are tied for the lead in Android ecosystem jobs.
| European App Economy Jobs by Country (July 2019) | |||
| (thousands) | |||
| Total app economy jobs | iOS ecosystem jobs | Android ecosystem jobs | |
| Austria | 25 | 19 | 21 |
| Belgium | 29 | 22 | 23 |
| Czech | 42 | 29 | 30 |
| Denmark | 52 | 41 | 37 |
| Finland | 48 | 37 | 42 |
| France | 350 | 236 | 296 |
| Germany | 296 | 233 | 239 |
| Greece | 10 | 6 | 8 |
| Hungary | 25 | 17 | 20 |
| Ireland | 20 | 16 | 12 |
| Italy | 94 | 70 | 77 |
| Luxembourg | 4 | 2 | 3 |
| Netherlands | 212 | 171 | 163 |
| Norway | 43 | 36 | 37 |
| Poland | 78 | 53 | 60 |
| Portugal | 37 | 28 | 27 |
| Romania | 24 | 19 | 21 |
| Spain | 101 | 77 | 82 |
| Sweden | 98 | 72 | 84 |
| Switzerland | 34 | 25 | 31 |
| United Kingdom | 366 | 295 | 296 |
| 30-country total* | 2093 | 1584 | 1693 |
| *Includes estimates for Bulgaria, Croatia, Cyprus, Estonia, Latvia, Lithuania, Malta, Slovakia, and Slovenia. | |||
| Data: ILO, Indeed, PPI | |||
The top European city for App Economy jobs according to our research is London, followed by Paris, Amsterdam, Stockholm, and Berlin. Germany has a remarkable six cities in the top 30 and the Netherlands has four cities in the top 30. Noticeably missing from the top 30 list is Rome.
| European App Economy Jobs by Major City (July 2019) | |||||
| (Thousands) | |||||
| Total app economy | iOS ecosystem | Android ecosystem | |||
| 1 | London | 175 | 141 | 141 | |
| 2 | Paris | 169 | 114 | 143 | |
| 3 | Amsterdam | 84 | 68 | 64 | |
| 4 | Stockholm | 56 | 41 | 47 | |
| 5 | Berlin | 54 | 43 | 44 | |
| 6 | Rotterdam* | 45 | 36 | 34 | |
| 7 | Barcelona | 42 | 32 | 34 | |
| 8 | Helsinki | 36 | 28 | 32 | |
| 9 | Copenhagen | 34 | 27 | 25 | |
| 10 | Eindhoven | 34 | 27 | 26 | |
| 11 | Madrid | 33 | 25 | 27 | |
| 12 | Milan | 30 | 23 | 25 | |
| 13 | Munich | 30 | 23 | 24 | |
| 14 | Manchester | 26 | 21 | 21 | |
| 15 | Utrecht | 25 | 21 | 20 | |
| 16 | Oslo | 25 | 21 | 22 | |
| 17 | Prague | 25 | 17 | 18 | |
| 18 | Warsaw | 22 | 15 | 17 | |
| 19 | Frankfurt | 22 | 17 | 17 | |
| 20 | Stuttgart | 21 | 17 | 17 | |
| 21 | Lisbon | 21 | 15 | 15 | |
| 22 | Brussels | 20 | 15 | 16 | |
| 23 | Cologne** | 20 | 16 | 16 | |
| 24 | Budapest | 20 | 13 | 15 | |
| 25 | Lyons | 19 | 13 | 16 | |
| 26 | Hamburg | 18 | 14 | 15 | |
| 27 | Zurich | 18 | 13 | 16 | |
| 28 | Birmingham | 16 | 13 | 13 | |
| 29 | Krakow | 15 | 10 | 12 | |
| 30 | Dublin | 14 | 11 | 9 | |
| *Radius around Rotterdam is only 45 kilometers to avoid overlap with Amsterdam. | |||||
| **Includes Dusseldorf. | |||||
| Urban areas are defined as 50 kilometers or 30 miles around a center city. We did not have data for urban areas in Bulgaria, Croatia, Cyprus, Estonia, Latvia, Lithuania, Malta, Slovakia, and Slovenia. | |||||
| Source: Progressive Policy Institute | |||||
We also looked at change in App Economy jobs by country over time. To reduce the effect of statistical noise, we compared the average of the 2016 and 2017 estimates with the average of the 2018 and 2019 estimates. We note that the only countries with declining App Economy jobs are Italy and Poland. The United Kingdom’s 5% increase is surprisingly small, and perhaps reflects the impact of Brexit. By contrast, Ireland’s App Economy employment rose by 24%.
| Change in App Economy Jobs by Country, 2016-17 to 2018-19 | |||
| (thousands) | |||
| 2016-17* | 2018-19** | percentage change | |
| Austria | 20 | 32 | 64% |
| Belgium | 24 | 28 | 14% |
| Czech Republic | 29 | 35 | 19% |
| Denmark | 40 | 50 | 26% |
| Finland | 51 | 51 | 1% |
| France | 244 | 287 | 17% |
| Germany | 289 | 319 | 10% |
| Greece | 7 | 8 | 11% |
| Hungary | 17 | 19 | 14% |
| Ireland | 14 | 18 | 24% |
| Italy | 99 | 92 | -7% |
| Luxembourg | 2 | 3 | 31% |
| Netherlands | 155 | 193 | 25% |
| Norway | 46 | 51 | 11% |
| Poland | 68 | 63 | -7% |
| Portugal | 29 | 34 | 15% |
| Romania | 21 | 25 | 18% |
| Spain | 82 | 92 | 12% |
| Sweden | 82 | 95 | 16% |
| Switzerland | 32 | 34 | 7% |
| United Kingdom | 326 | 342 | 5% |
| *Average of 2016 and 2017 estimates. **Average of 2018 and 2019 estimates. Source: Progressive Policy Institute | |||

