In a perfect example of unintended consequences, restaurant workers are pushing back against a nationwide campaign by labor advocates intended to raise their wages. They worry that the advocates’ push will cost them more in lost tips than they’ll gain in mandated wage increases – and cut their income overall.
These workers have found an ally in New York Governor Andrew Cuomo, who has come up with a sensible compromise that strikes a balance between overdue increases in the minimum wage and protecting workers who rely on tips.
Under federal law the minimum “cash wage” for tipped workers is $2.13 an hour, with tips making up the rest of workers’ pay. If tips don’t bring the worker up to the full federal or state minimum wage (whichever is higher), the employer is required by law to make up the rest. However, advocates’ “One Fair Wage” campaign aims to eliminate the tipped wage at the state level.
Seven states – California, Nevada, Alaska, Oregon, Washington, Montana, and Minnesota – have eliminated the tipped wage, requiring employers to pay the full minimum wage plus tips. This has drawn furious protests from both restaurant workers and owners, who say it means lower pay and lost jobs.
A 2018 survey by restaurant platform Upserve found that workers overwhelmingly – by 97 percent – prefer the tipped system to the full minimum wage. In Maine and Washington, D.C., restaurant workers led efforts to reverse laws passed under pressure from the One Fair Wage campaign.
Enter Governor Cuomo. In December, Cuomo’s Labor Department issued an order eliminating the tipped wage for some service sector occupations such as nail salon workers, hairdressers, and valet parking attendants, while retaining it for the restaurant industry. Cuomo’s rationale was to combat wage theft in those industries with the highest risk, while preserving the tipped wage system for restaurant workers who earn more than they would receiving the full minimum wage.
It’s been a popular move. Data from the Bureau of Labor Statistics show the annual median wage of waiters and waitresses, including tips, to be higher in New York than every state that has eliminated the tipped wage, and the annual median wage of bartenders to be higher in six of the seven states.
As PPI wrote in 2018, studies have shown that raising the tipped wage does not increase wages for restaurant workers because diners often end up tipping less. For instance, Census Bureau economist Maggie Jones found that raising the tipped minimum wage “increase[s] that portion of wages paid by employers, but decrease[s] tip income by a similar percentage.” Concern about declining tips and lower wages is why many restaurant workers have opposed an increase in the tipped minimum wage.
Restaurateurs also favor the tipped wage, as it enables owners to succeed in an industry with notoriously razor thin profit margins of 3 to 5 percent. Many owners cite having to close or cut hours (and thus wages) if faced with higher labor costs from raising or eliminating the tipped wage. When San Francisco increased its minimum wage from $13 an hour to $14 an hour in July 2017, bar owner Miles Palliser was forced to close after 5 years. “I think that the dramatic rise in minimum wage definitely affected us at the Corner Store and probably all three of our places in some fashion,” he told the San Francisco Chronicle at the time.
Governor Cuomo’s compromise is a win-win for both restaurant workers and owners. Other states should follow New York’s example.
Some are concerned that subprime auto loans – which offer higher interest loans to riskier borrowers – pose a threat to the stability of the global economy in much the same way that the subprime mortgage market contributed to the Great Recession. Democratic presidential candidate Elizabeth Warren, in particular, has raised the warning flags as part of her campaign. But these worries are ill-founded and based on misleading data and faulty analogies.
In particular:
Auto loans account for a relatively small percentage of the increase in nonfinancial debt over the past five years;
Americans are spending less of their budgets on car purchases today, including finance charges, than they were before the recession;
Low-income households saw motor vehicle purchases and finance charges fall from 8.5 percent of household budgets in 2000 to 4.9 percent in 2018;
Over the past five years, the share of new auto loans going to low-credit borrowers has remained relatively constant. There are no signs that low-credit borrowers are either being frozen out of the market or becoming too large a share of loans;
Newly delinquent auto loans, as a percentage of current balances, have been falling over the past two years; and
Subprime auto loans differ significantly from subprime mortgages in key respects that make them less likely to pose a serious threat to financial stability
Risk-based pricing of auto loans appears to be working so far, keeping low-income borrowers in the market without driving up delinquencies or to low-income consumers, while not posing the same risk that the subprime mortgage market.
Introduction
To purchase a vehicle, Americans with low or non-existent credit scores often use auto loans with higher interest rates than loans to prime borrowers. Some market watchers have indicated concern about “subprime” auto-loan trends and the potential for a crisis similar to the subprime mortgage crisis that heralded the last recession.
The subprime mortgages and the related mortgage-backed bonds remain the classic case of a poorly executed financial innovation. The initial impetus behind the idea was a good one. Housing is a key element of middle-class wealth, so expanding the system of mortgage finance to help lower-income households buy homes seemed like a positive. However, the subprime mortgages and bonds were designed in such a way that they assumed rising housing prices. When housing prices started to fall, the subprime mortgage system collapsed and contributed to the financial crisis.
Will subprime auto loans create the same problems? In a recent essay, Democratic presidential candidate Senator Elizabeth Warren raised the warning flag:
Auto loan debt is the highest it has ever been since we started tracking it nearly 20 years ago, and a record 7 million Americans are behind on their auto loans — many of which have similar abusive characteristics as pre-crash subprime mortgages1 .
Warren is not alone in her worries. In late 2016, for example, the Office of the Comptroller of the Currency warned that auto-lending risk was increasing and that banks (and other investors in securitized assets) did not have sufficient risk-management policies in place. Fed Governor Lael Brainard pointed to subprime auto lending as an area of concern in a May 2017 speech, while analysts worried about “deep subprime” auto loans2. Some groups used the term “predatory” auto lending.3
But these concerns are misplaced. As we will show later in this paper, the statistic cited by Senator Warren does not reflect the current state of the auto loan market, as it includes old loans from much weaker economic times. Perhaps most fundamental to understanding the problem with drawing a parallel between the mortgage crisis and today is the fact that subprime mortgages and subprime auto loans are very different products.
Naturally, lower-income households with low credit scores or limited credit history may have fewer financial resources and be inherently riskier borrowers. Moreover, the fact that motor vehicles depreciate over time means that the collateral for the loan becomes less valuable.
Nevertheless, the ability to own a car and, therefore, access credit is crucial for this population. Risk-based pricing charges low- rated borrowers higher interest rates, but in return, offers them the opportunity to borrow money to buy a vehicle that might otherwise be financially inaccessible.
For many lower-income households, their vehicle is the single biggest asset they own.
While vehicles do not appreciate in value as homes do, vehicles are income-producing assets in the sense that they are often essential for commuting to work, especially in non-urban areas. As one report noted, “Owning a car is the price of admission to the economy and society in much of America.”4
In this paper, we analyze the auto loan market, paying particular attention to auto loans made to low-income Americans and to people with bad credit. We find that:
Auto loans account for a relatively small percentage of the increase in nonfinancial debt over the past five years;
Americans are spending less of their budgets on car purchases today, including finance charges, than they were before the recession;
Low-income households saw motor vehicle purchases and finance charges fall from 8.5 percent of household budgets in 2000 to 4.9 percent in 2018;
Over the past five years, the share of new auto loans going to low-credit borrowers has remained relatively constant. There are no signs that low-credit borrowers are either being frozen out of the market or becoming too large a share of loans;
Newly delinquent auto loans, as a percentage of current balances, have been falling over the past two years; and
Subprime auto loans differ significantly from subprime mortgages in key respects that make them less likely to pose a serious threat to financial stability.
Risk-based pricing of auto loans appears to be working so far, keeping low-income borrowers in the market without driving up delinquencies or threatening the financial system. We conclude that the subprime auto loan market is beneficial to low-income consumers, while not posing the same risk that the subprime mortgage market did before the financial crisis. While it will be instructive to observe subprime auto loan trends going forward, current trends do not indicate significant instability concerns in this market.
Recent Patterns in Debt Accumulation
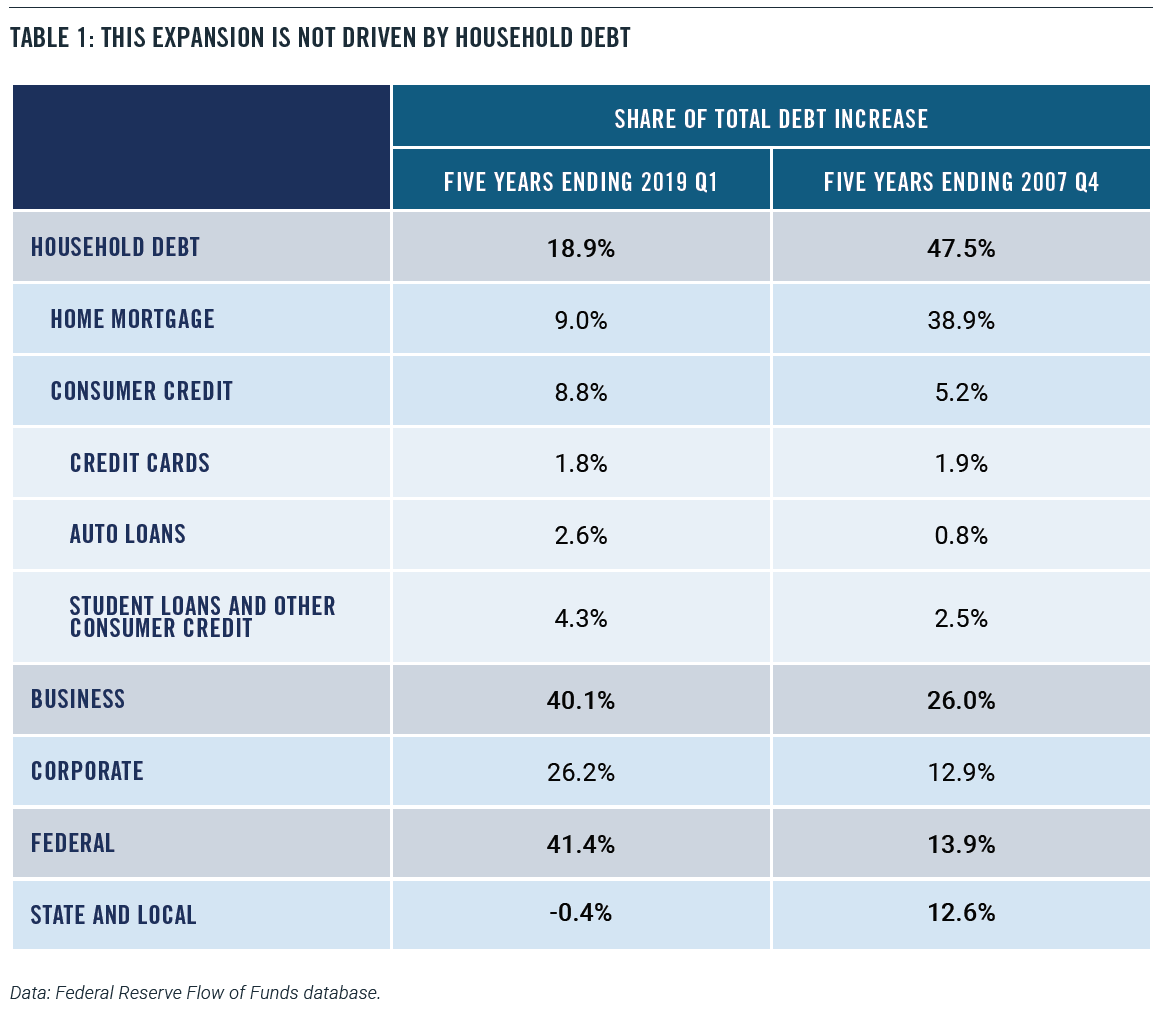
Recent patterns in debt accumulation are very different from those that preceded the financial crisis and Great Recession. Non-mortgage consumer credit – including auto loans, credit cards, and student debt – has risen by $900 billion over the past five years, according to Federal Reserve data. While that figure sounds substantial, that increase amounts to less than 9 percent of the total increase in domestic nonfinancial debt – that is, all debt except borrowing by financial institutions. The rise in consumer borrowing is dwarfed by the increase in business debt ($4.1 trillion) and federal debt ($4.2 trillion) over the same period. Those two categories together account for 82 percent of the increase in domestic nonfinancial debt (Table 1). The leading contributors to business debt growth are mortgages and corporate bonds.
Indeed, businesses have taken the greatest advantage of low-interest rates. Nonfinancial corporations have almost doubled their outstanding corporate bonds since the end of 2007 when the last recession started. Meanwhile, household debt has risen by only 10 percent.
Taking home mortgages into account, households have only accounted for 19 percent of the increase in domestic nonfinancial debt since 2014. By contrast, in the five years leading up to the Great Recession, households accounted for 48 percent of the debt increase. In other words, the financial boom in the pre-recession years was heavily driven by household borrowing, while households have only contributed a small portion to the current debt increase.
A skeptic could argue that, given derivatives and financial engineering, it’s possible for a relatively small portion of the debt market to drive an outsize increase in risk for the whole system. Indeed, that’s what happened ahead of the 2008 financial crisis. In May 2007, then-Chairman of the Federal Reserve Ben Bernanke famously said, “We believe the effect of the troubles in the subprime sector on the broader housing market will be limited, and we do not expect significant spillovers from the subprime market to the rest of the economy or to the financial system.”5 At the time, the value of subprime mortgages was about $1.3 trillion, which was only 10 percent of the mortgage market and an even smaller share of total borrowing. Bernanke and other policymakers figured that the problems in subprime mortgages could be easily contained.
What Bernanke and others failed to reckon with, however, was how the subprime mortgages had been designed to make sense only in a rising real estate market. Subprime mortgages were constructed effectively to subsidize interest rates with the possibility of appreciation. These financial instruments would offer low upfront rates that enabled lower-income borrowers to qualify. When the teaser rates eventually reset to much higher levels, the assumption was that the borrower could refinance into a new mortgage.
Moreover, the subprime mortgages were then securitized and used to build complicated financial derivative products. And when the subprime mortgages failed because of declining home prices, so did the derivatives. In other words, problems in a relatively small financial sector could be amplified and have a much larger effect on the rest of the economy.
Despite this concern, there is evidence to suggest that subprime auto lending is not a substantial risk to the broader economy. Auto loans are only 7.4% of household debt, which is the 40-year historical average.6 Moreover, the auto asset-backed securities (ABS) market is likewise dwarfed by the mortgage-backed securities (MBS) market. As of the second quarter of 2019, there was a mere $264 billion in auto-related securities, which included only $55 billion in subprime auto securities. By comparison, the amount of outstanding mortgage-related securities came to almost $10 trillion.7
Further, subprime auto loans don’t work the same way that subprime mortgage loans did in the pre-crisis era. Cars and trucks depreciate steadily over time, so the value of the collateral diminishes. That means lenders can’t afford to offer teaser rates, or excessive levels of negative equity, to buyers with low credit scores. They must charge higher rates, properly pricing risk. As one article put it, “the very nature of a real estate loan is very different from an auto loan. Real estate is an investment that typically appreciates over time. During the bubble years, consumers and lenders falsely believed appreciation would bail them out from poor judgment. Vehicles, on the other hand, depreciate. There is no false hope of higher values in the future to bail out a borrower or a lender.”8
The Auto Market
Despite the relatively small role that consumer debt is playing in the current debt expansion, some people can’t shake the idea that Americans are over-spending and over-borrowing to maintain a particular lifestyle. Consider this quote from an April 2019 piece from Business Insider:
The fact that America’s top-selling vehicle — a Ford truck with a price starting at nearly $30,000 – and many like it cost nearly half the median household income hasn’t stopped people from buying them and hasn’t stopped lenders from facilitating loans.9
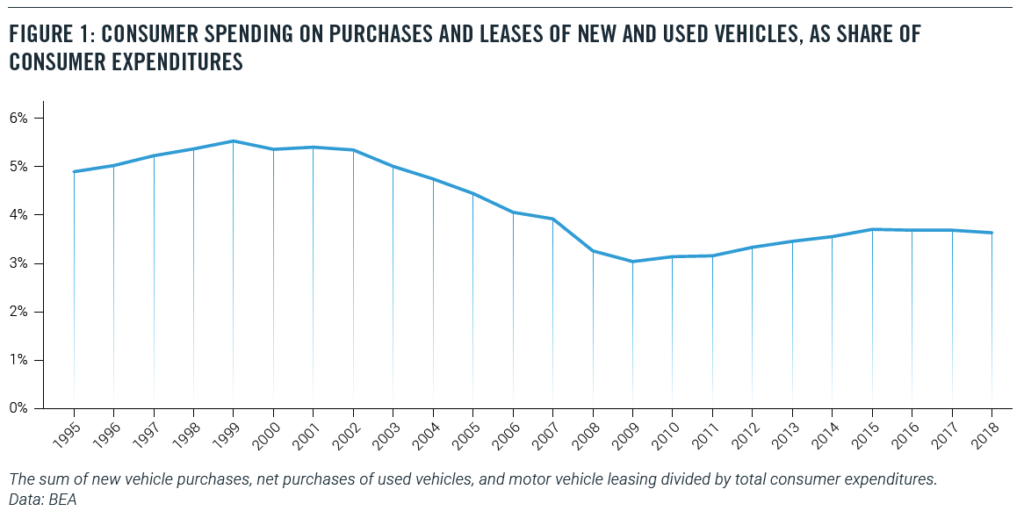
Over the past five years, the price of new motor vehicles has risen by only 1.1 percent, according to estimates by the Bureau of Economic Analysis (BEA).10 By contrast, the overall price level of consumer goods and services have risen by 6.7 percent over the same stretch.11 In other words, the relative price of new motor vehicles has fallen over this period.
Not surprisingly, the share of consumer spending on new and used vehicles has fallen as well. In 2000, 5.4 percent of consumer spending went to purchases and leases of new and used vehicles. Today, that share is down to 3.6 percent (Figure 1).12
The BLS Consumer Expenditure Survey tells the same story. In 2000, motor vehicle purchases and finance charges amounted to 9.7 percent of household outlays. As of 2018, the last year for which full data is available, the share of vehicle purchases and finance charges fell to only 6.7 percent of household outlays.13 In part, this decline may represent a lengthening of the term of auto loans.14 (These figures would not be changed much by including automobile lease-related payments, which amount to about 10 percent of automobile purchase-related payments in 2018.)
The State of the Low-Income Auto Market
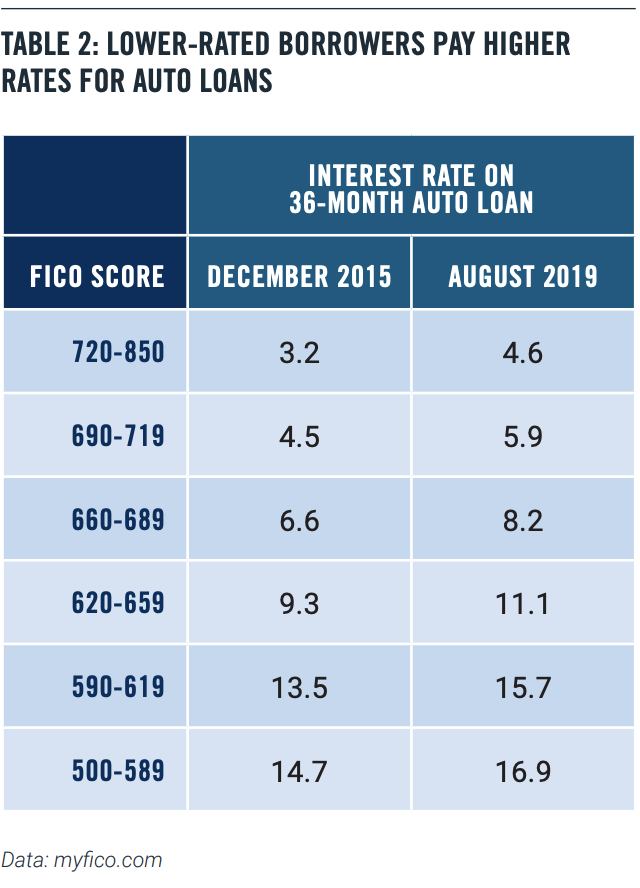
It’s not surprising that lower-rated borrowers pay more for their auto loans. Table 2 below shows interest rates for a 36-month new car loan at different credit rates for December 2015, which was close to the bottom of the credit cycle, and August 2019 (Table 2).
We can see that rates have risen for all credit-rating levels, but more so for the low-rated borrowers.
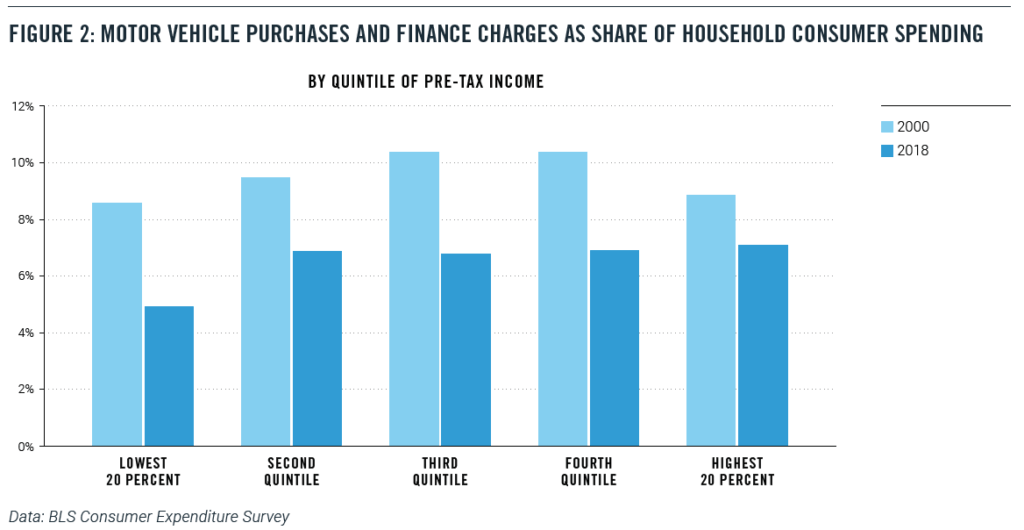
This risk-based pricing means that low-rated borrowers are not frozen out of the auto loan market. That’s good news, since, in many parts of the country, a car or truck is a necessity, even for low-income households. There is little or no public transit outside of densely populated urban areas, and ride-sharing services are not viable alternatives in many places. So, it is unsurprising that the share of low-income (the bottom quintile) households with a vehicle hold steady at 66 percent in both 2000 and 2018.
At the same time, low-income households saw motor-vehicle purchase and finance taking a smaller share of their budgets. In the bottom quintile of pre-tax income, motor vehicle purchases and finance charges fell from 8.5 percent of household budgets in 2000 to 4.9 percent in 2018 (Figure 2), a drop of almost four percentage points.15
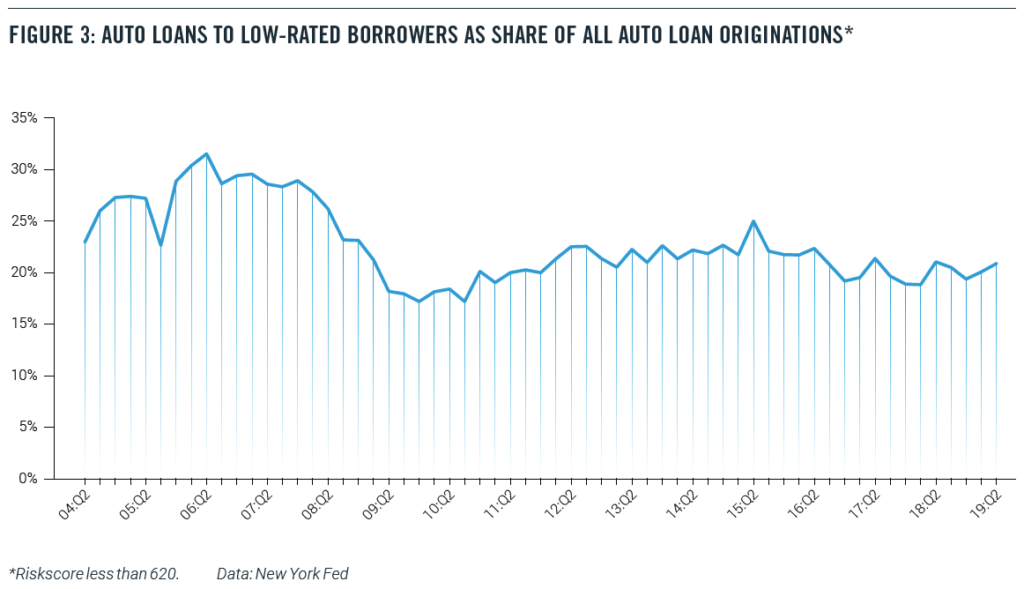
Similar data from the New York Fed’s Household Debt and Credit Report confirm that low-income households are not being uniquely stressed financially by automobile borrowing. Figure 3 shows the share of all auto loan originations that are going to low-rated borrowers (with a Riskscore of less than 620). Before the financial crisis, about 30 percent of new auto loans were going to low-rate borrowers, a startlingly high percentage. That share fell to 20 percent after the crisis and shows no signs of rising (Figure 3).16
The biggest piece of negative news has come from the New York Federal Reserve’s well-publicized finding in February 2019:
…(T)here were over 7 million Americans with auto loans that were 90 or more days delinquent at the end of 2018. That is more than a million more troubled borrowers than there had been at the end of 2010 when the overall delinquency rates were at their worst since auto loans are now more prevalent.18
This startling number, while impressive, simply doesn’t mean what it seems to suggest. This figure includes anyone who still has an old, bad auto loan on their credit record, even if the loan was made and written off years earlier.19 In fact, even after the lender writes off the loan, the loan servicer could continue to report the account to the credit bureaus.
The recent economic history of the United States helps to explain this figure. The number of nonfarm jobs did not return to pre-recession levels until 2014, while the employment-population ratio for Americans with a high school diploma but no college did not bottom out until 2015. As a result, today’s subprime borrowers are carrying around bad loans from the days when the labor market for less-educated workers was still struggling.
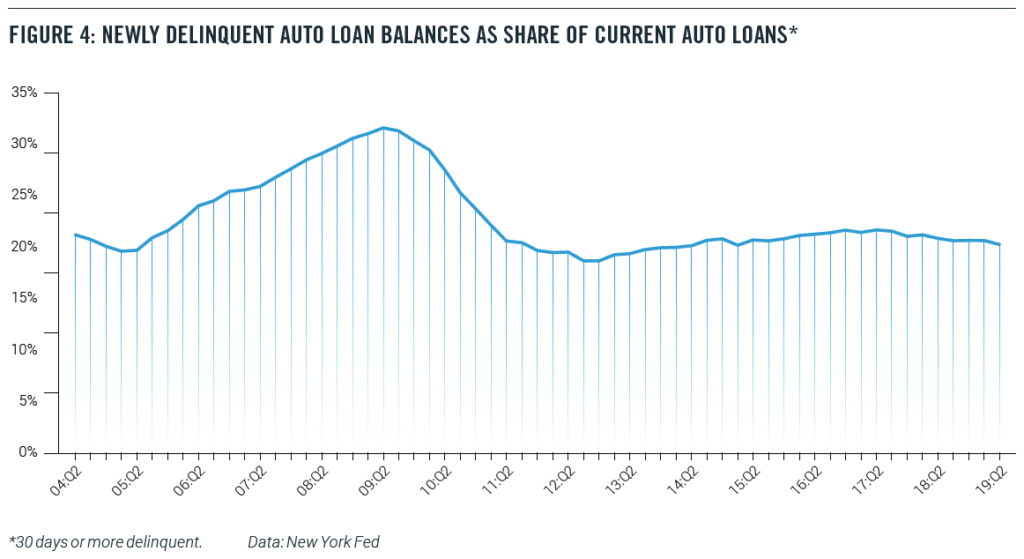
Indeed, in an August 2019 blog item, New York Fed economists recommend that anyone interested in the current performance of debt should look at the transition into delinquency- that is, a chart such as Figure 4.20 And by that measure, auto loans are doing far better than in the pre-recession years.
Conclusion
In the event of a recession or a significant economic slowdown, auto loan delinquencies will predictably rise. Subprime auto borrowers, who are more likely to have fewer resources, will be likely to fall behind in their payments when times turn bad.
Nevertheless, a careful look at the data does not suggest that either the origination of subprime auto loans or the exposure of the broader macroeconomy to the auto loan market is a cause for concern. In particular, the subprime auto-loan market looks nothing like the mortgage market before the Great Recession.
Newly delinquent auto loans, as a percentage of current balances, have been falling over the past two years, and the fact that a record number of Americans have a bad auto loan on their credit record is a testimony to economic history more than current loan practices and economic conditions, particularly given the rapid rise in total car sales during this period.
Indeed, risk-based pricing in the auto loan market appears to be supplying a steady flow of credit to low-rated borrowers without imposing excess stress on the financial system.
About the Authors
Michael Mandel is Chief Economic Strategist of the Progressive Policy Institute.
Douglas Holtz-Eakin is President of the American Action Forum.
Thomas Wade is Director of Financial Services Policy of the American Action Forum.
With partisan divisions as deep as ever, both sides can agree on one thing: Everybody wants to avoid another financial crisis. And forecasters have recently identified subprime auto loans as an existential threat to the economy.
Worries about subprime auto loans — which offer higher interest loans to riskier borrowers — are ill-founded and based on misleading data and faulty analogies, our new research finds.
It’s official: the Trump administration spent $1 trillion more in 2019 than it raised in revenue. That deficit is 50% larger than the deficit in 2017, which was President Trump’s first year in office, and represents the first calendar-year deficit to top $1 trillion since 2012. Annual deficits will only grow worse in the coming decade, in large part thanks to the $2 trillion tax cut Trump signed into law in 2017 and a similarly-sized tax and spending deal he signed at the end of last year (over a quarter of which was added to the national debt).
With trillion-dollar annual deficits stretching into the future indefinitely, will Democrats address this generational challenge in their Presidential debate? There sure is an appetite for it: when I had the privilege of speaking with students at the New England College Convention in New Hampshire last week, they expressed deep concern about the rising national debt they’re poised to inherit and how the Democratic candidates would pay for their proposals.
Unfortunately, these issues haven’t been raised in any of the more than 500 questions asked throughout the last six presidential debates. The seventh debate on Tuesday night presents one last opportunity to change this dynamic before the Iowa Caucus.
Here is how tonight’s Democratic debate should begin:
The American economy has always been driven by entrepreneurial energy — the creation and growth of new businesses. Today, however, entrepreneurship in the United States is in trouble. Business creation has stalled; overall economic dynamism is faltering. We are experiencing what some researchers call a “startup deficit.”
How would your administration address this?
Most of the seven debate participants would be speechless, at least momentarily, before quickly running through a litany of actions they would take — some of which are tangential to entrepreneurship. A few of them would talk about the virtues of small business before bashing the evils of big business. A few might actually say the word “entrepreneurship.” At least a couple of them would be able to talk coherently about how they would tackle the startup deficit.
In all likelihood, of course, this question won’t be asked and entrepreneurship will barely be mentioned. More attention will be paid to the labor issues that almost derailed the debate. Yes: unions and the minimum wage should be topics of discussion. But, without the businesses to employ union workers and pay higher wages, those issues are moot.
The federal government is ending 2019 with a national debt of over $17 trillion for the first time in U.S. history – and if one includes intragovernmental debt, such as that held by the Social Security trust funds, this figure rises to $23 trillion. Beginning in 2020, the government is projected to add more than $1 trillion to the debt every year in perpetuity. Amid this rising tide of red ink, is anyone willing to fight for fiscal responsibility?
Certainly not President Donald Trump. Since taking office three years ago, Trump earned his crown as the self-proclaimed king of debt by signing into law a $2 trillion tax cut and shattering spending caps created under President Obama. Congressional Republicans – the same folks who demanded these caps be imposed in the first place – had no qualms about charging these costs to the national credit card. After eight years of lambasting deficits under President Obama, most Republican deficit hawks have revealed themselves to be nothing more than peacocks.
Thankfully, there is some leadership on the other side of the aisle. When Democrats retook control of the U.S. House of Representatives earlier this year, Speaker Nancy Pelosi reinstated pay-as-you-go (PAYGO) rules requiring legislation that cuts taxes or increases automatic spending to be fully offset. Although not all of her caucus supports PAYGO, the moderate House Blue Dog Coalition – which spearheaded the push to bring back the rule after it was repealed by Republicans in 2011 – has rebuffed efforts to waive PAYGO, sending a clear signal that at least some Democrats oppose digging the nation’s fiscal hole deeper.
Congress must pass a comprehensive funding bill by the end of next week to avoid a repeat of last year’s government shutdown. Such a must-pass bill at the end of the year often becomes a “Christmas tree” decorated with various policy riders and pet projects for members of both parties in Congress. But under this year’s tree, a fiscally irresponsible Santa Claus Congress might leave wealthy Americans three gifts that together could cost up to $1 trillion over the next ten years – all put on the nation’s credit card for young Americans to pay off for generations to come.
Despite all his bluster, the “Trump Trade Deficit” widened to a new record in the third quarter of 2019. The non-oil merchandise trade deficit hit $1.047 trillion in the third quarter of 2019, in 2012 dollars (annual rate). That’s according to PPI calculations based on new data released by the Bureau of Economic Analysis on November 27. The latest trade deficit beat the previous record set in the fourth quarter of 2018, also under Trump.
These widening trade deficits claw right at the heart of the middle of the country, where farmers and factory workers are suffering under Trump’s misguided policies. Factory closings just keep coming: Sparta, Wisconsin; Atlanta, Ga; West Plains, Missouri.
Trump’s trade failures give progressive presidential candidates an opportunity to run a pro-manufacturing, pro-growth campaign. They should be advocating policies that jumpstart a new generation of manufacturing entrepreneurs across the country. They should support local distributed manufacturing, which both creates jobs and helps the environment. Most of all, progressives should come out squarely in favor of a Production Economy that supports America’s core values as a producer rather than a consumer.
This is the second in our series of posts on “The Next Ten Million Jobs,” the types of jobs being created between now and 2030, based on the latest BLS employment projections. In our first post we looked at the importance of healthcare and social assistance jobs for driving employment growth between now and 2030. In this post we consider the future of retail, ecommerce and related jobs. More particularly, is there a coming “retail apocalypse”? And can we expect a big loss of jobs in the “consumer distribution sector”–wholesale, retail, trucking, couriers and messengers, and warehousing?
The short answer: Not according to the Bureau of Labor Statistics. Based on our extension of the BLS projections, the number of jobs in retail drop by 1.2% between now and 2030, a net loss of 184K jobs. Wholesale jobs are anticipated to drop as well, by 118K between now and 2030.
On the other hand, our extension of the BLS projections show a gain of 294K in the total of warehousing (fulfillment centers), couriers and messengers (local delivery) and trucking. These projected job gains, focused on ecommerce, compensate almost completely for the projected job declines in retail and wholesale. The net projected change for the “consumer distribution” sector between now and 2030? -8K job, practically nothing. So while consumer distribution is not a big contribution to the next ten million jobs, it’s not a big drag either.
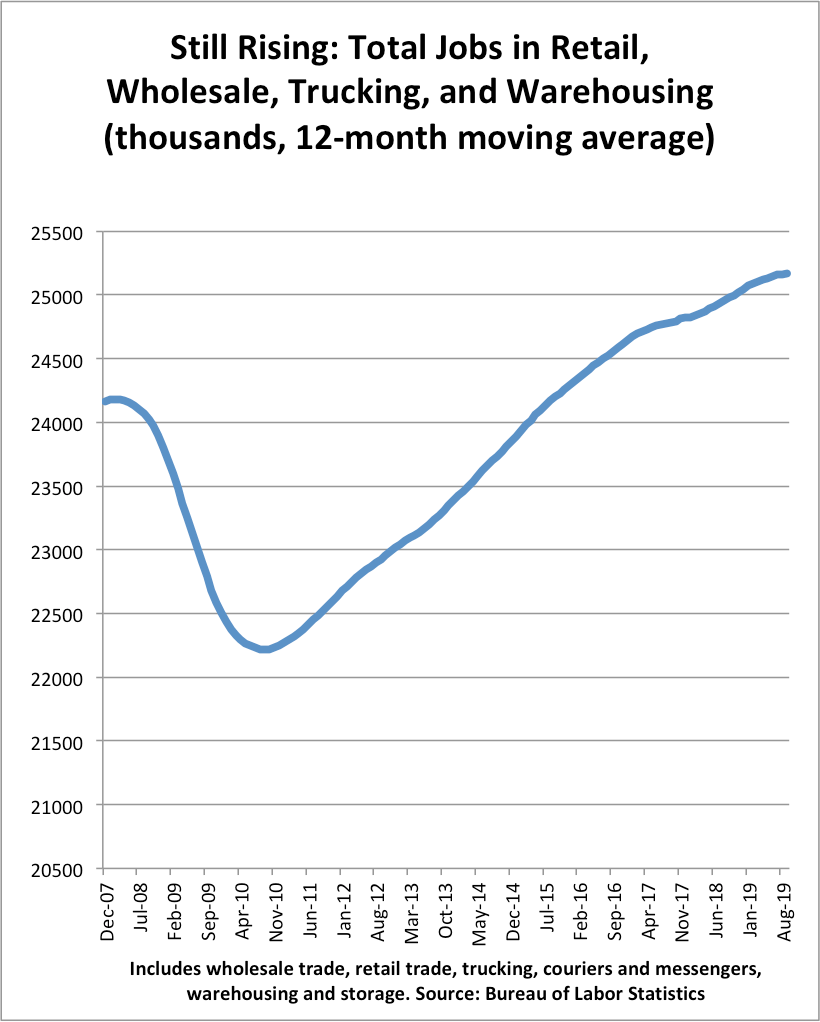
It’s worth noting that these projections are somewhat more pessimistic than recent reality. Based on 12-month moving averages, retail employment fell by 40K over the past year. But employment in wholesale, trucking, couriers and messengers, and warehousing rose by 234K, for a net gain of 195K consumer distribution jobs over the past year (on a 12-month moving average basis).
That’s extraordinary. Despite all the claims of job loss, the consumer distribution sector–including retail and ecommerce–is still one of the largest job creators in the economy.
Take a look at the chart below, which shows the 12-month moving average for employment in consumer distribution.
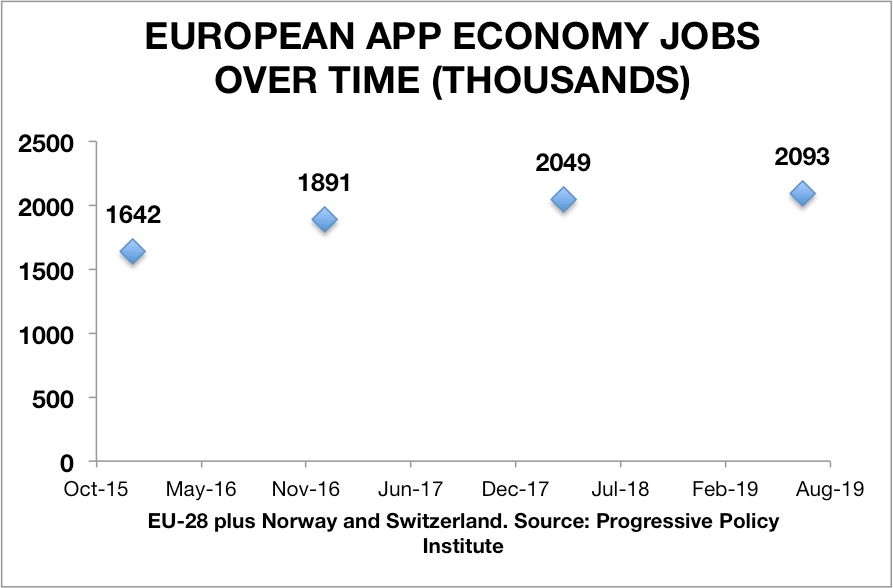
In this note we update our previous estimates of European App Economy jobs. Our latest research estimates that the EU-28 countries (plus Norway and Switzerland) have 2.093 million App Economy jobs as of July 2019. That’s up 27% from the 1.642 million jobs that we estimated for January 2016 in our first European App Economy jobs report (released June 2016). We follow the methodology described in the appendix to our 2017 European App Economy report. For a summary description of the basic approach, see the recent update on U.S. App Economy jobs.
We also estimate European App Economy jobs by mobile operating system. As of July 2019, there were 1.584 million jobs in the European iOS ecosystem and 1.693 million jobs in the European Android ecosystem. (The iOS and Android numbers add up to more than the total, because many App Economy jobs belong to both ecosystems).
European App Economy Jobs by Operating System (July 2019)*
(thousands)
Total app economy
2093
iOS ecosystem
1584
Android ecosystem
1693
*30 country total. Includes estimates for Norway and Switzerland
Data: ILO, PPI, Indeed
Our approach allows us to estimate European App Economy jobs by country and leading cities. The top country for App Economy jobs is the United Kingdom, followed by France, Germany, the Netherlands, Spain and Sweden. The UK is the leader in iOS ecosystem jobs, with France closely followed by Germany. France and the UK are tied for the lead in Android ecosystem jobs.
European App Economy Jobs by Country (July 2019)
(thousands)
Total app economy jobs
iOS ecosystem jobs
Android ecosystem jobs
Austria
25
19
21
Belgium
29
22
23
Czech
42
29
30
Denmark
52
41
37
Finland
48
37
42
France
350
236
296
Germany
296
233
239
Greece
10
6
8
Hungary
25
17
20
Ireland
20
16
12
Italy
94
70
77
Luxembourg
4
2
3
Netherlands
212
171
163
Norway
43
36
37
Poland
78
53
60
Portugal
37
28
27
Romania
24
19
21
Spain
101
77
82
Sweden
98
72
84
Switzerland
34
25
31
United Kingdom
366
295
296
30-country total*
2093
1584
1693
*Includes estimates for Bulgaria, Croatia, Cyprus, Estonia, Latvia, Lithuania, Malta, Slovakia, and Slovenia.
Data: ILO, Indeed, PPI
The top European city for App Economy jobs according to our research is London, followed by Paris, Amsterdam, Stockholm, and Berlin. Germany has a remarkable six cities in the top 30 and the Netherlands has four cities in the top 30. Noticeably missing from the top 30 list is Rome.
European App Economy Jobs by Major City (July 2019)
(Thousands)
Total app economy
iOS ecosystem
Android ecosystem
1
London
175
141
141
2
Paris
169
114
143
3
Amsterdam
84
68
64
4
Stockholm
56
41
47
5
Berlin
54
43
44
6
Rotterdam*
45
36
34
7
Barcelona
42
32
34
8
Helsinki
36
28
32
9
Copenhagen
34
27
25
10
Eindhoven
34
27
26
11
Madrid
33
25
27
12
Milan
30
23
25
13
Munich
30
23
24
14
Manchester
26
21
21
15
Utrecht
25
21
20
16
Oslo
25
21
22
17
Prague
25
17
18
18
Warsaw
22
15
17
19
Frankfurt
22
17
17
20
Stuttgart
21
17
17
21
Lisbon
21
15
15
22
Brussels
20
15
16
23
Cologne**
20
16
16
24
Budapest
20
13
15
25
Lyons
19
13
16
26
Hamburg
18
14
15
27
Zurich
18
13
16
28
Birmingham
16
13
13
29
Krakow
15
10
12
30
Dublin
14
11
9
*Radius around Rotterdam is only 45 kilometers to avoid overlap with Amsterdam.
**Includes Dusseldorf.
Urban areas are defined as 50 kilometers or 30 miles around a center city. We did not have data for urban areas in Bulgaria, Croatia, Cyprus, Estonia, Latvia, Lithuania, Malta, Slovakia, and Slovenia.
Source: Progressive Policy Institute
We also looked at change in App Economy jobs by country over time. To reduce the effect of statistical noise, we compared the average of the 2016 and 2017 estimates with the average of the 2018 and 2019 estimates. We note that the only countries with declining App Economy jobs are Italy and Poland. The United Kingdom’s 5% increase is surprisingly small, and perhaps reflects the impact of Brexit. By contrast, Ireland’s App Economy employment rose by 24%.
Change in App Economy Jobs by Country, 2016-17 to 2018-19
(thousands)
2016-17*
2018-19**
percentage change
Austria
20
32
64%
Belgium
24
28
14%
Czech Republic
29
35
19%
Denmark
40
50
26%
Finland
51
51
1%
France
244
287
17%
Germany
289
319
10%
Greece
7
8
11%
Hungary
17
19
14%
Ireland
14
18
24%
Italy
99
92
-7%
Luxembourg
2
3
31%
Netherlands
155
193
25%
Norway
46
51
11%
Poland
68
63
-7%
Portugal
29
34
15%
Romania
21
25
18%
Spain
82
92
12%
Sweden
82
95
16%
Switzerland
32
34
7%
United Kingdom
326
342
5%
*Average of 2016 and 2017 estimates. **Average of 2018 and 2019 estimates. Source: Progressive Policy Institute
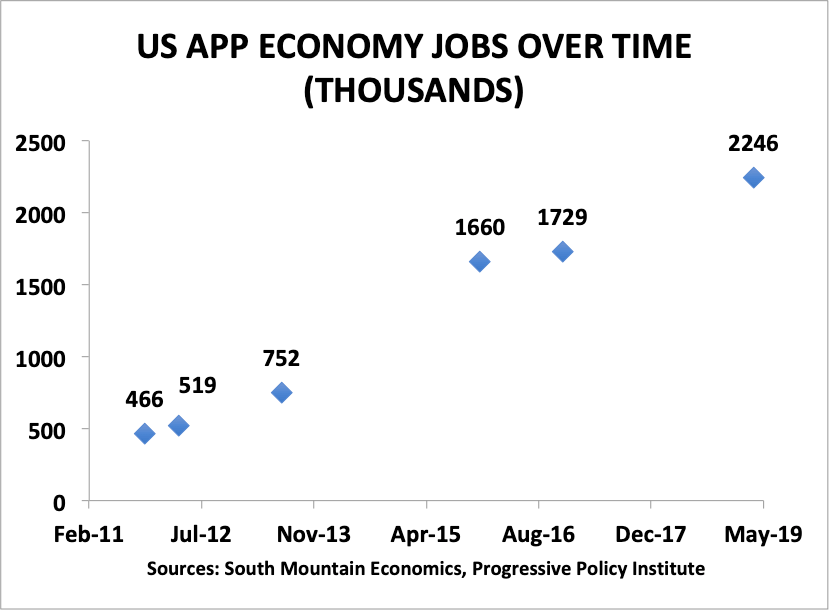
In this note we update our previous estimates of U.S. App Economy jobs. Our latest research estimates that the U.S. has 2.246 million App Economy jobs as of April 2019. That’s up 30% from 1.729 million that we estimated for December 2016 in our previous report (released May 2017).
That figure translates into a 12% annualized growth rate for App Economy jobs, compared to a 6.7% annual growth rate for computer and mathematical jobs over the past 3 years, and a 1.8% annual growth rate for all nonfarm private sector jobs.
Since fall 2011, we have done a total of six App Economy job estimates for the United States. The chart below lays out our published U.S. App Economy job estimates, starting with the first one in fall 2011 (released February 2012). These numbers include a conservative estimate of indirect and spillover jobs.
We also estimate U.S. App Economy jobs by mobile operating system. As of April 2019, there were 1.853 million jobs in the iOS ecosystem and 1.736 million jobs in the Android ecosystem. (The iOS and Android numbers add up to more than the total, because many App Economy jobs belong to both ecosystems).
U.S. App Economy Jobs by Operating System, April 2019
millions of App Economy jobs
All App Economy Jobs
2.246
iOS ecosystem
1.853
Android ecosystem
1.736
Data: PPI, Indeed.com
Summary Methodology
The methodology for generating these estimates is described in the appendix to the May 2017 US App Economy report. Since then, we’ve made some small technical adjustments to make the U.S. methodology consistent with our global methodology.
For this research, a worker is in the App Economy if he or she works in:
An information and communications technology (ICT) related job that uses App Economy skills— the ability to develop, maintain, or support mobile applications. We will call this a “core” App Economy job. Core App Economy jobs include app developers; software engineers whose work requires knowledge of mobile applications; security engineers who help keep mobile apps safe from being hacked; and help desk workers who support use of mobile apps.
A non-ICT job (such as human resources, marketing, or sales) that supports core App Economy jobs in the same enterprise. We will call this an “indirect” App Economy job.
A job in the local economy that is supported by the income flowing to core and indirect App Economy workers. These “spillover” jobs include local retail and restaurant jobs, construction jobs, and all the other necessary services.
To estimate the number of core App Economy jobs, we use a multi-step procedure based on data from the universe of online job postings, and described in detail in the methodology appendix of the May 2017 report. The source of the data is Indeed.com, which calls itself “the #1 job site in the world.” Indeed’s API allows us to use Boolean search to identify App economy-related job postings.
Job postings are a powerful source of information about the skills being required by employers. For example, if a job posting requires that the job candidate have experience developing apps for iOS—the iPhone/iPad operating system—then we can reasonably conclude that the posting refers to a core App Economy job.
However, the number of job postings does not immediately translate into employment levels. The process for estimating the relationship between jobs postings and employment was initially described in a series of papers starting in 2012, when we produced the first-ever estimate of the U.S. App Economy. [i] We use an improved version of that methodology here, including a conservative set of multipliers relating indirect and spillover jobs to core App Economy jobs.[ii]
Future blog items will discuss App Economy jobs by state and by city.
[i] Michael Mandel. 2012. “Where the Jobs Are: The App Economy,” South Mountain Economics/Technet.
Michael Mandel and Judith Scherer. 2012. “The Geography of the App Economy,” South Mountain Economics/CTIA.
Michael Mandel and Judith Scherer. 2015. “A Low-Cost and Flexible Approach for Tracking Jobs and Economic Activity Related to Innovative Technologies,“ South Mountain Economics/Nesta.
[ii] We assume that companies have one indirect job for every core app economy job. We then assume there are 0.5 spillover jobs for every core or indirect job. This low number is consistent with the latest research on local job multipliers. See, for example. Timothy J. Bartik and Nathan Sotherland. 2019. “Realistic Local Job Multipliers.” Policy Brief, W.E. Upjohn Institute for Employment Research. https://doi.org/10.17848/pb2019-8.
The Canadian App Economy is strong both in terms of app exports and compared to its industrialized peers. The Canadian App Economy has 262,000 App Economy workers as of November 2018, according to a recently released report by the Progressive Policy Institute (PPI). App Economy workers are those that develop, maintain, or support mobile applications. What’s more, Canada is outperforming many of its industrialized peers.
Cigarette smoking by Americans declined steadily from the mid-1960s to around 2005, when this progress began to slow. From 2013 to 2017, however, cigarette smoking rates fell sharply, during a period in which the use of electronic cigarettes or e-cigarettes increased sharply. This study examines the connection between these two developments and the implications.
Among adults, cigarette smoking rates fell from 18.0% in 2013 to 14.0% in 2017, while the use of e-cigarettes increased from 1.9% to 2.8%.
Over the same years, cigarette smoking rates among high school students fell from 12.7% to 7.6% while their rates of e-cigarette use increased from 4.5% to 11.7%. Among adolescents, the association between declining smoking rates and rising e-cigarette use was even stronger than among adults.
Statistical analysis of the changes in smoking rates and e-cigarette use by age, gender, race and ethnicity suggests that about 70 percent of the increased decline in cigarette smoking from 2013 to 2017 was associated with the rising use of e-cigarettes. The remaining 30 percent was associated with higher cigarette taxes, bans on cigarette sales by the CVS pharmacy chain, and increased use of anti-smoking prescription drugs.
Statistical analysis also strongly suggests that e-cigarettes are not a gateway to smoking cigarettes.
Rather, statistical analysis and numerous studies establish that e-cigarettes are an effective tool to help people stop smoking or avoid starting to smoke cigarettes.
Based on these analyses, we estimate that pre-existing trends and factors other than e-cigarettes can explain a decline in smoking rates by people ages 18 to 44 from 20.2% in 2014 to 17.9% in 2017. However, the rate fell from 20.2% to 14.6% in 2017, and the rising use of e-cigarettes can explain the additional 3.3 percentage-point decline in cigarette smoking rates.
By this account, e-cigarette use is closely linked to a reduction in cigarette smoking from 2014 to 2017 by 922,301 people ages 18 to 24 and 2,922,540 people users ages 25 to 44, or a total of 3,844,840 people.
We also calculated the healthcare savings and costs and the productivity benefits associated with the reductions in cigarette smoking and the increased use of e-cigarettes from 2014 to 2017 by those 3,844,840 people ages 18 to 44. These calculations are based on healthcare costs, life expectancy, and the differences in the incidence of illnesses that interfere with work for smokers, ex-smokers, nonsmokers and e-cigarette users.
E-cigarette use lowers people’s annual per capita healthcare costs, compared to cigarette smokers and ex-smokers, for all age groups up to age 75.
For people ages 25 to 44, the annual per capita healthcare costs of cigarette smokers are 9.8 percent greater than those of e-cigarette users, and the average annual per capita healthcare costs for ex-smokers are 19.8 percent greater than for e-cigarette users.
For people ages 45 to 64, annual per capita healthcare spending for cigarette smokers is 8.8 percent greater than for e-cigarette users, and average per capita healthcare costs for ex-smokers are 34.4 percent greater than for e-cigarette users.
Treating cigarette-smoking-related diseases accounts for an estimated 8.7 percent of annual healthcare spending, or $303.8 billion in 2017.
By reducing the number of people who smoke cigarettes, e-cigarette use also extends the lifespans of millions of people, raising their lifetime medical costs across all age groups except those 18 to 24.
We calculate that the use of e-cigarettes by the 922,301 people ages 18 to 24 in 2017, who otherwise would have started smoking cigarettes, should reduce their lifetime healthcare costs by $11.3 billion.
However, the use of e-cigarettes by the 2,922,540 people ages 25 to 44 in 2017,
who otherwise would have started smoking cigarettes, increases their lifetime healthcare costs by $284.5 billion.
Those higher lifetime healthcare costs reflect spending for 330,489 people whom we would expect to have died before their mid-to-late 60s if they started smoking cigarettes in 2014- 2017, and for 500,865 people whom we would expect to have died before their mid-to-late 80s if they had started smoking instead of using e-cigarettes.
E-cigarette users (and nonsmokers) also are more productive than smokers, because smokers miss more work due to illness, come to work still impaired by illness more often, and take smoking breaks. We found that e-cigarette users are on average $820 more productive per-year than ex-cigarette smokers and $2,371 more productive per-year than current smokers, and that ex-smokers who shifted to e-cigarettes are on average $1,554 more productive per-year than current smokers.
The additional productivity of the share of the 922,301 e-cigarette users ages 18 to 24 in 2017 who worked from 2017 on, and who otherwise would have become smokers in 2014-2017, would be worth $14.7 billion over the 10 years from 2017 to 2027;
The additional productivity of the share of the 2,922,540 e-cigarette users ages 25 to 44 in 2017 who worked from 2017 on, and who otherwise would have continued to smoke in 2014-2017, would be worth $29.2 billion over the years from 2017 to 2027.
PPI’s Progressive Budget for Equitable Growth gives the next administration a framework for investing in our country that doesn’t stick young Americans with the bill. It powers the engines of American innovation by increasing investments in infrastructure, education, and scientific research by more than 70 percent relative to what they would be under current law. We tackle the greatest challenges facing our society, from rising economic inequality to climate change, through dynamic tax and spending policies that also help smooth the business cycle. And we pay for all of it, giving future policymakers the fiscal space necessary to respond to other unforeseen challenges and demonstrating that fiscal responsibility and investing in the American people are not contradictory – they are in fact complementary. By supporting both equity and growth, our blueprint would once again make fiscal policy an instrument of national progress.
WASHINGTON—The Progressive Policy Institute and House Blue Dog Coalition will host a lunchtime discussion today at the Longworth House Office Building about what leaders in Congress can do to invest in equitable growth while reducing our national debt.
America suffers from a shortsighted fiscal policy that promotes consumption today instead of investing in tomorrow. The federal government now spends more to service our growing national debt than it does on public investments in education, infrastructure, and scientific research combined. Meanwhile, a perfect storm of fiscally irresponsible tax cuts and an unwillingness to tackle escalating health and retirement spending are feeding trillion-dollar deficits as far as the eye can see. This is not a fiscal policy for strengthening America’s future – it’s blueprint for American decline.
At the event, PPI will release a comprehensive budget plan with over 50 policy recommendations for the next administration to make room for public investments in education, and infrastructure, and scientific research; modernize federal health and retirement programs to reflect an aging society; and create a progressive, pro-growth tax code that raises the revenue necessary to pay the nation’s bills.
Lunch will be provided. This event is open to the press.
Who:
Rep Stephanie Murphy (D-FL), Co-Chair of the House Blue Dog Coalition
Rep. Ed Case (D-HI), Co-Chair of the Blue Dog Task Force on Fiscal Responsibility and Government Reform
Rep. Ben McAdams (D-UT), Co-Chair of the Blue Dog Task Force on Fiscal Responsibility and Government Reform
Ben Ritz, Director of PPI’s Center for Funding America’s Future
Marc Goldwein, Senior Vice President at the Committee for a Responsible Federal Budget
Emily Holubowich, Executive Director of the Coalition for Health Funding and Co-Founder of NDD United
Will Marshall, President of PPI, Moderator
When: Thursday, July 25, 2019
12:00 PM – 1:30 PM
Where: Longworth House Office Building, Room 1302
15 Independence Ave, SE
Washington, D.C. 20515
For press inquires, please contact Carter Christensen, media@ppionline.org or 202-525-3931.
The budget deal scheduled for a vote tomorrow gets two things right and nearly everything else wrong. The main thing it gets right is the need to unshackle domestic public investment that would be subject to an across-the-board cut known as “sequestration” in the absence of legislative action. It also suspends the federal debt limit for two years, which will allow the Treasury Department to continue paying the bills America has already incurred without risking the prospect of a catastrophic default on our debts. What it gets wrong is charging $320 billion in new spending to our national credit card, which will further grow those debts and so perpetuate Washington’s governing dysfunction.