In light of the FTC confirmation hearings tomorrow, we’ve been thinking about competition policy. We would like to propose a different approach to competition policy, one that goes far beyond Chicago-style antitrust analysis.
There’s little doubt that recent research has conclusively demonstrated increased concentration across almost every sector of the US economy over the past thirty years. Using data from 1982 to 2012, MIT economist David Autor and a group of distinguished colleagues (2017) find a “remarkably upward consistent trend in concentration” across manufacturing, finance, retail trade, wholesale trade, utilities and transportation, and services. Furman (2016) noted that evidence for rising concentration has been found in such diverse industries as agriculture and hospitals. Somewhat less pessimistically, White and Yang (2017) notes there has been a “moderate but continued increase in aggregate concentration since the mid 1990s.“
Researchers have linked this rise in concentration to declining economic performance across a wide variety of measures. A 2016 report from the Council of Economic Advisers (2016) argued that “monopolists may be less rigorous in pursuing efficient cost reductions” implying that concentration may lead to weaker productivity growth. Loeckery and Eeckhout (2017) find a rise in average markups from 18% above marginal cost in 1980 to 67% today. That’s consistent with the idea that concentration leads to higher prices, as theory suggests.
Economists have also looked for evidence that concentration has helped hold down wages. Autor et al (2017) link the increase in concentration to a fall in the share of labor. Azar, Marinescu, and Steinbaum (2017) argue that an increase in employer concentration on the local level reduces pay levels significantly.
So the question is: What should the government do about increased concentration across a wide range of industries? Like a bulldozer, competition policy is a powerful tool. It can be used to reduce market power and clear a way for innovation and growth. Or it can be used to turn beneficial industries into rubble.
Before applying the bulldozer of competition policy, we need to have a systematic framework for identifying which industries are most harmful to workers, consumers, and growth. To that end, we propose that antitrust regulators assess the performance of industries across a wide range of measures. Potential measures we’ve been analyzing include:
- Job growth of college-educated workers
- Job growth of non-college-educated workers
- Change in the share of industry income going to labor
- Change in prices charged (adjusted for productivity growth)
- Multifactor productivity growth
A pro-worker, pro-consumer, pro-growth competition policy would focus on industries that fare poorly on these measures.
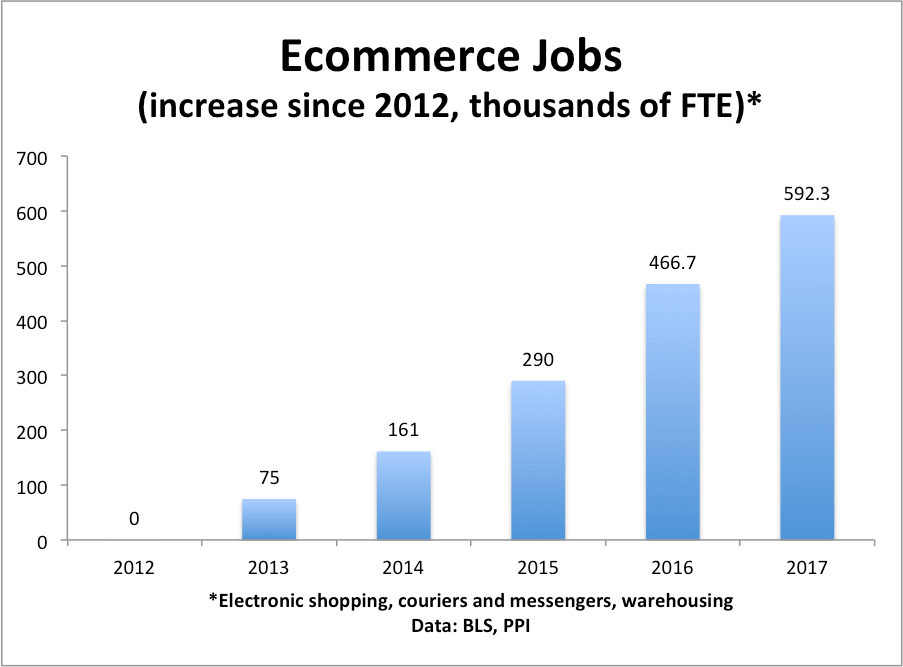
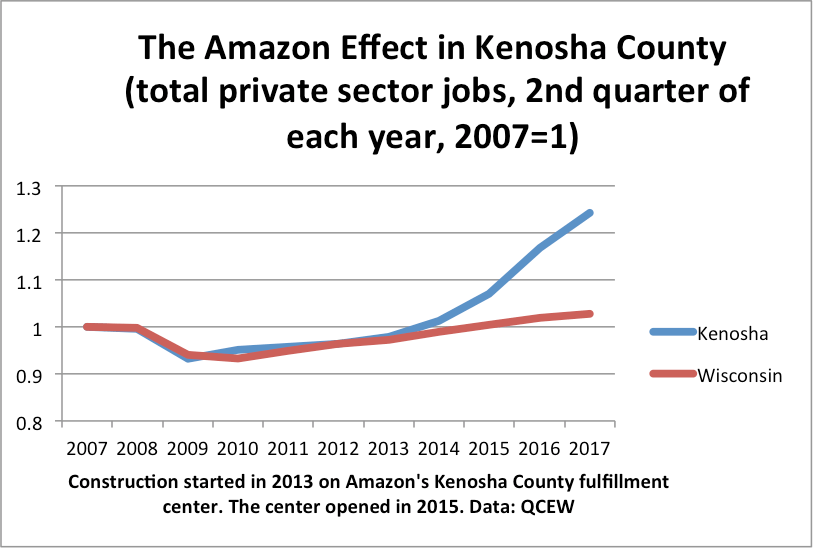
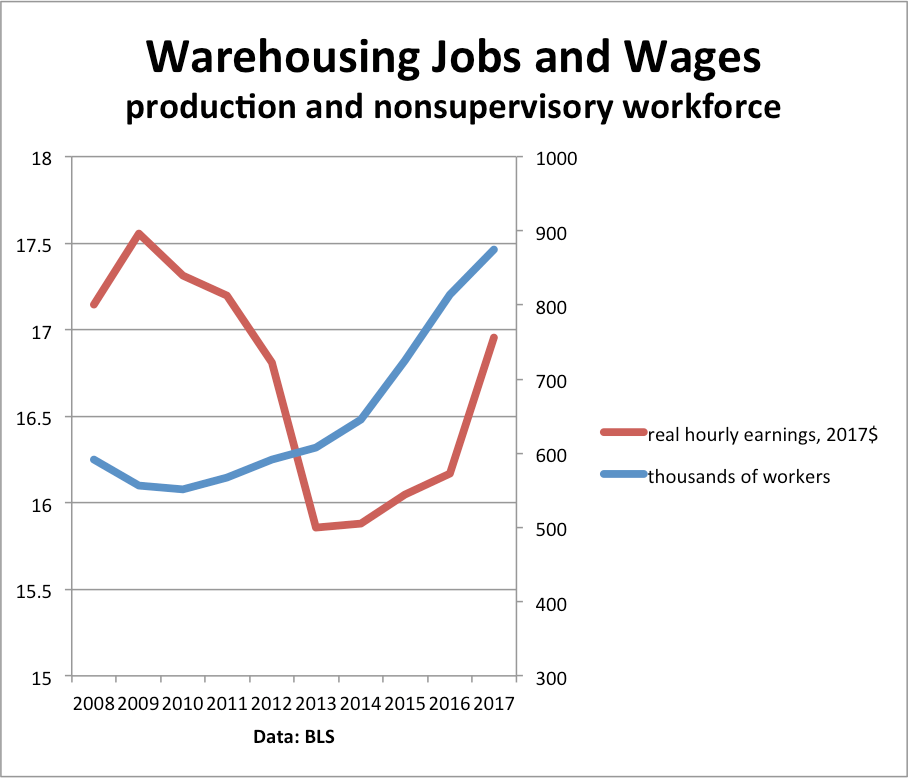
In our initial analysis, legal services, air transportation, paper products, and the securities industry fare poorly on these measures. Conversely, warehousing and storage does well on these measures, reflecting the rapid growth of ecommerce jobs for workers without a college education, as does the industry that includes data processing, internet publishing, and other information services.
This analysis is far from complete. We are still considering the appropriate measures and how to weight them. But we think worker-oriented measures such as job growth and change in the labor share, consumer-oriented measures such as price changes, and growth-oriented measures as productivity growth, should be important considerations for competition regulators. We need a consistent and systematic framework for applying competition policy.
References
David Autor, David Dorn, Lawrence F. Katz, Christina Patterson and John Van Reenen. “Concentrating on the Fall of the Labor Share,” American Economic Review: Papers & Proceedings 2017, 107(5): 180–185.
José Azar, Ioana Marinescu, and Marshall Steinbaum. “Labor Market Concentration,” December 2017.
Council of Economic Advisers. “Benefits Of Competition And Indicators Of Market Power,” May 2016.
Jason Furman. “Beyond Antitrust: The Role of Competition Policy in Promoting Inclusive Growth,” Searle Center Conference on Antitrust Economics and Competition Policy, September 16, 2016.
Jan De Loeckery and Jan Eeckhout, “The Rise of Market Power and the Macroeconomic Implications,” August 24, 2017.
Lawrence White and Jasper Yang, “What Has Been Happening to Aggregate Concentration in the U.S. Economy in the 21st Century?”, New York University, draft, March 2017.


 The delusion starts with a proposal for discretionary spending levels far below those in
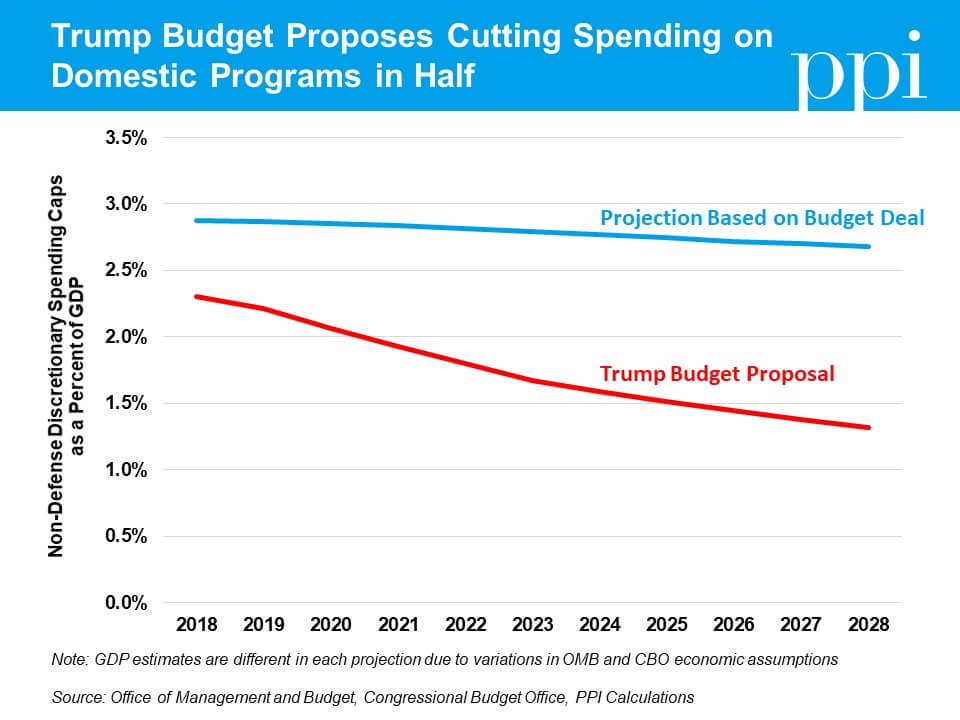
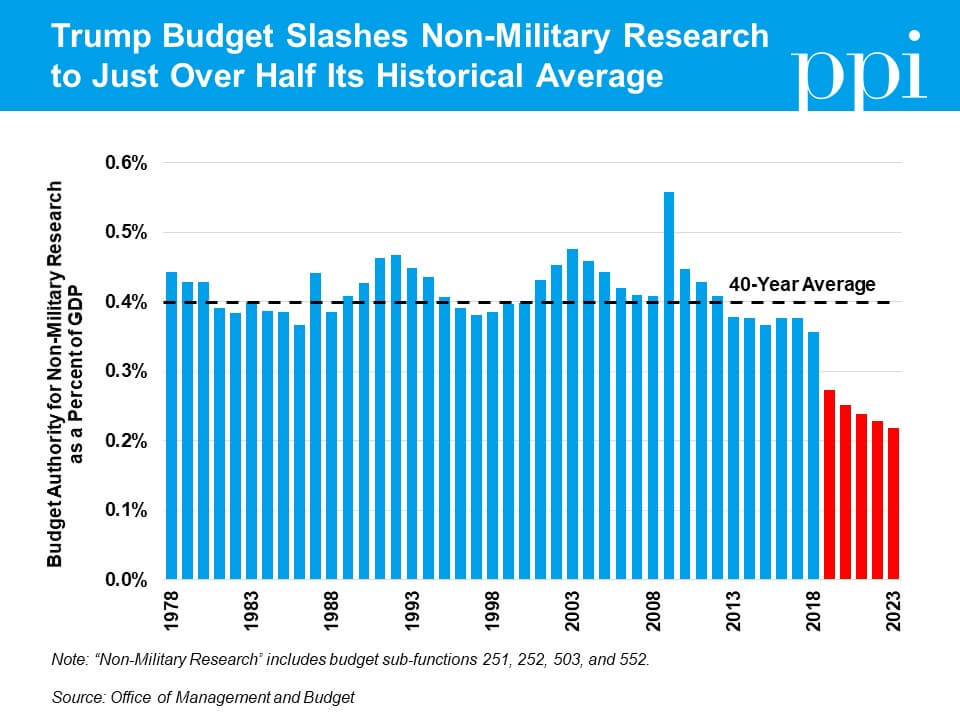 The next chart depicts the Trump budget’s steep cuts to these investments, slashing the share of spending for non-military research to just over half its historical average by 2023.
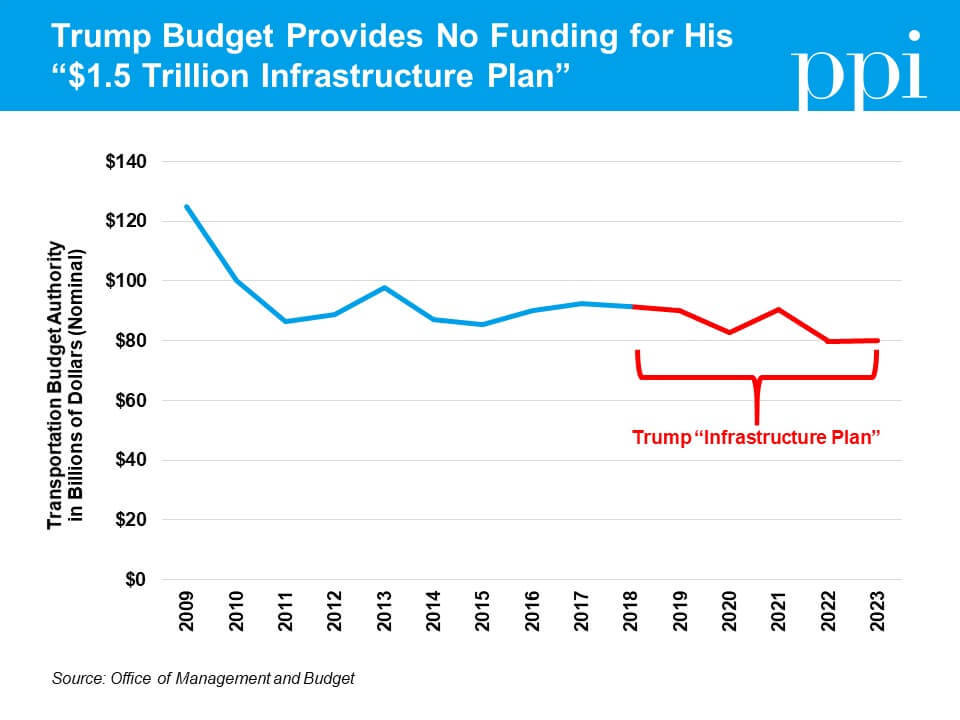 Cuts to existing infrastructure programs.
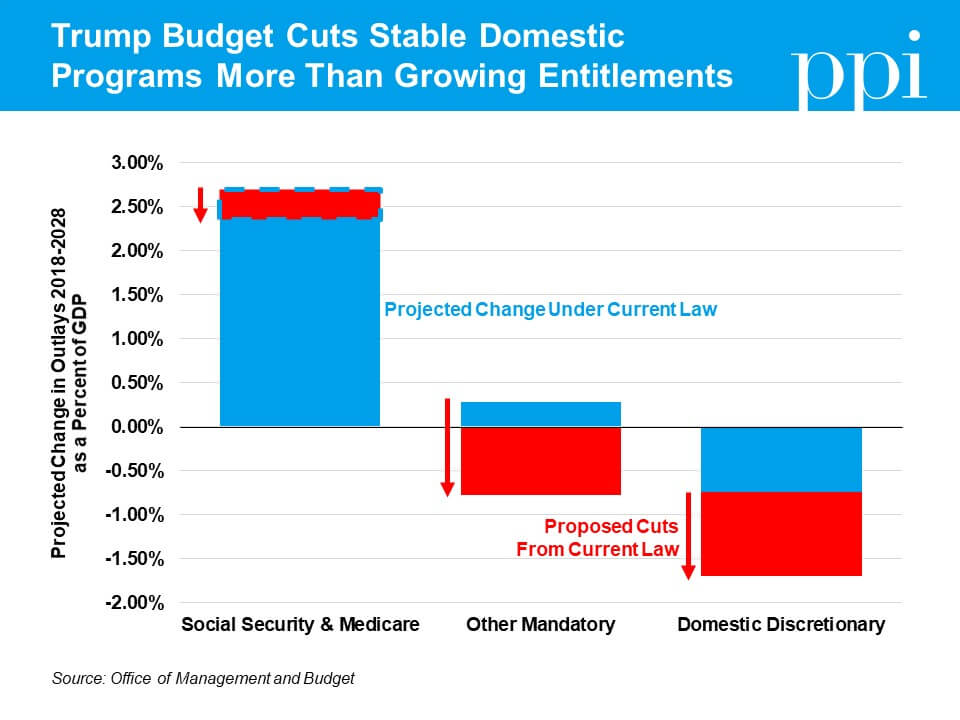
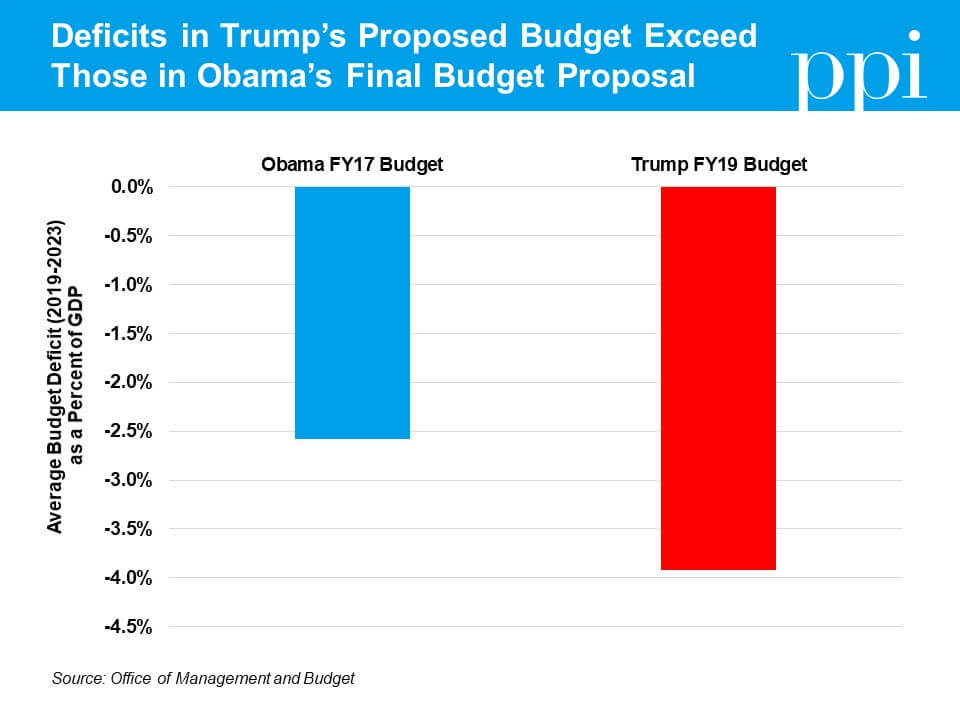 The result is that Trump’s latest budget, in his own OMB’s assessment, leads to significantly larger budget deficits over the next five years than those proposed in President Obama’s final budget over the same period (2019-2023).
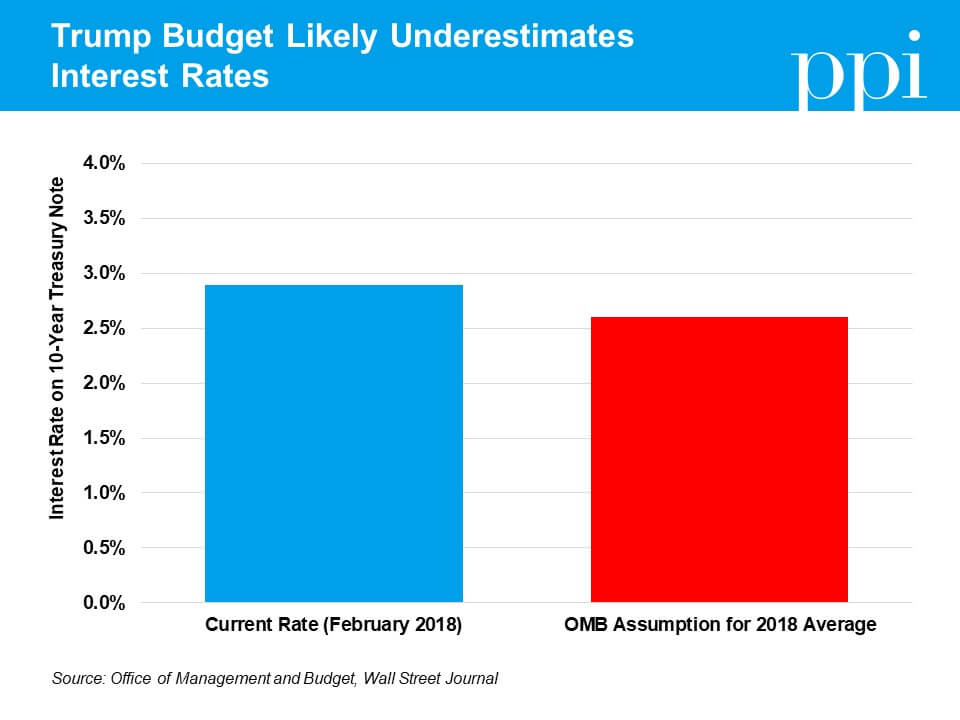 OMB also understates the impact of deficits under the Trump budget proposal with its interest rate projections. OMB estimates the average interest rate on a 10-year Treasury Note in 2018 will be 2.6 percent. But
 It would be one thing if this budget deal merely repealed the sequester, which was never meant to take effect and has hamstrung important investments in both defense and domestic initiatives. The Senate budget deal, however, would raise spending above the original levels agreed to by both parties in the Budget Control Act of 2011. It would also cut taxes for corporations by an additional $17 billion and repeal important cost-control measures imposed by the Affordable Care Act – all without paying for them.