Comparing Today’s Tech/Telecom Employment with Yesterday’s Industrial Employment

We’re grateful to have our new report mentioned in Neil Irwin’s piece today in the New York Times about tech employment. The report, An Analysis of Job and Wage Growth in the Tech/Telecom Sector,  to be presented at the TPRC conference later this week, directly compares employment at today’s leading tech/telecom firms with employment at the industrial leaders of the past. Here’s what we found:

• Today’s 10 most valuable tech/telecom companies employ roughly 1.5 million people, up 63 percent over the past 10 years.

• In 1979, at the peak of US manufacturing employment, the 10 most valuable industrial companies employed 2.2 million workers, 48 percent more than employment at 2017 tech/telecom leaders.

• The average employment of the vintage-2017 tech/telecom leaders is 149,000, compared to a 222,000 average for the vintage-1979 industrial leaders. However, the industrial average is heavily influenced by General Motors, which is an outlier. If we omit General Motors, the employment average of the other industrial companies is 152,000, very close to today’s tech/telecom average.

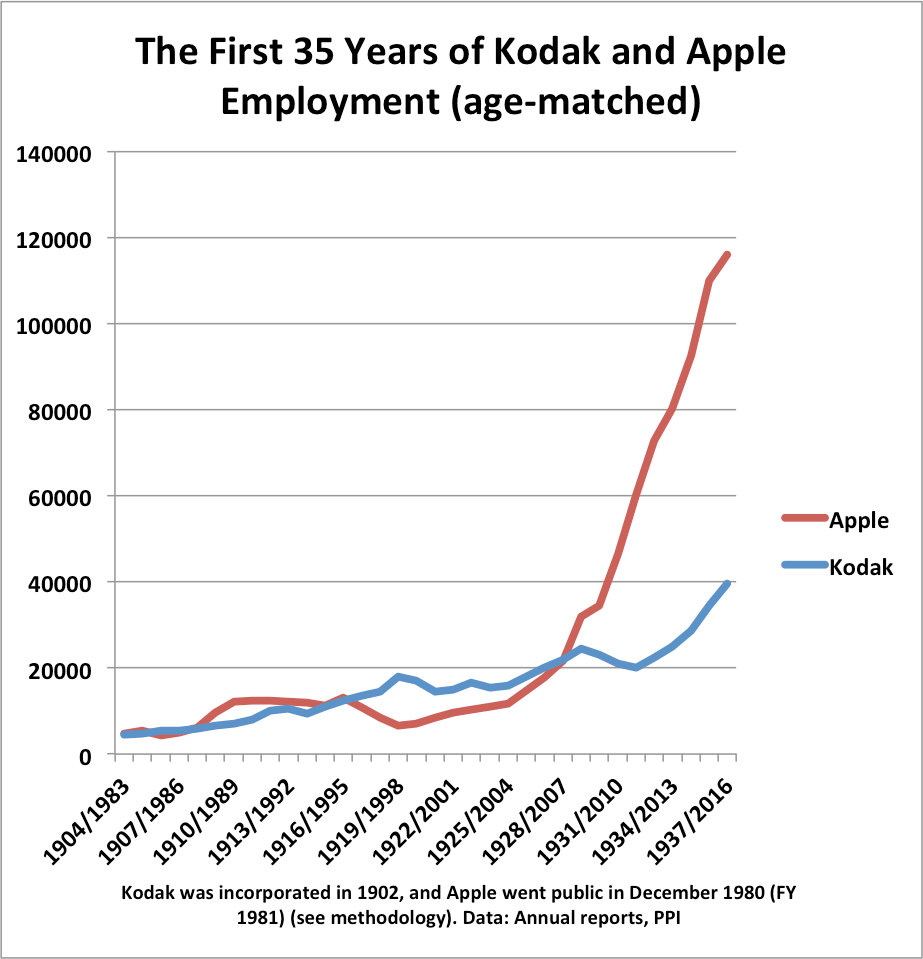
• For example,  Apple (mentioned in Irwin’s story) reported 116,000 fulltime equivalent employees as of its last annual report. Kodak in 1979 had 126,300 employees worldwide, and 80,800 in the United States.  That makes them roughly the same size in terms of employment.

• Kodak employed 24,500 workers in 1929. So  Kodak needed 50 years to add roughly 100,000 workers. Apple employed 17,787 workers in 2006, so Apple needed 10 years to add roughly 100,000 workers.


• The revenue of the top 10 tech/telecom companies in 2016 was 5.5 percent of U.S. GDP, compared to 5.7 percent of GDP for the top 10 industrial companies in 1979.

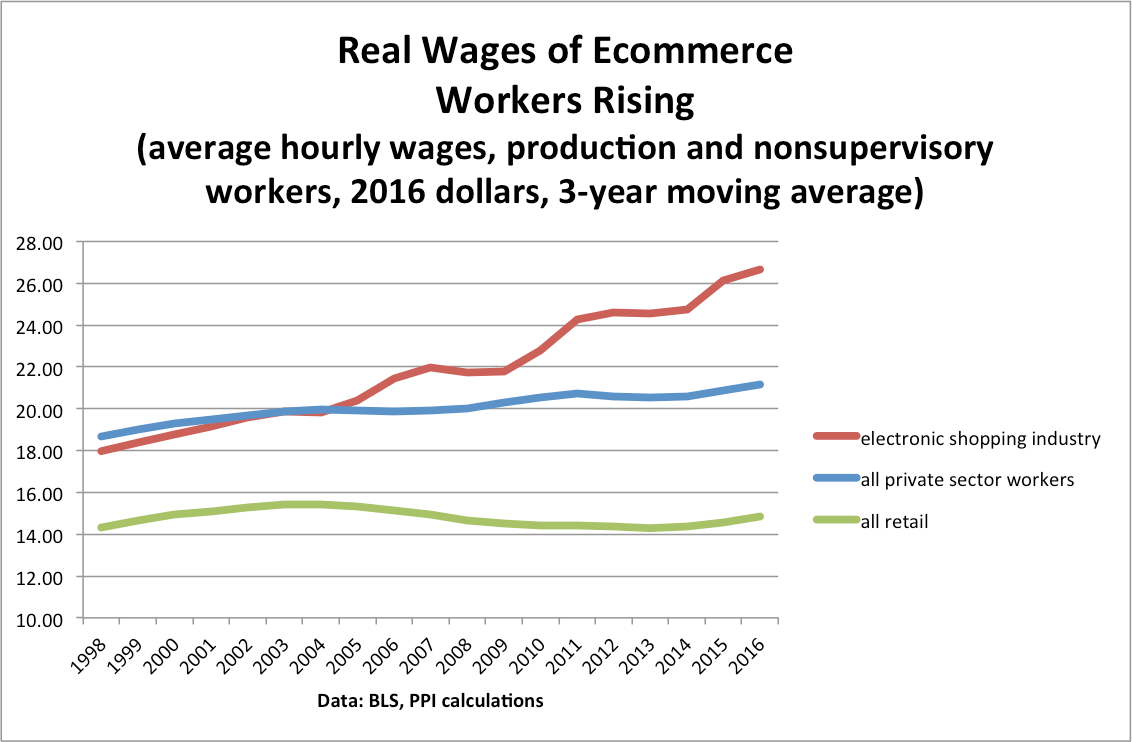
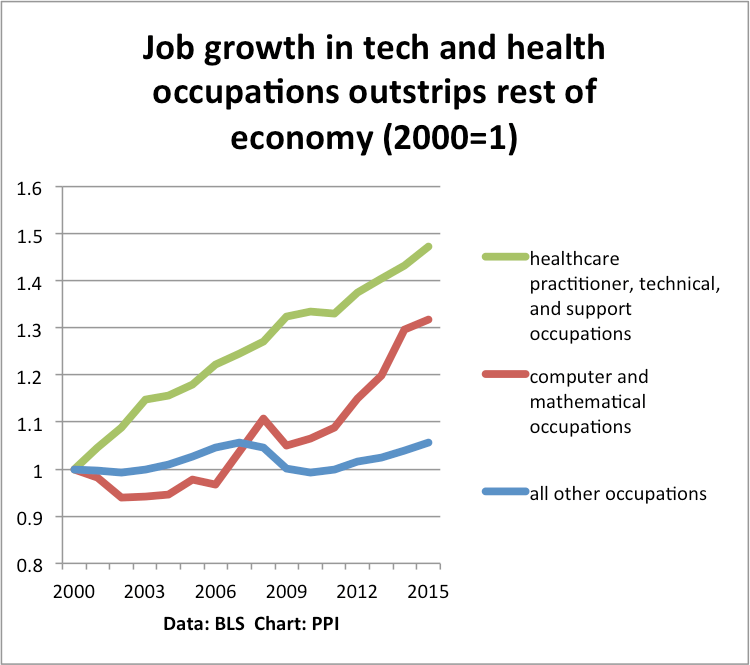
• Real wages for production and nonsupervisory workers in tech/telecom, digital nontech, and health have been steadily rising since 1990. By comparison, real wages for production and nonsupervisory workers in the physical nonhealth sector have been flat since 1990.

• Workers in mid-skill occupations such as office and administrative support; sales; and installation, maintenance, and repair get paid significantly more in the tech/telecom sector.

Read the paper.

Is Economic Growth Becoming Less Concentrated ?

It’s been well-documented that economic dynamism for many years has been concentrated geographically–in a few tech hubs like SF and NY, in the largest urban areas where young people flock, in coastal states. This geographical concentration appears to have been a major force underlying the 2016 election, where areas left behind by economic prosperity were willing to vote for Donald Trump.

However, the latest release from the BLS shows that nonfarm payroll employment increased over the year in 342 out of 388 metropolitan areas over the last year, suggesting economic gains are spreading across the country. Moreover, Amazon and other ecommerce leaders seem to be creating hundreds of thousands of jobs in outlying areas with cheaper real estate and good access to roads.

So we did a deep dive into the numbers. Using QCEW from 2007 to 2016, we compared the economic performance of big metro areas (employment over a million) with the rest of the country. Our measures were growth of private sector jobs and establishments. A new establishment reflects either a new business opening up, or an existing business expanding.

From 2007 to 2015, the big metro areas far outperformed the rest of the country. Indeed, the rest of the country  experienced shrinkage in both jobs and establishments.  Economic growth was very concentrated.


But 2016 was different. In 2016, the rest of the country actually created establishments faster than the big metro areas, reflecting growth of new businesses and expansions of existing businesses.  This is great news. The big metro areas still did somewhat better when it came to job growth, but the gap has narrowed enormously.

We get the similar results when we look at large and small counties (with 400K employment as the dividing line), or major tech hubs versus the rest of the country.

These results suggest that the economic pendulum may be starting to swing back, away from the biggest cities towards more evenly balanced growth, with some very interesting policy and political implications. More to come.


Fact Check: Trump Poverty and Welfare Statements in Inaugural Address

In his inaugural address today, President Donald Trump said, “But for too many of our citizens, a different reality exists: Mothers and children trapped in poverty in our inner cities… We will get our people off of welfare and back to work.”

President Trump thus implied that most U.S. poverty is in “inner cities” and that large numbers of Americans currently receive “welfare”; both implications are extremely misleading.

According to the U.S. Census Bureau, in 2015, the most recent year for which data is available, the rural poverty rate was 16.7 percent, far higher than the 13.0 percent rate in metropolitan areas and almost identical to the 16.8 percent rate in “principal cities.”

As of September 2016, the most recent month for which data is available, 3,707,121 million Americans received some sort of cash welfare supported by the federal government.

Thus only about 1.1 percent of the 324 million people living in America receive cash welfare. In 2015, the most recent year for which data is available, 43.1 million lived below the meager federal poverty line, which equaled $20,090 for a family of three.

This is a repost of a Hunger Free America press release.

Ecommerce Jobs Show Fast-Rising Real Wages and Productivity

Ecommerce jobs  for  production and nonsupervisory workers are paid on average about 25% more than production and nonsupervisory jobs for the private sector as a whole.  That’s according to BLS data.

Economic theory suggests that industries with faster productivity growth should have faster real wage growth. That’s exactly what we see in the case of the electronic shopping industry.

The figure below compares labor productivity growth in the “electronic shopping and mail order” industry (NAICS code 45411)  with productivity growth in retailing as a whole.  We can see an enormous difference. From 2000 to 2015, ecommerce productivity rose at an annual rate of 8.7% annually, compared to 2.6% for retailing as a whole.

ecommerceproductivity


This difference in productivity growth is reflected in the growth of real wages. The figure below compares average hourly wages, in 2016 dollars, for production and nonsupervisory workers in three industries or sector: electronic shopping, all retail trade, and all private sector workers. We see that production and nonsupervisory workers in electronic shopping earned an average wage of $25 per hour. That’s not bad at all–it’s about 25% higher than average hourly wages for all production and nonsupervisory workers, and about 80% higher than average hourly wages for all retail workers.

Depending how we define middle-class, these figures imply that production and nonsupervisory jobs in ecommerce


ecommercewages


What about jobs? Since 2007, the number of retail jobs has risen by roughly 420K, while the number of “electronic shopping” jobs has risen by 140K. And that latter number is most likely an underestimate, because it doesn’t include ecommerce jobs that are part of larger retail establishments. So ecommerce is a major driver of good job creation in the retail sector.

The implication is that as more and more retail jobs shift to ecommerce,  both wages and productivity will rise.


New PPI Report Proposes Utilizing Technologies to Reduce Poverty

Uber, NYC Human Resources Administration, United Way of NYC, and Hunger Free America Join PPI to Promote New Report

NEW YORK CITY—The Progressive Policy Institute (PPI) today was joined by technology, government, and anti-poverty leaders at a public event to release a new report by Hunger Free America CEO Joel Berg, Fighting Poverty with HOPE. The report proposes that federal, state, and local government agencies forge partnerships with the technology industry and nonprofit groups to create online HOPE (Health, Opportunity, and Personal Empowerment) accounts and action plans.

HOPE accounts would combine improved technology, streamlined case management, and coordinated access to multiple to federal, state, city, and nonprofit programs that already exist. The accounts would enable families to use any smart device or computer to learn about the public and philanthropic programs for which they are eligible—including aid to improve health, nutrition, job training and placement, housing, income, etc.—and then apply for all of these programs at once from the convenience of their device, drastically reducing the opportunity costs of low-income Americans seeking social services. Such accounts would also be able to include any private savings that people are able to accrue.

The proposal includes the option of partnering more in depth with government and nonprofit organizations by voluntarily agreeing to long-term HOPE action plans that will provide more aid and then specify exactly how all parties will work together to help the families earn, learn, and save better to ensure greater economic opportunity.

“The only thing low-income people have less of than money, is time,” said Joel Berg. “The new HOPE technology partnership would streamline multiple government and nonprofit safety net programs all into one user-friendly device, allowing low income individuals to fill out one application, rather than wait in line for hours at up multiple government and nonprofit assistance offices. Tangible hope is the world’s most powerful motivator. Surely the Right, the Left, and everyone in between can all agree on making hope a reality again.”

“U.S. social programs too often force low-income Americans to run a bureaucratic gauntlet to get the help they need to climb out of poverty,” said Will Marshall, President of the Progressive Policy Institute. “Joel Berg’s new report for PPI illustrates how we can harness smart phones and the Internet to bring anti-poverty policy into the 21st Century in a way that should appeal to people on both sides of the partisan divide.”

“So many families in New York City that find themselves struggling to make ends meet have at least one working adult,” said Nicole Gallant, Senior Vice President and Chief Impact Officer, United Way of New York City. “It’s our aspiration that this new HOPE technology, will make benefit sign-up easier for these families and thereby increase access and their ability to move along the path to self-sufficiency.”

At today’s event was Steven Banks, Commissioner, NYC Department of Social Services, who demonstrated his support of the report in an effort to decrease poverty in New York City. Also showing his support of the proposed technology plan was Josh Mohrer, the General Manager of Uber NY. Nicole Gallant, Senior Vice President & Chief Impact Officer, United Way of New York City, Will Marshall, President, Progressive Policy Institute, and Natosha Mccray, Food Action Board Member, Hunger Free America also spoke on the panel about the importance of this technology plan to help low-income Americans get out, and stay out, of poverty.

Fighting Poverty with HOPE

Economists often apply the term “opportunity costs” to high and middle-income people, meaning that the time they spend on one task is time not available to perform other, potentially more valuable tasks. But social scientists rarely apply the concept to low-income people, acting as if their time is essentially worthless. Sort of like the spouse who doesn’t count your food shopping, cooking, cleaning, child-rearing, accounting for family finances, shuttling family member to appointments, taking care of your sick parents, etc., as work.

Yet, in addition to lacking money, low-income Americans frequently lack time. Just as many personal relationships collapse when people don’t have “quality time” with each other, a lack of time works mightily against the efforts of lowincome people to have constructive relationships with their families and with the broader society.


The Real Story of the Tech Job Boom: A Response to the WSJ

Suppose you were counselling your college-age child about what fields to consider. Where would you tell them to start?

The short answer: Tech and health. Just look at the numbers: Since 2007, when the current tech boom started, employment in computer and mathematical occupations–including software developers and network administrators–has grown by more than 900,000 jobs. Employment in healthcare occupations–including physicians, nurses, skilled medical technicians, and support occupations–has risen by almost 1.9 million jobs. Everything else: Zilch.

That’s why it was a bit strange to read today’s WSJ piece,  entitled “America’s Dazzling Tech Boom Has a Downside: Not Enough Jobs”. The gist of the article is summed up in the lede:

The technology revolution has delivered Google searches, Facebook friends, iPhone apps, Twitter rants and shopping for almost anything on Amazon, all in the past decade and a half.

What it hasn’t delivered are many jobs.

Here’s my  problem with their conclusion: The authors restricted themselves to looking at employment at tech companies, and tech industries as defined by the BLS. That makes sense if we think about tech like it was a manufacturing industry, where the jobs are concentrated in factories that can be easily tracked by government statisticians.

However, a large number of jobs created by the tech boom are outside the tech industry, and indeed, outside the conventional tech hubs. Instead, many people working in IT are in mining, transportation, government, finance, education, media,  healthcare, and retail. The tech boom has spread across the entire economy, lifting employment far from Silicon Valley.

Some of these computer and mathematical occupation jobs are related to the App Economy, which we have discussed elsewhere. Indeed, creating and maintaining mobile apps has become a significant source of employment for the US and other countries. This includes ensuring the cyber security of mobile apps, which is increasingly important for banks and other companies that are worried about being hacked. These jobs are only going to grow.

Here’s a chart that puts job growth into three buckets: computer and mathematical occupations; healthcare practitioner, technical, and support occupations; and all other occupations.  We see that since 2000, computer and mathematical occupations are up 32%, and healthcare occupations are up 47%. Everything else? Only a 5% gain.

What if we start from 2007, when the current tech boom really took off, propelled by Apple’s introduction of the iPhone and the mobile revolution? Since 2007, employment computer and mathematical occupations is up 27%, and jobs in healthcare occupations is up 18%. Meanwhile, the rest of the economy has produced no net new jobs at all.


techjobs2

So, of course that number is heavily influenced by the job losses in maufacturing production workers. What if we just focus on managers? Even there, the growth has been much faster  in tech and health. Since 2007, the number of computer and information systems managers is up 40%. The number of medical and health services managers is up 19%. For all other types of managers, the growth is only 8%, or only 1% per year.

Now, there are all sorts of reasons to worry if these trends will continue. The tech boom could come to an end, pressures on health care costs could slow job growth. But at least for now, if your kid is looking for growth sectors,  tech and health are the name of the game.


Investment Heroes 2016: Fighting Short-termism

It’s become conventional wisdom that corporate America has fallen victim to myopia and short-termism. Companies are spending billions buying back stock that could have gone to innovation and investment. Corporate executives have compensation packages tied to stock prices, which focuses their attention on quarterly earnings rather than long-term growth. Investors want immediate results, rather than building for the future. Whatever the merits of the short-termism thesis, America’s weakness in capital spending is all too real. The Progressive Policy Institute first noted the “business investment drought” in 2010 and 2011.

Indeed, we started our “Investment Heroes” annual ranking in 2012 precisely to highlight those companies that were investing heavily in the United States. Jason Furman, head of President Obama’s Council of Economic Advisors, gave the keynote talk at a 2015 PPI conference on “Reviving Private Investment” and highlighted how the private investment drought undercuts U.S. productivity growth and, therefore, income gains.

This report continues the annual Investment Heroes ranking again this year by identifying those U.S. companies resisting short-termism and making long-term domestic investments in buildings, equipment, and software.5 We call these companies “Investment Heroes” because their capital spending is helping raise productivity and wages across the country. Further, we use our “Investment Heroes” analysis to help understand the potential causes of the current short-term mentality and discuss some policy options for reversing it.

If You Can’t Income Average Across Good and Bad Years, Why Can Trump?

By all accounts, Donald Trump used huge real estate losses in the early 1990s to pay little or no taxes in subsequent years.  In other words, he “income-averaged” his bad years and his good years. That seems to make perfect sense to many tax experts. And the eminently reasonable Megan McCardle of Bloomberg wrote a piece titled “Trump’s 1995 Return Shows Good Tax Policy at Work.”

But suppose you, as a typical American, took a big loss on your home, or had a bad couple of years because you lost your job? Could you cut your taxes by income-averaging, like Trump did?

No and no. First, if you buy your home today, and the value falls tomorrow, you are not allowed to write off your loss on your taxes. As the IRS says in its cheery way, a ” loss from the sale or exchange of a capital asset held for personal use isn’t deductible.”

But perhaps more important, the typical American wage earner who has a decent income one year (and pays lots of taxes!), and loses his or her job the next year, is not allowed to income average across years. That provision was taken out of the tax code in 1986 (there are some special situations where it still holds, but they don’t apply to most people).

Income-averaging would be a tremendous cushion to ordinary wage earners in times of economic tumult, like the recent deep recession. If you lost your job, those bad years could help lower your tax bill in other years where you earned more money. In an important sense, income-averaging is a protection against insecurity. (Full disclosure: I advocated income-averaging in my 1996 book, The High Risk Society).*

How much of a cushion would income-averaging prove in tough times? The amounts could be quite significant. Here’s an example. A married person earning $120K in a year with 1 small child and a non-working spouse would pay (after exemptions and the standard deduction) roughly $15,000 in federal income taxes. If they lose their job for two years, their income goes down to zero and they pay zero taxes.

But if this hypothetical person could income-average over the bad years–like Trump did–he or she would pay tax on $40K of income for three years, which would come to roughly $1500 per year, or a total of $4500 for three years. In effect, income-averaging would cut their three year tax bill by two-thirds, and give them $10K in their pocket–mighty handy to have when you are out of work.**

Now, not to belabor the obvious, putting income-averaging for ordinary Americans into the tax code could be expensive. Given all the other competing needs on the tax system, it’s not clear that allowing broad income-averaging is the best use of scarce fiscal resources. But as a philosophical matter of tax policy, income averaging both aids fairness, and helps cushion ordinary Americans against the ups and downs of a volatile economy.

So I ask the question:  If the ordinary American can’t income average, why can Donald Trump? Or to flip the question around, if Donald Trump can income average, why can’t you?


*The pre-1986 version of income averaging, unfortunately, was restricted to the wrong people. As I wrote in 1996, “under the pre-1986 law, people could only average if their incomes spiked up substantially–a lottery winner, say, or an author whose book was suddenly a best seller. Those restrictions ruled out the people who really needed the help, the ones whose income suddenly took a big dip down because of a job loss. People need to be insured against actual losses, not the possibility of sudden gains.”

**The gain would be even bigger if the family is eligible for the EIC.


Marshall for The Hill: How Welfare Vanished as a Political Issue

Twenty years ago this month, President Bill Clinton signed a landmark bill fulfilling his pledge to “end welfare as we know it.” It was the biggest change Clinton made in national policy, and it lanced a political boil that had vexed Americans for a generation.

Both accomplishments, substantive and political, are worth celebrating today as we witness the most bizarre U.S. presidential election ever. If the rise of GOP nominee Donald Trump shows us democracy at its worst, welfare reform offers an inspiring example of how the system can work.

The summer of 1996 was one of those rare moments when political adversaries come together to make radical alterations in the status quo, rather than incremental nips and tucks. The bill Clinton signed replaced the 61-year-old federal entitlement to cash benefits with a new program, Temporary Assistance to Needy Families (TANF), designed to require and reward work.

It marked the culmination of decades of mounting public dissatisfaction with a welfare system that seemed to entrench poverty and dependence rather than help people escape from them. Welfare was a favorite whipping boy of Republicans, who made it a symbol of the liberal entitlement state run amuck. They used its unpopularity to drive a wedge between Democrats’ working-class and poor and minority supporters.

Continue reading at The Hill. 

The Daily Beast: Hillary Clinton Will Be Barack Obama’s Third Term

With so much ink spilled on the prospects of a Trump presidency, far less attention is being devoted to the more likely scenario of a Hillary Clinton presidency. When there has been sustained speculation, it’s typically been either biographical or ideological: how would her storied professional and personal life, or her sometimes unclear political beliefs, shape her behavior in office?

At least as important to understanding any presidency, however, is determining where that chief executive resides within larger cycles of history and politics. Such a perspective strongly suggests that a Clinton presidency would be one of “articulation” and would bear most similarity to those of Harry Truman (1945-53), Lyndon Johnson (1963-69), and George H. W. Bush (1989-1993).

The term “articulation” comes from the four-part typology (also including “reconstruction,” “disjunction,” and “preemption”) created by political scientist Stephen Skowronek in his now-classic 1997 book The Politics Presidents Make. Skowronek argues that a key to locating presidents in “political time” is to determine whether they are opposed to, or aligned with, the prevailing political paradigms of their time, and then to assess whether those structures and ideologies remain resilient or have grown vulnerable to challenge.

Continue reading at the Daily Beast.

Memo to the Presidential Candidates: To Reduce Inequality, Reinvent Public Schools

Growing inequality has emerged as a central issue in the 2016 presidential election. Yet none of you has paid much attention to a major source of economic inequality in America: the uneven quality of our public schools.

As far as we can determine, GOP frontrunner Donald Trump has no thoughts on how to improve K-12 education. With the exception of Jeb Bush, now out of the race, and Gov. John Kasich, the Republican candidates have said little about education on the stump, beyond ritual denunciations of the Common Core standards.

On the Democratic side, both candidates want to make public colleges more affordable, Sen. Bernie Sanders by eliminating tuition, Hillary Clinton by spending $350 billion for financial aid. Both also want to invest heavily in early childhood education. But Sanders’s web page lists 21 priorities, and K-12 education reform is not among them. Clinton includes it but offers only platitudes, such as “Make high-quality education available to every child—in every ZIP code—in America,”and “Ensure that teachers receive the training, mentorship, and support they need to succeed and thrive in the classroom.”

Given the glaring inequities in our public schools, we are mystified by the absence of K-12 reform from your campaigns. Frankly, this appears to reflect what is worst about each party. Republicans, in blind obedience to the ideology of local control, seem more upset by the prospect of “federal meddling” in public schools than by their endemic failure to give low-income students a quality education. Democrats tolerate failure for another reason, namely fear of alienating teachers’ unions. None of you, it seems, is prepared to stand up for poor children trapped in poor public schools.

Download “2016.03.09 Osborne_Marshall-Memo-to-Presidential-Candidates_Education-Policy”

Osborne for US News: Motor City Schools Makeover

Public education in Detroit, where 57 percent of children live below the poverty line, is a mess. Detroit Public Schools, which ranked last out of 21 large districts on the 2013 National Assessment of Education Progress tests, is almost bankrupt, shrinking so fast it has about a third of the students it had a decade ago.

Last week, Michigan Gov. Rick Snyder released his much-anticipated plan to straighten out the mess. Most of the press reports focused on the financial issues: The proposal would require state taxpayers to subsidize the district to the tune of $53 million to $72 million per year, so its schools could continue to function while also paying down $483 million in operating debt.

But the most important aspect of the proposal got little attention. The governor wants to set up a Detroit Education Commission that would have the power to measure school performance, create a common enrollment system for all public schools, close mediocre schools (charter and traditional) and replace them with new schools (charter and traditional). This would be a huge step forward: For the first time, Detroit would have a citywide portfolio manager with the power to steer both the traditional and charter sectors toward higher performance.

Continue reading at US News & World Report.

The Digital Opportunity: Democratizing Trade for the 99 Percent

Trade critics often charge that proposed trade agreements like the Trans Pacific Partnership (TPP) essentially serve the one percent—while harming virtually everyone else. But new trade pacts actually present a significant opportunity to drive more inclusive trade—especially by supporting the revolution in digitally enabled global commerce.

In this policy brief, we explain why it is critical for America to lead in writing modern trade rules that promote the free flow of data and open digital commerce. And we highlight some of the many ways in which the 99 percent—from entrepreneurs and small businesses to consumers and communities—benefit from “democratized” trade in a global digital economy that is both open and fair.

Who Benefits from New Trade Deals?
Over the past three decades, America’s trade agreements have become increasingly complex. While early trade agreements were focused on eliminating high tariffs, modern trade pacts also address non-tariff and “behind the border” barriers, like standards that discriminate against imported products or rules that discourage foreign investment.

To President Obama and supporters of trade promotion authority (TPA) legislation, addressing “21st Century” issues in the TPP and other new trade pacts would enable America to benefit broadly from expanding trade with a growing global economy.

Download “2015.05-Gerwin_The-Digital-Economy-Trade-Agreements-and-the-99-Percent”

Wall Street Journal: Tech Employment: More Diverse Than You Think

PPI Chief Economic Strategist Michael Mandel and Economist Diana Carew’s new report, Tech Opportunity for Minorities and Women: A Good News, Bad News Story, was featured in the Wall Street Journal on the growth in employment for minorities the tech labor market.

“Tech jobs are growing faster and are more diverse than people think,” said Michael Mandel, chief economic strategist at the Progressive Policy Institute and an author of the paper. He wrote it with Diana Carew, another economist at the Institute.

The authors point out that tech startups cluster in dense urban hubs, “creating inner-city jobs and positive local economic spillovers” in places with diverse populations, they write. “Few of today’s tech entrepreneurs want to put their start-ups out somewhere in a suburban office park. Instead, they place their new firms in places that are attractive to young tech workers. This has enormous potential benefits for high poverty urban populations, by promoting better education and social infrastructure.”

Progress for women is much slower. Of the 730,000 high-skill tech jobs created between 2009 and 2014, 26% went to women, who make up 47% of the total workforce. Part of the reason for the gap, Mandel said, is that science-oriented women are choosing to work in healthcare rather than tech. A Google study on the issue identified four key reasons why women say they are reluctant to pursue tech careers: Social encouragement, self-perception, academic exposure, and career perception.

Continue reading at the Wall Street Journal.

The Hill: The most important talk Clinton gave this week was not about email

This week, Hillary Clinton garnered huge media coverage of her remarks at the United Nations. Yet the truly important comments she made didn’t involve email accounts, but rather “the great unfinished business of the 21st century.”

At the outset of the annual two-week session of the United Nation’s Commission on the Status of Women, Clinton built upon one of the most important legacies from her time as first lady: the landmark 1995 speech in which she outlined the many ways in which “human rights are women’s rights … and women’s rights are human rights.”

That speech, given at a U.N. conference in China, supported the Beijing Declaration and Platform for Action. The platform was designed to achieve the ambitious aim of “removing all the obstacles to women’s active participation in all spheres of public and private life through a full and equal share in economic, social, cultural and political decision-making. This means that the principle of shared power and responsibility should be established between women and men at home, in the workplace and in the wider national and international communities.”

Continue reading at the Hill.