In a post-election post we showed how American workers are being failed by the physical industries, which had dramatically underperformed the digital industries across a wide range of metrics, including productivity, compensation, and job growth. This sharp and growing economic gap between the Digital Nation and the Physical Nation had profound political consequences, since the Physical Nation is still triple the size of the Digital Nation.
In this post we look at the economy from the consumer side.
1. Per capita real consumption of physical goods and services, outside of housing and health care, has grown by only 10% since 2000, or an average of 0.6% annually. By comparison, per capita real consumption of digital goods and services has skyrocketed, growing by 64%, or 3.4% annually.
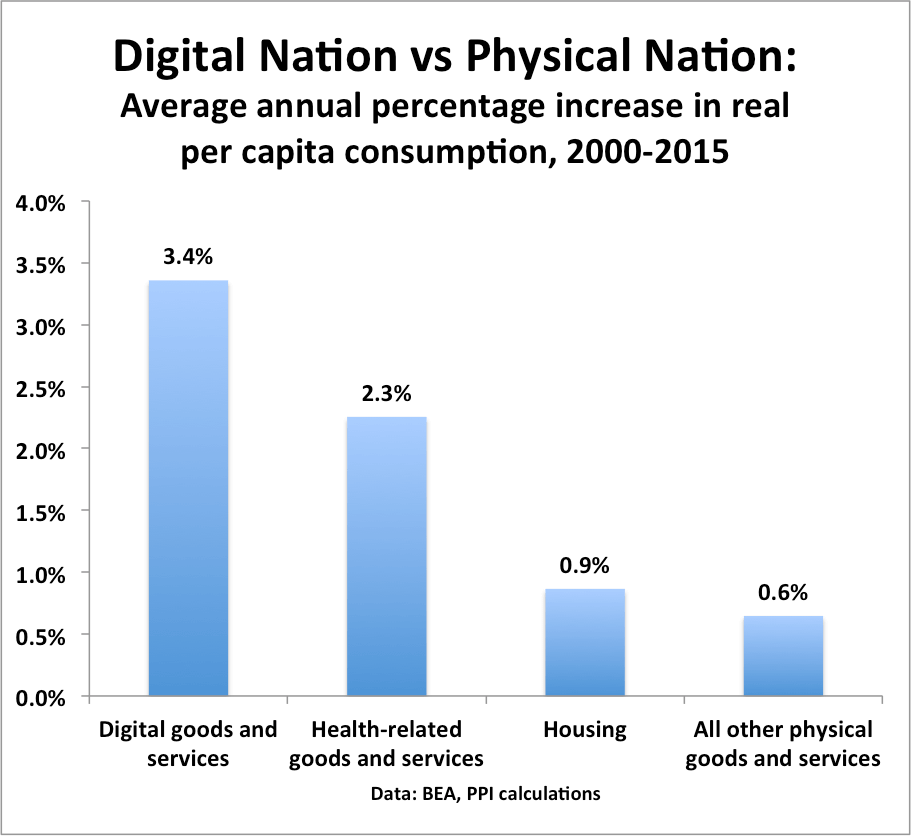
2. In other words, to the extent that consumer living standards have been rising, the gains have been mainly driven by digital goods and services. For example, per capita real consumption of communication services–including internet, wireless, and cable–is up by 60% since 2000. This calculation is based only on government data, without taking into effect possible unmeasured gains in consumer surplus.
3.. By contrast, in the physical sector per capita real purchases of motor vehicles and parts has risen by only 6% since 2000, or only 0.4% per year. Similarly, per capita real purchases of food and beverages for home use has risen by only 4%, or 0.3% annually. It should be noted that food processing is a manufacturing industry which has shown no labor productivity growth in the past ten years, .
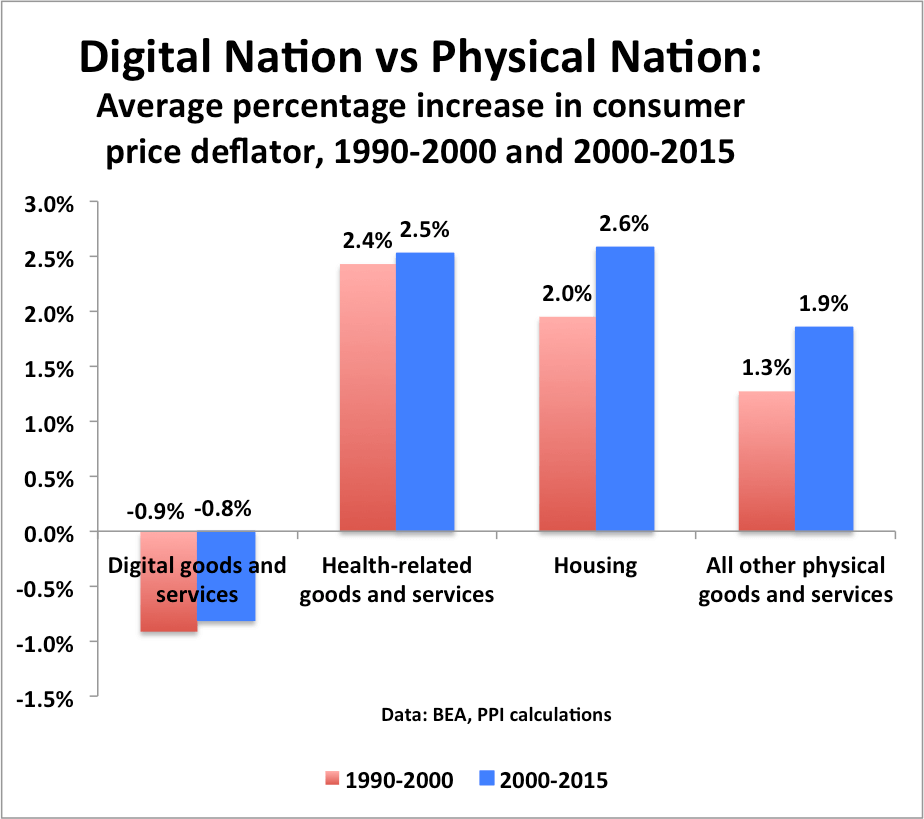
4. The Digital Nation is mainly characterized by falling or flat consumer prices, while the Physical Nation is mainly characterized by rising consumer prices. In the digital sector, consumers spend less to get more, while in the physical sector, consumers spend more to get less. The price of communication services is basically flat since 2000, allowing even low and middle-income households to participate in the App Economy.
5.On the other hand, low- and middle-class households have battled with the rising price of food, housing, healthcare, and transportation. The nominal incomes of middle class households (middle quintile) have risen 34% since 2000. But food prices have risen 41%; the price of housing, fuels and utilities (except phone and cable) is up 50%; and the price of food services and accommodations is up 50%. And while the price of new motor vehicles has been relatively flat since 2000, the price of gasoline is up 65%; the price of auto maintenance and repair is up 53%, and the price of taxicabs is up a stunning 74%.
6. The rate of inflation has actually accelerated in the Physical Nation. As the chart above shows, the price of physical goods and services, outside of health and housing, rose at a 1.9% rate in the period 2000-2015, compared to a 1.3% rate in the 1990s.
7. The digital sector has performed extremely well for consumers over the past 15 years. From the policy and political perspective, our focus should be on why prices rose so fast in the physical sector since 2000 compared to the previous decade. The price increases for physical goods and services helps explain why low- and middle-class households have been struggling, and why they are so angry.

