U.S. MFN tariff rates:
On silver-plated forks: 0.0%
On stainless steel forks 15.8% + 0.9c each
values under 25 cents:
As Americans prepare 1040 forms and tax payments this week, some observations on the U.S.’ oldest and most regressive tax:
In principle, tariffs are simple. An American auto dealership pays the Customs Bureau the 2.5% tax on a German car and includes it in the sales price. But in practice, tariffs can be very complicated. Even setting aside the system’s many add-ons and holes,* the basic U.S. “Most Favored Nation” tariff schedule is a mini-tax code all to itself, arranged in 11,111 different “lines” from horses at the beginning (line 01012100) through salt, cars, butter, planes, powdered zinc, playing cards, computers and more, to antiques between 100 and 250 years old at the end (line 97069000), each with its own tax rate.
Information on this system’s operation is scarce. Congress appears to have held its most recent hearing on tariff policy in 1974. It has been even longer since the Treasury Department reported on the distributional and other economic effects of tariffs. And the only regular review of the tariff system’s impact on employment, production, and living standards — the U.S. International Trade Commission’s admirable if limited “Economic Effects of Significant Import Restraints” report — last came out in 2017. But enough information is available to make three main points: (1) the tariff system is a small part of federal revenue; (2) it mainly taxes consumer necessities like clothes and shoes; and (3) it is, by far, the most regressive U.S. tax. Some detail on each of these points, plus an additional fourth observation unrelated to taxation:
1. Tariffs provide about 2% of federal revenue. According to the Congressional Budget Office’s November estimates, the U.S. Treasury took in $4.06 trillion in Fiscal Year 2021 (i.e., Sept. 30, 2020 through Sept. 30, 2021). The Treasury used six major taxes to raise this money, topped by the $2.04 trillion income tax, the $1.31 trillion payroll tax, and the $0.37 trillion corporate tax. Tariffs placed fourth at $81 billion (for the Fiscal Year; the calendar year 2021 total was $85 billion), about equally divided between the administrative and provisional Trump-era tariffs on Chinese goods and metals, and the permanent “MFN” tariff system established by law. Rounding out the six taxes, excise taxes on fuels, alcohol, and tobacco placed fifth at $75 billion, and inheritance taxes sixth at $25 billion.
2. The U.S. tariff system is mainly a way to tax clothes, shoes, and a few other consumer necessities, and is therefore a “regressive” tax. The Trump-era tariffs hit manufacturers and construction firms hardest. (More on this in a few weeks.) The permanent tariff system is quite different, mainly taxing retailers and families by putting its highest rates on clothes, shoes, and a few other home goods such as silverware, plates and cups, and drinking glasses. Tariff rates on this set of goods average about 11.3%, roughly 16 times the 0.7% average for everything else. Thus in 2017, the last year before the Trump tariffs, these products accounted for about 6% of America’s goods imports ($144 billion of a $2.37 trillion total), but raised about 55% of tariff revenue ($17 billion of $33 billion). Any tax focused on clothes, shoes, and other home needs is “regressive” — that is, it hits low-income families harder than middle-class or rich families — since the poor must devote more of their income to these necessities.
3. Because consumer goods tariffs are high for cheap goods, and low for luxuries, they single out the poor to pay more. Worldwide, most tariff systems tax these goods more heavily than industrial products and natural resources. Thus the U.S. system is not unusual in being a regressive tax; but it is nearly alone in taxing cheap mass-market goods much more heavily than the exactly analogous luxury products bought by the wealthy. For example, Australian tariffs on shoes are almost all either 5% or zero, and do not set higher rates on cheap shoes than on expensive ones. American shoe tariffs by contrast are 8.5% for dress leathers, 20% for elite basketball and track shoes, and 48% for cheap sneakers imported at $3.00 and below. The fork example above is much the same: buyers of sterling silver pay no tax at all, while buyers of cheap stainless steel pay about 20% (counting the 0.9 cent per fork flat fee as well as the 15% “ad valorem” tariff).
This skew is systematic, appearing in almost all tariffed consumer goods. A quick PPI table gives twelve typical examples:
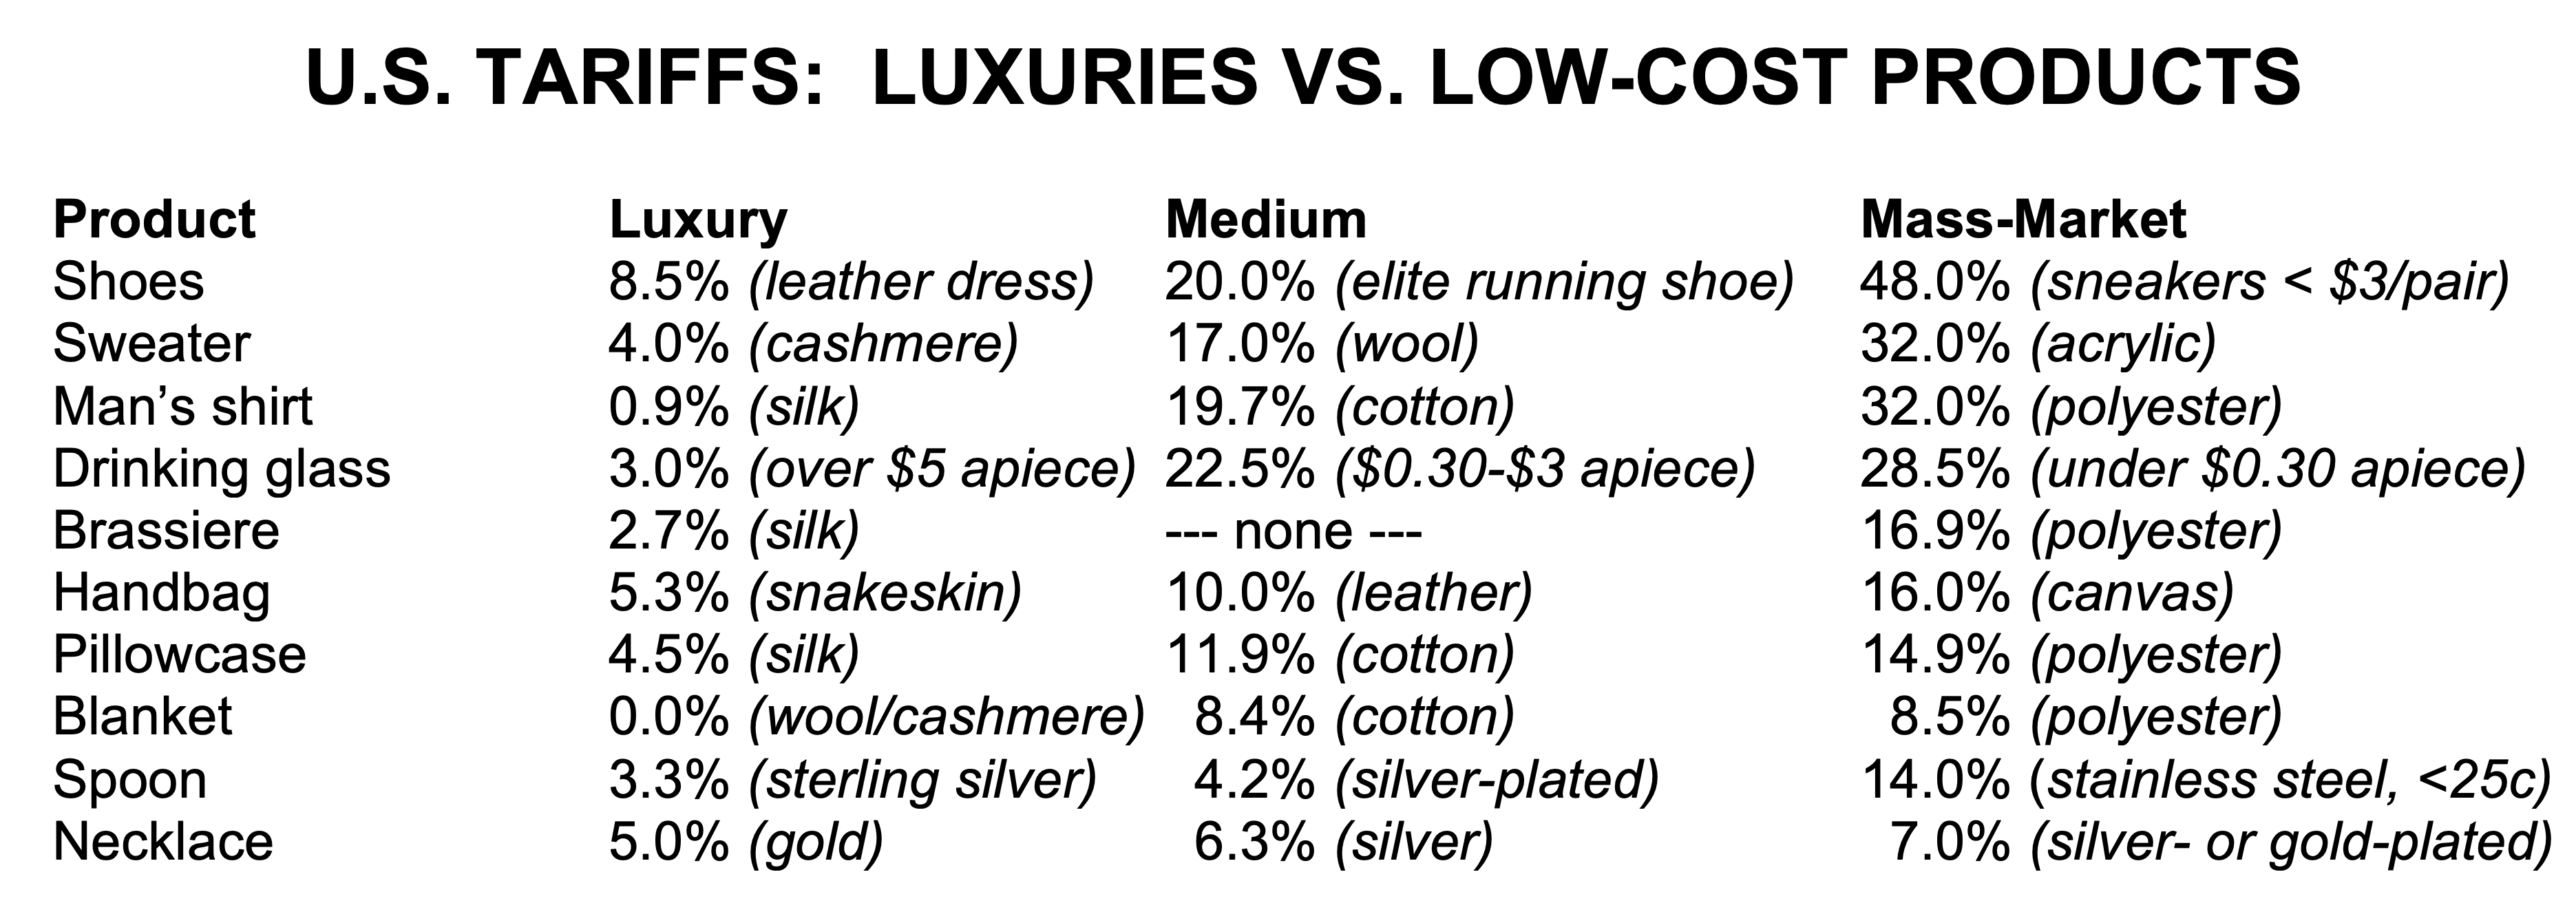
Explanatory note: These home goods — clothes, shoes, home linens, luggage and handbags, jewelry, and tableware — account for a relatively small proportion of imports, totaling $123 billion in 2017, or 5% of the U.S.’ $2.3 trillion in merchandise imports. Nonetheless, these products account for $17 billion of the $32.4 billion in 2017 tariff revenue. Thus average tariff rates applied to these products are about 15%, 20 times higher the 0.8% average for other goods. About $25 billion worth of these products arrived duty-free under FTAs and trade preference programs, while $100 billion came under the MFN tariff s above.
For the sake of simplicity, we have not included the actual tariff line numbers in the table above. They are available at the U.S. International Trade Commission’s tariff site. If you have a specific request, please email us.
4. Tariffs do not appear effective as job or production protectors. Finally, though not a tax issue as such, the consumer goods tariffs appear not to have powerful effects on employment and production. For example, 98% of shoes are imported and no cheap sneakers have been made here since the 1970s; likewise 97% of clothes are imported, and most arrive under the normal tariff system rather than FTAs or preferences. Silverware is made in the United States, but in the high-priced luxury low-tariff category rather than the cheap high-tariff category.
Perhaps we can do better, and treat low-income Americans more fairly, than this.
* Add-ons: anti-dumping and countervailing duty penalties on particular goods, Trump-era “301” and “232” tariffs on metals and Chinese goods. Holes: waivers of tariffs for particular countries through FTAs and preferences.

The U.S.’ “Harmonized Tariff Schedule”
Obama administration Council of Economic Advisers luminaries Jason Furman, Jay Shambaugh, and Kadee Russ on the tariff system as an “arbitrary and regressive tax.”
The U.S. International Trade Commission’s “Economic Effects of Significant Import Restraints,” the last edition was authorized in 2016 and released in 2017.
In this Form 1040 season, tariff reform and PPI’s big-picture tax reform
PPI’s July 2019 tax proposal envisions scrapping Trump-era tariffs and the regressive-but-ineffectual parts of the MFN tariff system. This is part of a larger reform program designed to create a “simpler, fairer, and more pro-growth tax system that raises adequate revenue”. The program includes 14 specific reforms that reduce taxes on income from labor while increasing them on unearned sources of income for the wealthy; rein in the biggest tax expenditures; encourage reduction or elimination of other wasteful and distortionary elements of the tax code; and improve collection. Examples include replacing the relatively regressive payroll tax with a value-added tax; revising the estate and gift tax system; adding a marijuana excise tax, and more. See pp. 44-56.
And for reference, the basic data from CBO
The Congressional Budget Office’s latest outlay-and-revenue summary.
And the six main taxes in Fiscal Year 2021:
Total federal revenue $3,842 billion
Personal income taxes $1,705 billion
Payroll taxes $1,296 billion
Corporate income taxes $268 billion
Tariffs $81 billion
Excise taxes $75 billion
Estate & gift taxes $28 billion
Misc. other fees and fines $32 billion
Ed Gresser is Vice President and Director for Trade and Global Markets at PPI.
Ed returns to PPI after working for the think tank from 2001-2011. He most recently served as the Assistant U.S. Trade Representative for Trade Policy and Economics at the Office of the United States Trade Representative (USTR). In this position, he led USTR’s economic research unit from 2015-2021, and chaired the 21-agency Trade Policy Staff Committee.
Ed began his career on Capitol Hill before serving USTR as Policy Advisor to USTR Charlene Barshefsky from 1998 to 2001. He then led PPI’s Trade and Global Markets Project from 2001 to 2011. After PPI, he co-founded and directed the independent think tank ProgressiveEconomy until rejoining USTR in 2015. In 2013, the Washington International Trade Association presented him with its Lighthouse Award, awarded annually to an individual or group for significant contributions to trade policy.
Ed is the author of Freedom from Want: American Liberalism and the Global Economy (2007). He has published in a variety of journals and newspapers, and his research has been cited by leading academics and international organizations including the WTO, World Bank, and International Monetary Fund. He is a graduate of Stanford University and holds a Master’s Degree in International Affairs from Columbia Universities and a certificate from the Averell Harriman Institute for Advanced Study of the Soviet Union.
Read the full email and sign up for the Trade Fact of the Week

