| Crude oil | 90% |
| Polyethylene (plastic base) | 37% |
| Gasoline | 36%* |
| Urea (fertilizer base) | 12% |
* American Automobile Association (AAA) calculations for the United States, regular grade.
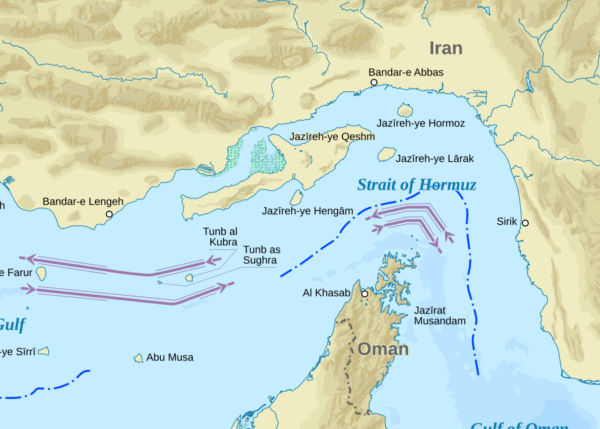
Named for a medieval Arab kingdom famous enough for its 17th-century wealth to serve as a chapter headline in Paradise Lost, the Strait of Hormuz connects the mostly land-locked Persian Gulf to the open-water Gulf of Oman and the Indian Ocean. A look at the implications, and the impact to date, of its closure:
| World Fuel Exports, 2024 | $3,122 billion |
| Via Strait of Hormuz | $592 billion |
| United Arab Emirates | $286 billion |
| Iraq | $100 billion |
| Qatar | $78 billion |
| Kuwait | $69 billion |
| Iran | $47 billion |
| Bahrain | $12 billion |
Since the Trump administration opened its campaign at the end of February, Strait transits have dropped by about 96%, and tanker transits appear to be running at one or two per day. This implies about 280 million “barrels” of oil taken out of the world market, or roughly 20% of the worldwide oil supply. With a sudden contraction in energy supply, and no change in Asia’s need for it, prices have risen fast. Crude oil jumped from $55 per barrel at the end of February to about $100 per barrel by mid-March, and stayed there.
PPI’s four principles for response to tariffs and economic isolationism:
Straits:
In Nature last November, supply-chain analysts Jasper Verschuur, Johannes Lumma, & Jim Hall review risk premiums at 24 maritime chokepoints, including the Straits of Hormuz, Taiwan, Dover, and Malacca; the Suez and Panama Canals; the Bab al-Mandeb, the Windward Passage, etc. They think Russia, Central Asia, and the Middle East are especially vulnerable to chokepoints, the U.S. and Western Europe are less than most, and China and Japan are in the middle.
Lloyds Intelligence has an eye-catching graph of day-by-day transits since January 1.
And the U.S. Naval Institute looks at ship transits, missile strikes, and risk premiums.
Country perspectives:
Oman’s Foreign Ministry, watching from very close, offers analysis.
Pakistan’s Foreign Ministry is the current intermediary.
And a mid-March 35-country policy statement from the UK, France, Germany, Italy, the Netherlands, Japan, Canada, et al.
Food:
The Strait carries not only energy, but about 30% of world fertilizer trade. Carnegie Endowment scholars Noah Gordon and Lucy Corthell assess the implications of Strait closure for fertilizer and food production.
…while U.S. Farm Bureau officers fear yet another shock to American agriculture.
Energy:
AAA tracks gasoline prices.
The Energy Information Administration (a DOE branch) explains the role of crude prices in consumer gas costs.
And for those wanting details, the Bureau of Labor Statistics’ Consumer Expenditure Survey explains American spending patterns. They say that America’s literal “middle class” — the 27 million households in the third, or middle, of five income quintiles — earned on average $74,474 in 2024. (Most recent year for which data is available.) Gasoline and other vehicle fuels cost them $2,645. If they don’t scale back, driving a 36% price increase sustained for a year would cost them about $950. Here’s where gas fits into the budget:
| Income | $74,474 |
| Tax payments: | ~$4,662 |
| Savings | ~$2,912 |
| All spending | $66,900 |
| Home/apartment | $15,257 |
| Food (not including restaurants): | $5,820 |
| Health expenses | $5,676 |
| All non-food/housing/health spending | $40,147 |
| Restaurants (“food away from home”) | $3,277 |
| Entertainment | $2,764 |
| Gasoline/other auto fuel | $2,645 |
| Clothes | $1,642 |
| Personal care products (e.g., soap, makeup) | $892 |
* Tax payments are estimated based on the results in 2023, as the BLS hasn’t yet published a 2024 figure. The third-quintile family’s 2023 tax payment averaged $4,451, including federal, state, local, and property taxes. This was 6.3% of that year’s $71,507 mean income. The $4,662 above assumes that taxes accounted for the same 6.3% share in 2024.
Ed Gresser is Vice President and Director for Trade and Global Markets at PPI.
Ed returns to PPI after working for the think tank from 2001-2011. He most recently served as the Assistant U.S. Trade Representative for Trade Policy and Economics at the Office of the United States Trade Representative (USTR). In this position, he led USTR’s economic research unit from 2015-2021, and chaired the 21-agency Trade Policy Staff Committee.
Ed began his career on Capitol Hill before serving USTR as Policy Advisor to USTR Charlene Barshefsky from 1998 to 2001. He then led PPI’s Trade and Global Markets Project from 2001 to 2011. After PPI, he co-founded and directed the independent think tank ProgressiveEconomy until rejoining USTR in 2015. In 2013, the Washington International Trade Association presented him with its Lighthouse Award, awarded annually to an individual or group for significant contributions to trade policy.
Ed is the author of Freedom from Want: American Liberalism and the Global Economy (2007). He has published in a variety of journals and newspapers, and his research has been cited by leading academics and international organizations including the WTO, World Bank, and International Monetary Fund. He is a graduate of Stanford University and holds a Master’s Degree in International Affairs from Columbia Universities and a certificate from the Averell Harriman Institute for Advanced Study of the Soviet Union.

