FACT: Estimated Cost to Families of Trump Tariff Proposal: $1,500 – $1,700
THE NUMBERS:
| Median U.S. household budget for goods, 2022:* | $19,154 |
| Extra U.S. household costs from a 10% tariff:** | $1,500 – $1,700 |
* Bureau of Labor Statistics, Consumer Expenditure Survey. The total includes BLS’ 2022 figures for mean household spending on food at home, alcohol, natural gas, fuel oil, housekeeping supplies excluding postage stamps, household furnishings, apparel and services, new vehicle purchases, gasoline, medicines, toys, and personal care products.
** $1,500 estimate from Center for American Progress; $1,700 from Peterson Institute for International Economics
WHAT THEY MEAN:
This fall’s core choice is more basic than policy: Can a person who has attempted to overthrow a settled election, and called for the “termination” of unspecified parts of the Constitution, keep an oath to “faithfully execute the office of President of the United States” and “preserve, protect, and defend the Constitution”? But though secondary concerns this time, policies still have human consequences. Three notes therefore on tariffs and prices, with an introduction and a coda:
Intro: As we noted in March, the Trump campaign’s proposal of a 10% worldwide tariff, plus 60% on Chinese-made goods, would be the highest U.S. tariff rate since the late 1930s. Meanwhile, Dr. Peter Navarro — a former trade personality as Trump-era “Director of the Office of Manufacturing and Trade Policy,” a minor player in the attempt to overthrow the 2020 election, and current resident of the Federal Correctional Institution in Miami — skirted federal prison policy last week by connecting with news website Semafor for an email interview. He uses the opportunity to hold forth on a hypothetical second Trump term (mass deportations, immediate purge of the Federal Reserve), air grievances with former colleagues, and insist that tariffs do not affect prices: “In a general equilibrium world, tariffs over time boost growth and real wages; they are not inflationary.”
What do definitions and evidence say?
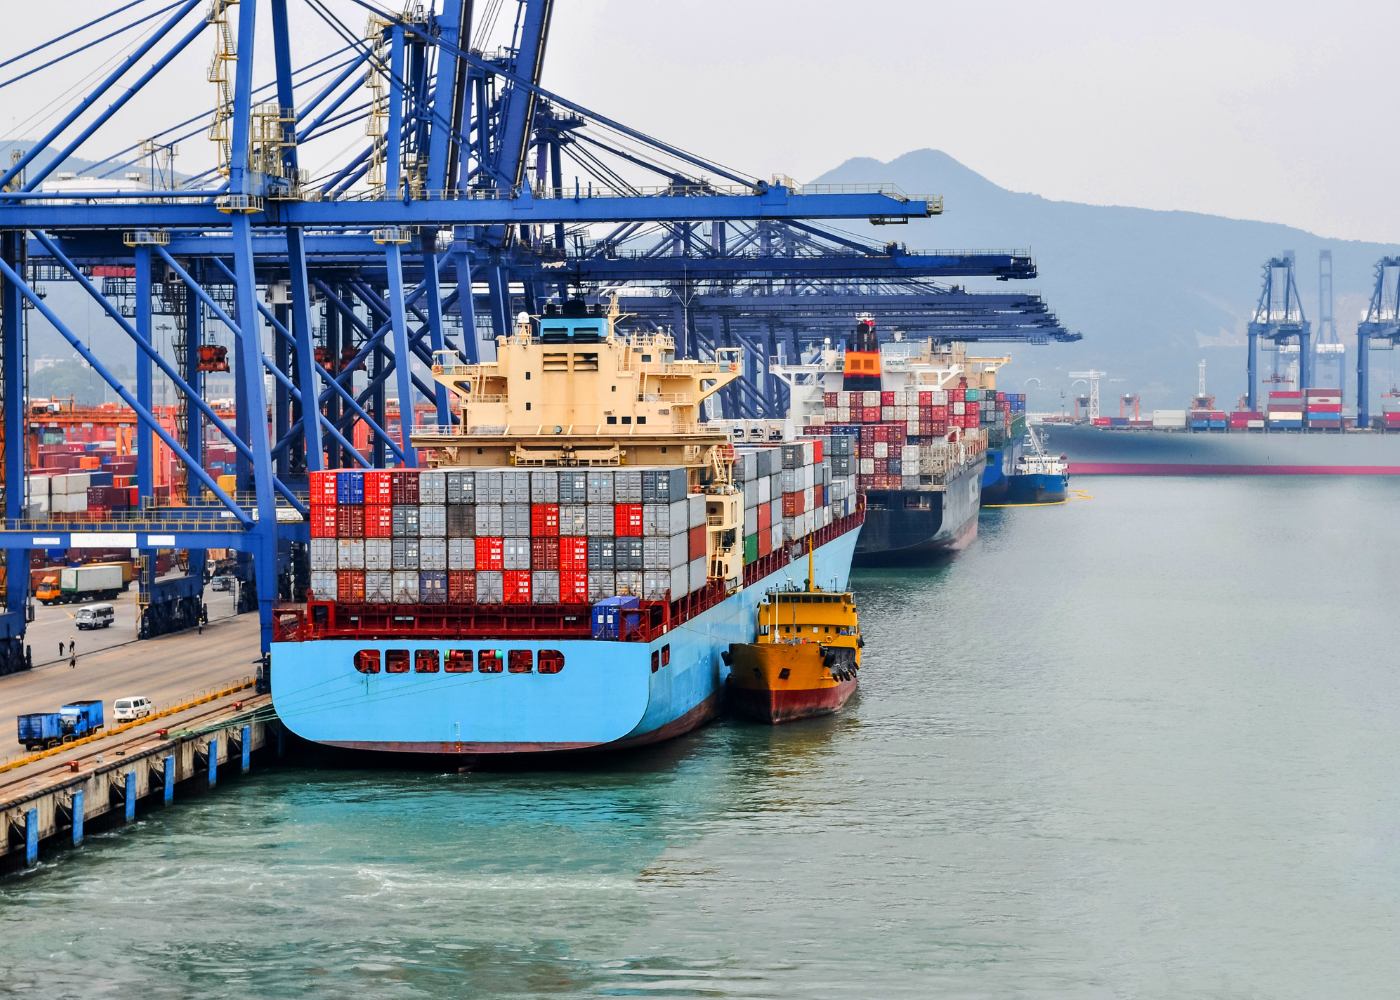
Definition: As the Commerce Department’s International Trade Administration, explains to hopeful U.S. exporting businesses, a tariff “is a tax levied by governments on the value including freight and insurance of imported products,” which “increase[s] the cost of your product to the foreign buyer and may affect your competitiveness.” In the case of consumer goods, retailers pay tariffs at the border, and shoppers ultimately pay. For industrial inputs, the tariff payers are farmers, manufacturers, construction firms, and other goods-using industries, and tariffs raise their production costs. This in turn raises the prices they charge customers, and/or erodes their competitiveness against imports or exports. Either way, tariffs are meant to raise prices and generally succeed.
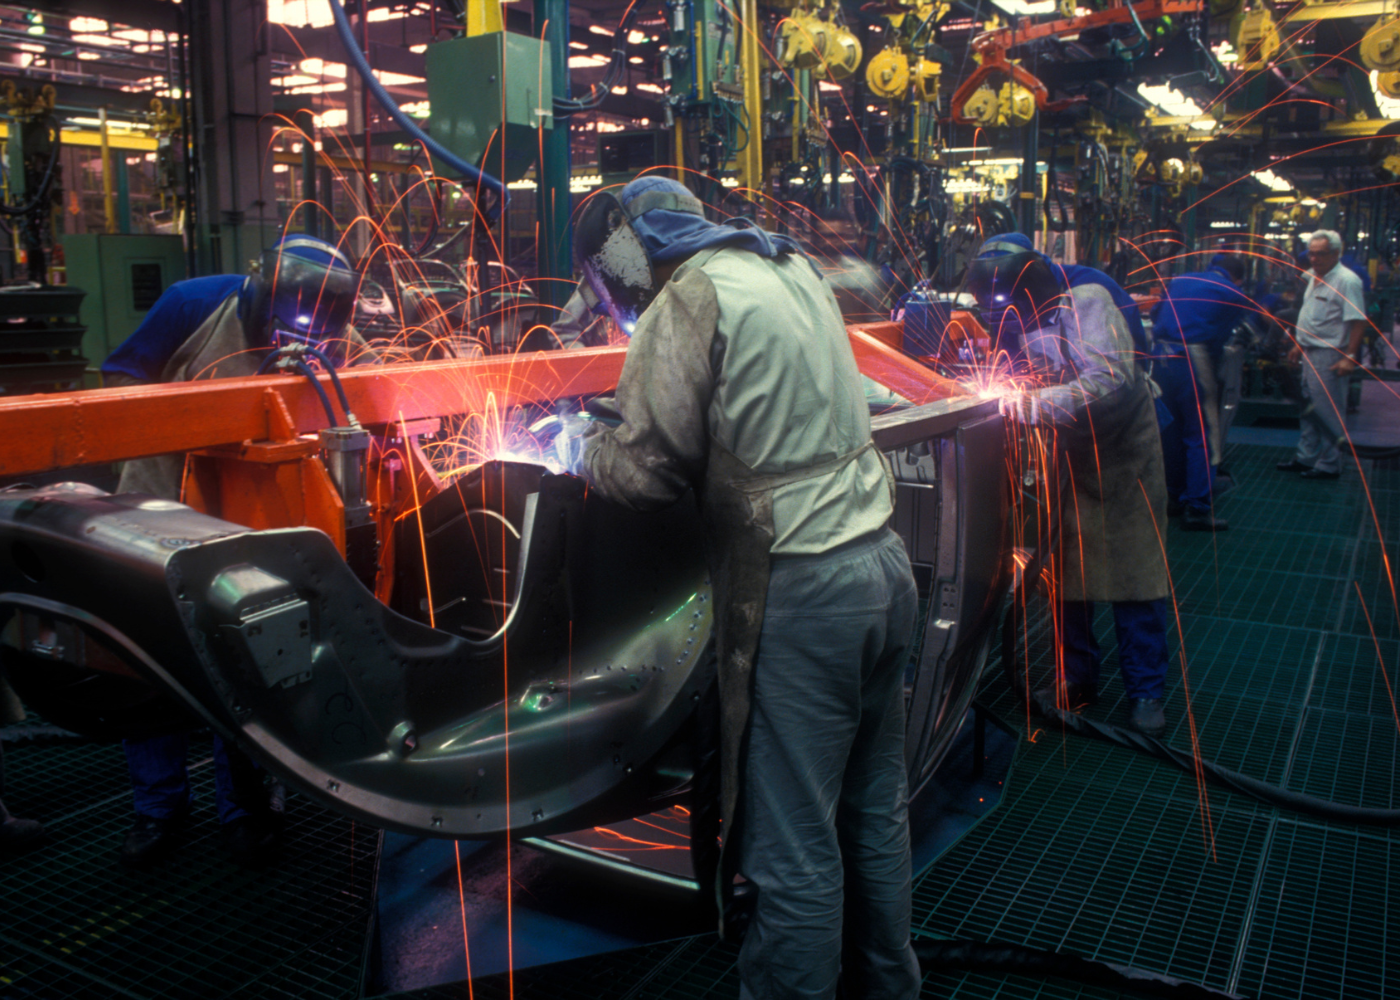
Recent Experience: Moving from on-paper definition to recent experience, the 2018/19 tariffs on metals and Chinese-made products raised the U.S.’ overall tariff rate from 1.8% to 2.8%. Most of the impact seems to have fallen on manufacturers and other goods-users — logically, since while the permanent U.S. tariff system mainly taxes clothes and other consumer goods, Trump-era tariffs are more on industrial supplies. The Government Accountability Office’s examination of the process for making “exclusions” to the China tariffs illustrates this: GAO found 52,810 relief appeals, over half of which — 27,646 — came from buyers of capital goods and industrial inputs worried they couldn’t find affordable alternatives. Another 12,633 came from buyers of auto parts. Assessments of the resulting price increase — e.g. by the Peterson Institute for International Economics and San Francisco Fed staff economists — range from 0.3% to 1.3%.
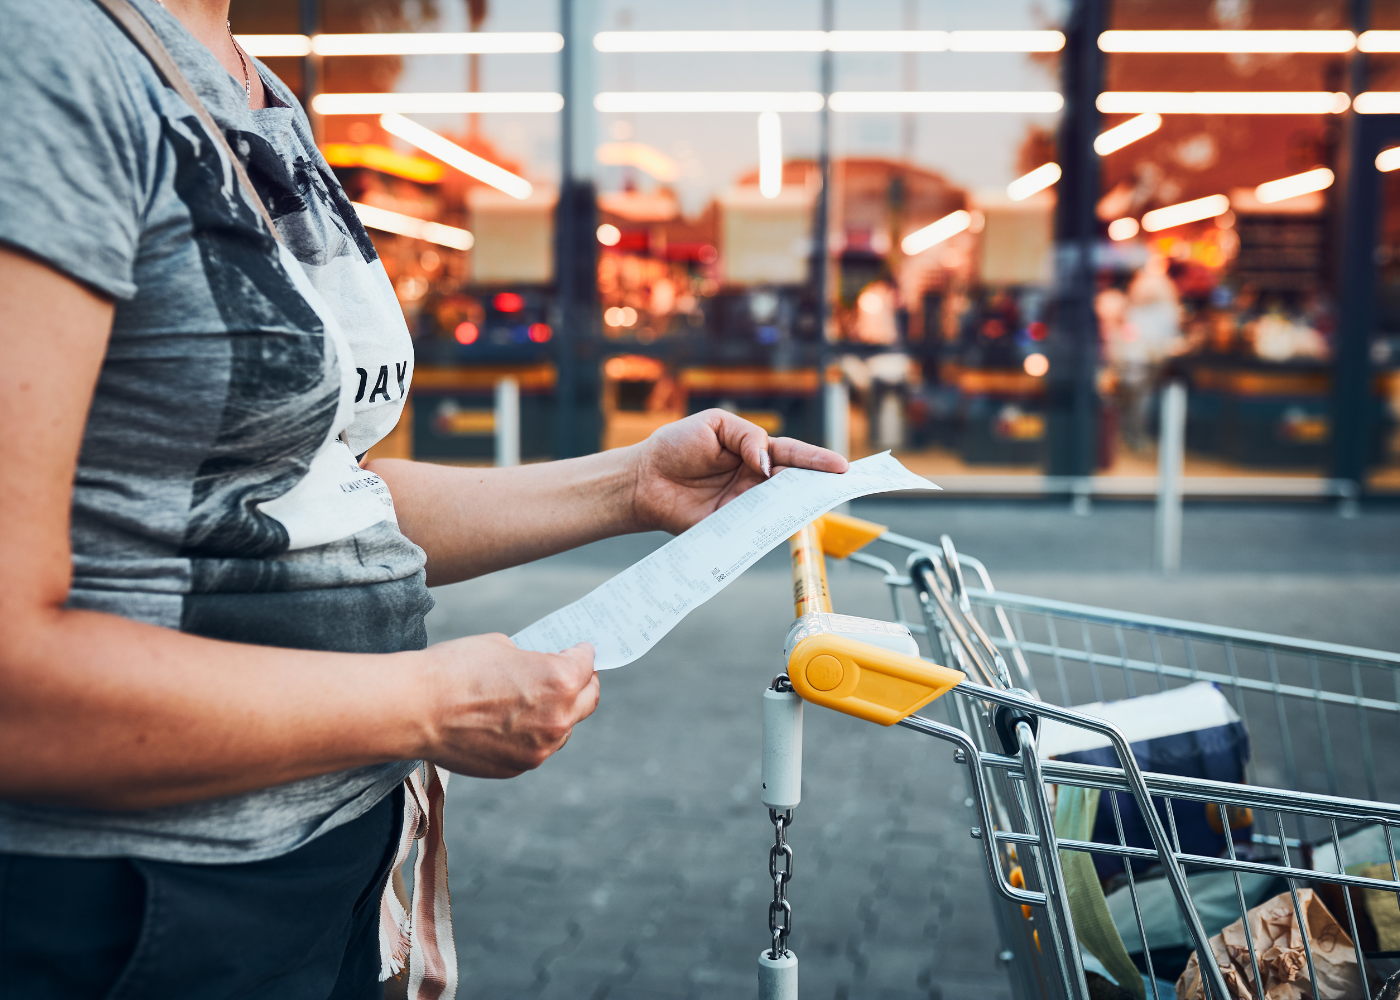
Next: The campaign proposal is much larger. Two independent nonprofits, studying its probable effect this month, basically agree on what to expect. Mary Lovely and Kimberly Clausing, writing for the Peterson Institute of International Economics earlier this month, estimate an additional $1,700 in additional costs per U.S. household, with the greatest loss of purchasing power in the lowest-income families. Brendan Duke, a former National Economic Council economist now with the Center for American Progress, finds a similar $1,500 increase in costs per middle-income household, with specific examples including $120 in higher payment for fuels, $90 for medicine, $220 for autos and boats, $80 for consumer electronics, and $90 for food. Overall, the Bureau of Labor Statistics’ Consumer Expenditure Survey reports that on average households spent $19,154* on goods in 2022. Against this background, a $1,500 or $1,700 cost increase is something like an 8% or 9% burst of inflation in goods prices, or an equivalently high “tax increase” depending on the angle from which you look at it. Prices are higher either way.
Coda: Again, policy issues are secondary this fall. But Rep. Bennie Thompson (D-Miss.), Chair of the House’s January 6th Committee in 2022, reminds us of why Dr. Navarro must do his interviews from the Miami FCI this summer, and that policy can’t be wholly separated from the really basic choice:
“Peter Navarro abandoned his oath to the Constitution and abused the public trust while he worked as a trade adviser to former President Trump when, in the days leading up to January 6th, he worked to keep a defeated incumbent in the White House. He abused it again when he willfully defied a lawful subpoena from the January 6th Select Committee to answer questions about the lead-up to that deadly day. Last summer’s guilty verdict and today’s sentence are the consequence.”
FURTHER READING
Looking back:
Former Treasury Secretary Larry Summers assesses estimates of potential to roll back price increases through tariff cuts, finds a 1% price reduction credible (2022), with link to Peterson Institute for International Economics research.
Pre-trade war, San Francisco Fed staff economists estimate price inflation.
And the GAO looks back from 2021 on government handling of requests for exclusions from “301” tariffs in 2018 and 2019.
Looking ahead, three views on a 10% across-the-board tariff:
The Peterson Institute’s Mary Lovely & Kimberly Clausing foresee a $1,700 per household cost increase.
Center for American Progress’ Brendan Duke estimates $1,500.
… and the Bureau of Labor Statistics Consumer Expenditure Survey puts these numbers in context with data (through 2022) on how much families spend.
And completing the ideological balance (though not quite parallel with the PIIE and CAP studies, as the focus is on macro rather than extra household costs), Erica York of the Tax Foundation sees a GDP contraction and higher prices ahead.
Update from the Federal Corrections Institution/Miami:
Navarro interview on mass deportations, Federal Reserve purge, grudge against Gary Cohn, tariffs, etc.
The Federal Correctional Institution in Miami, with explanations of work requirements (7 ½ hours per day), media policy (press visits allowed, though not “to provide publicity for an inmate or special privileges for the news media, but rather to ensure a better-informed public”), and a non-luxurious but also non-Spartan commissary menu.
And Rep. Bennie Thompson (D-Miss.) reminds us of why he’s there.
ABOUT ED
Ed Gresser is Vice President and Director for Trade and Global Markets at PPI.
Ed returns to PPI after working for the think tank from 2001-2011. He most recently served as the Assistant U.S. Trade Representative for Trade Policy and Economics at the Office of the United States Trade Representative (USTR). In this position, he led USTR’s economic research unit from 2015-2021, and chaired the 21-agency Trade Policy Staff Committee.
Ed began his career on Capitol Hill before serving USTR as Policy Advisor to USTR Charlene Barshefsky from 1998 to 2001. He then led PPI’s Trade and Global Markets Project from 2001 to 2011. After PPI, he co-founded and directed the independent think tank ProgressiveEconomy until rejoining USTR in 2015. In 2013, the Washington International Trade Association presented him with its Lighthouse Award, awarded annually to an individual or group for significant contributions to trade policy.
Ed is the author of Freedom from Want: American Liberalism and the Global Economy (2007). He has published in a variety of journals and newspapers, and his research has been cited by leading academics and international organizations including the WTO, World Bank, and International Monetary Fund. He is a graduate of Stanford University and holds a Master’s Degree in International Affairs from Columbia Universities and a certificate from the Averell Harriman Institute for Advanced Study of the Soviet Union.