Today, the Progressive Policy Institute (PPI) released its annual report “Investment Heroes 2023.” The report, published annually since 2012, analyzes publicly available data to identify the top 25 U.S. companies investing in America, powering job growth, and raising living standards. The theme of this year’s Investment Heroes report is the recovery of U.S. capital investment from the shock of the COVID-19 pandemic and the benefits these investments provide to workers.
Eight of the top 10 companies on this year’s ranking are in the technology, broadband, or ecommerce industries, with Amazon leading the list, investing $46.5 billion in the United States in 2022. Report authors, Dr. Michael Mandel, Vice President and Chief Economist at PPI, and Jordan Shapiro, Director of the Innovation Frontier Project at PPI, analyzed capital spending in “high-investment” sectors and compared the spending levels for the same companies in 2019. Their analysis found that the great majority of companies on the Investment Heroes list have high and growing levels of domestic capital investment, compared to before the pandemic.
“Since our first Investment Heroes report in 2012, the companies featured on the list have drastically changed. Back then, only one out of the top 10 companies was in the tech/internet sector. Fast forward to 2022, and we’ve seen new companies rise to the top of the list because of innovation and growth,” said Dr. Michael Mandel. “The dramatic evolution of the Investment Heroes list shows the ever-changing competitive nature of the U.S. economy.”
PPI’s analysis found that capital investment is associated with massive job creation. Between 2019-2022, our high-investment sectors added 1.3 million net new jobs, more than the entire rest of the private sector put together. Not only that, but many companies are investing back into training and education for their employees and new workers.
“The 2023 Investment Heroes list and analysis show it is important to recognize not only what companies are investing in America, but also what companies are investing in workers,” said Jordan Shapiro.
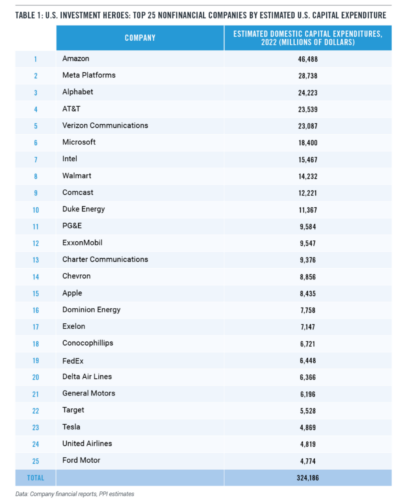
The 2023 top nonfinancial companies by estimated U.S. capital expenditure:
The Progressive Policy Institute (PPI) is a catalyst for policy innovation and political reform based in Washington, D.C., with offices in Brussels, Berlin, and the United Kingdom. Its mission is to create radically pragmatic ideas for moving America beyond ideological and partisan deadlock. Learn more about PPI by visiting progressivepolicy.org.
The theme of this year’s Investment Heroes report is the recovery of U.S. capital investment from the shock of the pandemic and the benefits for workers. Every year, the Progressive Policy Institute (PPI) analyzes the financial reports of large U.S. companies and ranks them by their capital investment in the United States. Eight of the top 10 companies on this year’s Investment Heroes list are in tech, broadband, or e-commerce industries. Amazon is at the top of the list, investing $46.5 billion in the United States in 2022, according to estimates by PPI. Next comes Meta, Alphabet, AT&T and Verizon, followed by Microsoft, Intel, Walmart, Comcast, and Duke Energy.
All told, the 25 companies in the Investment Heroes list invested $324 billion in the U.S. in 2022 (Table 1).
But it is not simply that the companies on the list invest the most in the U.S. — they also show faster recovery from the pandemic. Since 2019, domestic capital expenditures by the 25 companies on this year’s list has risen 38%, without adjusting for inflation. By comparison, overall nonresidential investment as measured by the Bureau of Economic Analysis rose by only 15% over the same period, also without adjusting for inflation.
And while this report focuses only on U.S.-based companies, the difference was not being made up by money from abroad. New direct investment by foreign companies in the U.S. actually fell by 20% from 2019 to 2022.
The domestic capital investment by the companies on the list is the lifeblood of the economy, producing job and income gains, and setting the country on a path to a greener future. It ranges from e-commerce fulfillment centers employing thousands of workers at good wages, to data centers supporting small businesses across the country, to 5G and broadband networks linking rural areas, to factories building batteries for the next generation of electric vehicles, to new fabs, to new fuel-efficient planes.
It should be noted that the financial data we use for our list focuses mainly on spending on structures and equipment — what’s known as tangible investment. But the government’s definition of investment includes key intangibles such as software and research and development. Very few companies report software spending, and not all companies break out their R&D expenditures. But the ones that do tend to show big gains. For example, Alphabet boosted its spending on R&D by more than 50% from 2019 to 2022, compared to a 32% gain in overall private R&D spending. Apple showed a 62% increase in R&D spending from FY 2019 to FY 2022. General Motors increased its R&D spending by 44%. Such increases fuel new product development and innovation, which shows up as faster growth going forward.
From the perspective of policy, it’s worth comparing the U.S. capital investment performance during the pandemic years with Europe’s. Europe has consistently adopted a more aggressive regulatory stance. Has it paid off in the form of higher investment?
The short answer is no. When the European Investment Bank (EIB) did its comparison of U.S. and European investment spending in a February 2023 report, it focused on a measure called “non-construction investment” — basically machinery, equipment and intellectual property assets such as software and R&D. Using the EIB’s methodology, we calculated that nonconstruction investment in the United States rose by 20% from 2019 to 2022, compared to only 12% in the European Union. Overall, the EIB study finds a widening gap between the US and Europe in terms of productive investment.
Before we dive into the details of this year’s study, it’s worth taking a long-run perspective. Our first Investment Heroes report, released in 2012, tracked 2011 domestic capital spending. Five out of the top ten companies that year were energy companies. The only tech company in the top ten was Intel. Google and Apple were 24 and 25 on the list, respectively, and Amazon was nowhere to be found. Neither was Microsoft or Meta. It was a completely different list.
Figure 1 shows the full history of aggregate capital spending of the Investment Heroes list on a year-by-year basis (right axis), plotted against annual U.S. nonresidential investment (left axis). From 2011 to 2017 the two figures rose by the same amount, 36% without adjusting for inflation.
But after 2017, the situation changed. The companies on the Investment Heroes list began driving national capital expenditures. From 2017 to 2022, domestic capital expenditures by PPI’s Investment Heroes rose by 75%, compared to 29% for the BEA’s nonresidential investment figures.
The key leader was Amazon. In the five years ending with 2022, the company invested the staggering sum of $162 billion in the United States, creating hundreds of thousands of jobs in the process and creating massive gains in consumer welfare.
But it wasn’t simply Amazon. Table 2 sums our 2022 Investment Hero estimates into seven economic sectors: tech/ internet; broadband/ wireless; ecommerce/retail; energy distribution; energy exploration; transportation; and automotive. We call these the “high-investment” sectors. We then compare capital spending in those sectors with our estimates of domestic capital spending for those same companies in 2019.
For six out of seven economic sectors, we find significant growth in domestic capital spending from 2019 to 2022. In other words, the companies on our Investment Heroes List typically have high and growing levels of domestic capital investment compared to before the pandemic.
In addition, our analysis shows that capital investment creates jobs and raises wages. Between 2019 and 2022, the high-investment sectors on our list added more net new jobs than the entire rest of the private sector put together. We calculate this number by looking at the employment in domestic industries corresponding to the seven sectors in Table 2, as reported by the BLS. (We use industry data because domestic employment data is not available for all companies. The industry-level data also accounts for broader impacts of investment).
By our estimate, the high-investment sectors added 1.3 million net new jobs between 2019 and 2022, accounting for 55% of private sector job creation. Employment in the high-investment sectors grew by almost 5%, compared to a 1% gain in the rest of the private sector.
The leader was the ecommerce/retail sector, which added more than 800,000 jobs between 2019 and 2022, as job gains in ecommerce fulfillment and delivery more than made up for any losses in brick-and-mortar retail. Next was the combined tech/internet/broadband/wireless sector, which added almost 500,000 jobs.
What about pay? Real wages per worker in the ecommerce/retail sector rose by 7% from 2019 to 2022 (using QCEW data from the BLS and the PCE deflator). Overall, real wages per worker in the high-investment sectors rose by about 6%, a slightly larger gain than the rest of the private sector.
We also note the importance of investment in human capital — the training and education of workers. Companies are not required to report spending on training and education, but it’s more essential today than ever before.
FACT: Americans are buying fewer Chinese-made smartphones, laptops, TVs, and toys this year.
THE NUMBERS: Chinese share of U.S. laptop computers –
Jan. to Aug. 2023 82%
2022: 91.5%
2021: 93%
2017: 93%
WHAT THEY MEAN:
The Census’ monthly trade figures, now complete through August 2023, show imports down by about $136 billion or 6% as compared the first eight months of 2022. (Last year: $2.21 trillion; this year: $2.08 trillion.) Nearly two-thirds of this decline is in specifically Chinese-made goods, so the worldwide 6% drop combines a remarkable 24% fall in imports from China with a modest 2% decline from the rest of the world. The figures are:
Imports: -$136.3 billion = -6%
From China: -$89.6 billion = -24%
From all other countries: -$46.7 billion = -2%
Some thoughts on possible explanations below, but first a set of mini-case studies covering four consumer goods: laptops, smartphones, TV sets, and toys. Together these account for $19.5 billion of the $89.6 billion drop in imports from China, and about a seventh of the worldwide drop.
1. Laptops: Laptop computers accounted for $48 billion of America’s $526 billion in imports from China in 2022. This Chinese-made $48 billion in turn made up about 92% of a worldwide $52 billion. Counting individual devices, Americans bought 111.5 million laptops last year from three main sources: 102.7 million from China, 5.4 million from Vietnam, and 2.5 million from Taiwan. Comparing Census’ Jan.-August figures for 2022 with those for 2023, the total laptop-import count is down from 76.4 million to 65.8 million, with Chinese-assembled laptops specifically off from 71.1 million to 56.4 million. By contrast, Vietnam’s laptop shipments, have more than doubled from 3.3 million in Jan.-Aug. 2022 to 7.2 million so far in 2023. Taiwan’s have stayed the same at 1.4 million. So here, the drop in imports is not worldwide, but wholly Chinese..
2. Smartphones: The phone pattern is similar — overall U.S. buying down; buying from China especially down; one rival (though not the same one) rising fast. Specifically, 2022’s 173 million smartphone arrivals included 134.9 million from China, 30.4 million from Vietnam, 4.0 million from India, and another 4.0 million divided among Hong Kong, Korea, and Japan. So far this year (again comparing Jan.-August. data), phone imports are down from 115.8 million to 94.3 million, with Chinese-assembled phones accounting for 12.2 million of the total 21.5-million drop. In contrast to laptops, next-door Vietnam is even further off its 2022 pace — from 24 million phones to 11.5 million, or more than half. India is the fast-growing rival here, up from 2.5 million phones to 6.8 million.
3. TV sets: TV-set data again repeat the pattern — total imports down, China down especially fast, and a competitor rising. TV imports from China are down by 40.7% in dollars — from $7 billion to $4.4 billion — and 35% in set-count, from 43 million to 27.9 million. Meanwhile, imports of TVs from Vietnam have jumped from 3.8 million in 2022 to 5.7 million in 2023. Imports from Mexico are up too (though not dramatically) from 19.1 million to 19.6 million.
4. Toys: Finally, a less chip-and-solid-state-electronics-heavy example Overall, U.S. toy imports have dropped by about a third, from $13.8 billion in Jan.-Aug. 2022 to $9.1 billion in Jan.-Aug. 2023. Almost all the decline is in Chinese-made toys, down from $11.0 billion in Jan.-August 2022 to $6.9 billion in 2023. Here, though, while China’s “share” of U.S. toy imports has drifted down (from 83% in 2021 to 80% in 2022 and 76% so far in 2023) no single competitor seems to be rising in China’s place. Vietnamese toy shipments are down by 34%, Indonesia’s by 22%, and the non-China world overall by 20%. Mexican toy exports are a modest exception, up 8% in percentage terms, but in dollars, this is only about $40 million.
What to make of this? Four possible explanations:
1. Tapped-out American shoppers: One contributing factor is purely American. After two years of post-Covid shopping, Americans have restocked their wardrobes, replaced their phones, and TVs, and don’t need more just now.
This is plausible at least in part: With China the principal source of these things, any drop will naturally show up mainly in trade with China. But this doesn’t seem like the whole story — the simultaneous jumps in laptop and TV imports from Vietnam, and in phone imports from India, suggest buyers finding alternative if smaller Asian sourcing sites. So analysts while not discounting explanation 1 should also be thinking about explanations 2, 3, and 4.
2. Structural change reflecting geopolitics and trade conflict: After holding up through 2018-2022, despite tariffs, retaliations, spikes in diplomatic tension, and export controls, U.S.-China trade finally began to buckle this year.
3. Structural change reflecting Chinese domestic policies: After three years of chronic zero-COVID factory closures and intensified political pressure on foreign firms, China’s competitiveness has badly eroded and buyers are looking elsewhere.
4. Alternative structural change reflecting intra-Asian integration: Or, finally, China’s competitiveness maybe hasn’t eroded per se, but electronics supply chains are becoming more elaborate and specialized. In this hypothesis, final consumer-goods assembly (having shifted to China in the 2000s) now moves to neighboring countries as China takes up a new role as a components and engineering skills supplier, using the newly implemented Regional Comprehensive Economic Partnership agreement to cut costs.
Treasury Secretary Janet Yellen on de-risking, friend-shoring, non-“decoupling,” and the future U.S-China economic relationship.
And some perspectives:
WTO economists wonder whether trade flows are beginning to illuminate the early stages of “geopolitical blocks,” in which some countries trade more with China, and others more with the United States.
PIIE’s Adam Posen sees the end of the Chinese economic miracle.
Former World Bank director for China and current Singapore-based academic Bert Hofman, writing for the Asia Society Policy Institute, looks to domestic economic mistakes.
ABOUT ED
Ed Gresser is Vice President and Director for Trade and Global Markets at PPI.
Ed returns to PPI after working for the think tank from 2001-2011. He most recently served as the Assistant U.S. Trade Representative for Trade Policy and Economics at the Office of the United States Trade Representative (USTR). In this position, he led USTR’s economic research unit from 2015-2021, and chaired the 21-agency Trade Policy Staff Committee.
Ed began his career on Capitol Hill before serving USTR as Policy Advisor to USTR Charlene Barshefsky from 1998 to 2001. He then led PPI’s Trade and Global Markets Project from 2001 to 2011. After PPI, he co-founded and directed the independent think tank Progressive Economy until rejoining USTR in 2015. In 2013, the Washington International Trade Association presented him with its Lighthouse Award, awarded annually to an individual or group for significant contributions to trade policy.
Ed is the author of Freedom from Want: American Liberalism and the Global Economy (2007). He has published in a variety of journals and newspapers, and his research has been cited by leading academics and international organizations including the WTO, World Bank, and International Monetary Fund. He is a graduate of Stanford University and holds a Master’s Degree in International Affairs from Columbia Universities and a certificate from the Averell Harriman Institute for Advanced Study of the Soviet Union.
Data shows that American consumers pay more for prescription drugs than in any other country, and in 2021, the Biden administration’s landmark Executive Order (EO) included a focus on promoting competition in the pharmaceutical industry. While the EO outlined a comprehensive approach to promoting competition and controlling drug prices, the administration left out one critical tool in their toolkit — the FTC’s merger control policy.
Today, the Progressive Policy Institute (PPI) released an analysis suggesting that the administration’s executive order has not fully delivered on the promise of promoting competition in the pharmaceutical sector. The analysis, “Promoting Competition in Pharmaceutical Markets: Is the Biden Executive Order Delivering on the Promise?” focuses on the FTC’s longstanding, controversial pharmaceutical merger policy. It calls out the administration for missing an important opportunity to revisit the FTC’s policy to better promote pharmaceutical competition and bring down prescription drug prices for everyday consumers.
“The Biden administration should deliver on its promise to use a ‘whole-of-government’ approach to promoting competition in the pharma sector,” said report author Diana Moss, Vice President and Director of Competition Policy at PPI. “That means looking to merger control by the FTC as a major tool for preventing harmful consolidation and protecting consumers. But it also means reforming the FTC’s approach to pharma mergers, which has fostered rising concentration in critical drug markets.”
Read and download the full response to the Executive Order here.
The Progressive Policy Institute (PPI) is a catalyst for policy innovation and political reform based in Washington, D.C., with offices in Brussels, Berlin and the United Kingdom. Its mission is to create radically pragmatic ideas for moving America beyond ideological and partisan deadlock. Learn more about PPI by visiting progressivepolicy.org.
In 2021, the Biden administration issued a landmark Executive Order (EO) on competition. A major focus of the EO is the pharmaceutical sector in the U.S., where consumers pay prices for prescription drugs that are significantly higher than in other countries. In deploying a number of policy tools, the sector is a proving ground for the EO’s signature “whole-of-government” approach to promoting competition. However, the approach largely overlooks the critical role of merger control by the Federal Trade Commission (FTC) in the pharmaceutical sector. Merger control is the first line of defense in preventing harmful increases in market concentration that can enhance market power and reduce consumer welfare through higher drug prices, lower quality, and less innovation. In excluding merger control from the policy toolkit, the Biden administration has also missed an important opportunity to revisit the FTC’s longstanding, controversial policy for pharmaceutical mergers. That policy has been to approve virtually all mergers subject to divestitures, which has fostered higher concentration in critical drug markets. This analysis makes the case for why it is time for the Biden administration to take stock and consider a mid-course policy correction in implementing the EO in the pharmaceutical sector.
I. TAKING STOCK OF THE BIDEN ADMINISTRATION’S EXECUTIVE ORDER ON COMPETITION
The availability and affordability of prescription drugs are an essential part of promoting the health, stability, and productivity of the U.S. population. Competition in pharmaceutical R&D that produces new branded drugs, and the entry of generic and biosimilar drugs, plays a leading role in ensuring that medications are accessible and affordable. But anticompetitive strategies can limit competition and reduce consumer welfare through higher drug prices, lower quality, and less innovation. These include “product-hopping” schemes and “pay-for-delay” agreements involving branded drugs coming off-patent, that stifle competition from generics and biosimilars. Pharmaceutical mergers involving generic drug manufacturers that significantly increase market concentration can also lead to outcomes that reduce consumer welfare.
Early on, the Biden administration recognized the challenges of promoting competition in the pharmaceutical sector. For example, the July 2021 Executive Order (EO), Competition in the American Economy,” sets forth a “whole-of-government” approach that is “necessary to address overconcentration, monopolization, and unfair competition in the American economy.” The EO shines a light on the pharmaceutical sector, noting that Americans pay “too much” for prescription drugs, and that they pay far more for drugs than in other countries.
Concerns over competition and drug pricing and access, of course, pre-date the Biden administration. Federal legislative proposals to protect competition and consumers target harmful conduct ranging from anticompetitive agreements that pay generic firms to stay out of a market, to excessive drug pricing. They include, for example, the CREATES Act of 2019, Protecting Consumer Access to Generic Drugs Act of 2019, and Prescription Drug Price Relief Act of 2019. California has also led state efforts to promote competition through legislation that makes pay-for-delay agreements illegal.
The Biden EO frames an ambitious suite of initiatives to address pharmaceutical competition by looking at domestic supply chains, prices paid by the government, generic and biosimilar competition, patent policy, and payment models. An array of executive agencies are tasked with implementation: Health and Human Services and Centers for Medicare & Medicaid Services, the Food and Drug Administration, and the U.S. Patent and Trademark Office. The Federal Trade Commission (FTC) is also charged with using its rulemaking authority to enforce methods of unfair competition or anticompetitive agreements involving prescription drugs.
The scope of the EO’s approach to pharmaceutical competition appears consistent with “whole-of-government.” Antitrust enforcement is clearly a major policy tool. However, the Biden administration omits a vital prong of antitrust enforcement merger control as a first line of defense in addressing pharmaceutical competition and drug pricing concerns. In doing so, the EO also misses an important opportunity to revisit the FTC’s longstanding, troubled policy for reviewing and remedying pharmaceutical mergers.
The omission of important policy tools, or lack of inter-agency coordination, has marked implementation of the whole-of-government approach in other sectors. For example, the U.S. Department of Transportation has not moved to redesign the airport takeoff and landing slot system, or to revisit its approval criteria for airline joint ventures. Both policies are central to promoting competition. The Federal Energy Regulatory Commission has given incumbent natural monopolies in electricity and natural gas precedence in expanding critical infrastructure, a policy that limits competition from other important market players.
This analysis unpacks why a lack of focus on merger control in the pharmaceutical sector is likely to limit the effectiveness of the whole-of-government approach under the Biden administration’s EO. It discusses why a focus on consumer welfare should be a critical policy “lens” through which to view important competition issues; the importance of revisiting merger control in pharmaceutical markets based on past enforcement failures; and the need for a mid-course policy correction.
A colleague recently observed: “Parents have spoken: The school choice debate is over! Now, the debate is about ‘what’ school choice will look like ¾ will it be truly public, or will taxpayer dollars universally fund selective private schools?”
At PPI, we believe that public school options should be just that: public, free, and open to all. Only public schools can ensure that students do not suffer discrimination or exclusion based on race, religion or any other protected categories.
That’s why we were heartened to see a cadre of U.S. Senate Democrats join Republican Senators John Cornyn (R-Texas), Tim Scott (R-S.C.) Bill Cassidy (R-La.), and Mike Braun (R-Ind.) in sponsoring a bill that would encourage school choice that is truly public ¾ and proven.
After 16 years of living next door to a terrorist enclave, a badly shaken Israel is massing its forces to crush Hamas in Gaza. Palestinian civilians are caught in the crossfire — which is exactly what Hamas wants.
As it has done after provoking four previous incursions by Israeli forces, Hamas is counting on images of death and destruction in Gaza to trigger outrage throughout the Middle East and bring international pressure on Israel to stop the fighting and withdraw its forces.
The pattern is grimly familiar: Terrorists commit atrocities, then hide behind civilian populations to escape punishment. Limited incursions and ceasefires only pause the violence, allowing Hamas to regroup and set the clock ticking toward the next terrorist explosion.
And every time, ordinary Palestinians suffer as Israel strikes back at Hamas’s rocket factories, depots and elaborate network of tunnels, cuts the number of border crossings and takes other security measures that make day-to-day life for Gazans ever more difficult.
* Data from the WTO’s annual World Trade Statistical Review reports, 2023 and 2018.
WHAT THEY MEAN:
The International Monetary Fund’s most recent World Economic Outlook, launched last Thursday, reports that in 2022, the world’s GDP topped eleven digits for the first time to reach $100.1 trillion. The WTO’s latest World Trade Statistical Review report, meanwhile, shows exports of goods in 2022 at $24.9 trillion and exports of services at $7.0 trillion. Combining the two, this means $31.9 billion, and a matching 31.9% of world output, crossed borders. This is high in historical terms — possibly the highest export-share-of-GDP ever — reflecting the energy price spike caused by Russia’s war on Ukraine along with post-COVID surge in shopping for consumer goods, reviving travel and transport services, high farm prices, and probably some acceleration of trade integration in Asia. A table of these totals in the recent past and the last two decades:
Tentative conclusion: The high 2022 export-to-GDP ratio probably reflects some temporary factors; in particular, without the energy price spike it would have been somewhere around 29%. But it also suggests that at least so far, the trade conflicts of the past five years haven’t very fundamentally changed trade flows.
Three closer-level looks — at products and “sectors,” countries, and the United States — offer some backup to this general conclusion, but also suggest areas where flows have at least shifted course:
Products: The largest single chunk of world exports is in manufacturing, which in 2022 accounted for $15.3 trillion, or about 48% of all world exports, slightly below the 52% of pre-pandemic 2019. The $15.3 value nearly equals the roughly $17 trillion in world manufacturing output; top exports were $3 trillion in chemicals, $2.5 trillion in IT goods, and $1.5 trillion in autos and auto parts. In second place comes $5.1 trillion in energy and mining, where the supply shock caused by the war nearly doubled trade value from 2017’s $2.63 trillion. Then came $3.3 trillion in digitally deliverable services ranging from entertainment and media to finance, software, gaming, air and hotel reservations, and so on; $2.3 trillion in food and farm goods; $1.5 trillion in miscellaneous goods-trade categories such as scrap metal, small-scale parcel deliveries, and returned purchases; and $1.4 trillion in transport and travel services.
So: Assuming the high energy prices were temporary, little about the world “traded-product” mix changed very much in the last five years.
Countries: The countries at the top of the WTO’s export rankings also remained pretty stable. The largest single block of merchandise trade was either (a) the European Union’s $5.4 trillion in manufacturing exports (which is shaky as it counts $3.25 trillion in trade among the 27 EU members as well as $2.14 trillion from the EU to other countries), or (b) if you take the EU as a lot of individual countries rather than one big economy, China’s $3.3 trillion in manufactures. Counting down from this, the WTO’s rankings of “top exporters” and ‘top importers’ haven’t changed very much in any of the big product divisions. The top six manufacturing exporters in 2022 – China, EU-as-a-single-economy, the U.S., Japan, Korea, Mexico – are identical to the top six of 2017, though Taiwan and Singapore swap 7th and 8th place, and Vietnam replaces Canada in tenth. In agriculture, likewise, the top six exporters are identical, though Thailand jumps over Mexico and Australia to place 7th. Rankings in “fuels and mining” (which in WTO argot includes metal ores) have changed most¸ with the U.S. climbing past Saudi Arabia and Russia to become the top exporter.
Hmm: Despite the “301” tariffs the Trump administration placed on most Chinese goods in 2018 and early 2019, China’s #1 share of world manufacturing exports rose from 17.8% to 21.7%. The U.S. held its #2 manufacturing rank, but the American share of manufacturing exports shrank from 9.4% to 7.8%.
The U.S.: How did the U.S. fare as all this proceeded? From 2017 to 2022, the U.S. held its second-place share as a goods exporter, lengthened its lead as the world’s top goods importer, and remained the top services trader. So to date — despite “301” and “232” tariffs, withdrawal from the Trans-Pacific Partnership Agreement, renegotiation of the North American Free Trade Agreement, sanctions on Russia, and a battery of new export controls — no very revolutionary changes in the actual U.S. world role. A slightly more granular level, though, reveals some shifts:
1. U.S. export economy is a bit smaller and more concentrated in energy: The U.S. export economy shrank a bit (in relative terms), from 12.2% of GDP in 2017 to 11.6% in 2022. Meanwhile, the Census’ count of U.S. exporting businesses fell from 290,600 in 2017 to (a preliminary) 279,000 in 2022. Energy exports however jumped from a historically very high 9.1% of total exports in 2017 – $141 billion of $1547 billion – to an all-time record 18.2% in 2022, or $380 billion of $2086 billion. Mirroring these domestic figures, the WTO finds the U.S. with a lower share of world manufacturing exports and a higher share of energy. Overall, then, not a very inspiring result. One explanation is benign: heavy stimulus spending causing a consumer boom and diverting exports to domestic customers. Another is less encouraging: an unanticipated effect of tariffs, as the “301” and “232” tariffs imposed in 2018 and 2019 fell heavily on industrial inputs, and thus likely raised U.S. factory costs and eroded competitiveness, especially as Asian countries continued to cut tariffs on one another’s goods.
2. Americans import more, especially in manufacturing: Imports, by contrast, rose from 14.9% of U.S. GDP to 15.4%. This is the highest import share since 2014. Most of the jump reflects a post-pandemic surge in import of manufactured goods, which rose in dollar terms by $740 billion from the levels of 2014. Mirroring this rise, the WTO tables show Americans buying 14.1% of world manufactured exports in 2017, and 15.7% in 2022. With exports only up $70 billion, the Trump administration’s pledge to reduce U.S. manufacturing trade deficits ended with a comically perverse doubling of the sectoral deficit from -$648 billion in 2016 to -$1.3 trillion in 2022.
3. Less from China, more from Vietnam and Mexico: Within the totals, though, U.S. sourcing has shifted noticeably. China’s share of U.S. imports, at 21.6% in 2017, fell to 16.3% in 2022; Vietnam and Mexico, and secondarily India and other ASEAN countries, picked up most of the roughly $150 billion in diverted imports. In 2023 (based on the Census figures complete through last August) this drop accelerated, with China falling behind both Mexico and Canada as U.S. import sources. This noted, China’s higher share of worldwide manufacturing exports suggests that (a) Chinese firms were able to replace lost U.S. customers with sales elsewhere, and/or (b) some of China’s diminishing share of American imports reflects shifts of final assembly to other middle-income countries, in which case China would be exporting components and parts to factories abroad and the U.S. still the final buyer. See below, though, for a third possibility — the early stages of vaguely geopolitical “trade blocs” — suggested by WTO economists this month.
FURTHER READING
The WTO’s annual World Trade Statistical Reviewback to 2015, with links to the earlier “International Trade Statistics” yearbooks from 2000 to 2014.
… An accompanying WTO staff report, Global Trade Outlook and Statistics, looks around at 2023 and ahead to 2024, and predicts slower trade growth for the next year and a half. Under the heading “Evidence of Fragmentation” (pg. 12), the authors see initial signs of that trade flows may be beginning to reflect “geopolitical blocs”:
Economic and political tensions between the United States and China — the world’s two largest economies – have been building for several years, leading to the imposition of numerous tariffs. These measures have sparked some changes in international trading patterns, but evidence that they have thrown globalization into reverse remains limited. …
Changes in trade shares along geopolitical lines are also discernible in recent data. For example, US trade in parts and components with politically like-minded countries as measured by UN voting patterns fell from 77% before the pandemic in 2019 to 73% afterwards in 2020. This share then rose to 74% in 2022 and finally back to 77% in 2023. While this could be a sign of supply chains shifting for geopolitical reasons, it could also simply be a reversion to pre-pandemic production patterns.
… and thoughts on it all from WTO Chief Economist Ralph Ossa.
Ed Gresser is Vice President and Director for Trade and Global Markets at PPI.
Ed returns to PPI after working for the think tank from 2001-2011. He most recently served as the Assistant U.S. Trade Representative for Trade Policy and Economics at the Office of the United States Trade Representative (USTR). In this position, he led USTR’s economic research unit from 2015-2021, and chaired the 21-agency Trade Policy Staff Committee.
Ed began his career on Capitol Hill before serving USTR as Policy Advisor to USTR Charlene Barshefsky from 1998 to 2001. He then led PPI’s Trade and Global Markets Project from 2001 to 2011. After PPI, he co-founded and directed the independent think tank Progressive Economy until rejoining USTR in 2015. In 2013, the Washington International Trade Association presented him with its Lighthouse Award, awarded annually to an individual or group for significant contributions to trade policy.
Ed is the author of Freedom from Want: American Liberalism and the Global Economy (2007). He has published in a variety of journals and newspapers, and his research has been cited by leading academics and international organizations including the WTO, World Bank, and International Monetary Fund. He is a graduate of Stanford University and holds a Master’s Degree in International Affairs from Columbia Universities and a certificate from the Averell Harriman Institute for Advanced Study of the Soviet Union.
The next United Nations climate change conference, COP28 , is scheduled to begin at the end of November in Dubai. Beyond the challenges of getting the world to agree on difficult climate issues, progress may be imperiled by the cloud of war between Hamas and Israel, and also by the choice of the United Arab Emirates as the host country.
The Middle East’s tangled politics and tortured alliances will make gaining unanimity of action on critical climate issues that much harder. Credible analysis indicates that Iran’s long-time support for Hamas, and claims that it helped plan the vicious attack on Israel, had a strategic objective of preventing incipient attempts to renew diplomatic relations between Saudi Arabia and Israel. Saudi Arabia and Qatar also find themselves on opposite sides in this crisis, as Qatar has maintained close relations with Hamas for years. That, too, could further complicate efforts to get major oil and gas states aligned.
Yet, hope remains that the conference-hosting UAE — despite deriving nearly one-third of its GDP from oil and gas revenue — can leverage its relationships with other major state-owned energy producers to gain agreements to limit their greenhouse gas emissions, especially of that super-climate-pollutant, methane. Fully 75% of all carbon dioxide and methane emissions from the oil and gas industry come from state-owned companies. Thus, climate protection cannot be achieved without dramatically reducing emissions from the world’s petro-states.
There has been a longstanding trope in the United States that Ukraine is a hopelessly corrupt country, which has abetted the growing movement in favor of withdrawing aid. On this episode of The Eastern Front, Giselle, Dalibor, and Iulia welcome back Tamar Jacoby, director of the New Ukraine Project at the Progressive Policy Institute, to challenge misconceptions about Ukraine’s corruption problem and discuss why a Democratic, Western-oriented market economy in Ukraine is just as vital to US interests as removing Russian troops. How has the war changed the Ukrainian people’s sentiments about their country’s corruption? What have been some of the institutional changes the Ukrainian government has undertaken to combat corruption? Is it necessary for US aid to be conditional on corruption reform?
Today, Will Marshall, President of the Progressive Policy Institute (PPI) released the following statement in response to this weekend’s heinous attack on Israel and the Israeli people.
“The more we learn about Hamas’s barbaric slaughter of civilians in Israel, the more civilized people everywhere should resolve to reject the sickening moral equivocations voiced by apologists for Palestinian terrorists. No cause on earth justifies the orgy of sadism, rape, and mass murder we have just witnessed. And let us have an end to evasive euphemisms like ‘militant’ — the perpetrators of this crime against humanity are terrorists and should be so named and treated.
“We are grateful to President Biden for forcefully condemning Hamas’s depraved violence and pledging America’s steadfast support for the Israeli people at this terrible moment. The contrast between Biden’s moral clarity and unifying leadership and Donald Trump’s dishonest attempts to divide our country by politicizing the tragedy in Israel could not be more telling.
“Israeli forces are now trying to rescue hostages, bring terrorists to justice, and degrade Hamas’s ability to launch further outrages. This is a monumental task made more difficult by Hamas’s cynical tactic of using Palestinian civilians as human shields, which is yet another war crime. It’s imperative that Israeli forces proceed both resolutely and carefully, demonstrating the humanity and respect for innocent lives that their terrorist attackers lack. We see no military justification for depriving Gaza residents of food and fuel.
“The Progressive Policy Institute stands with Israel, and endorses the bipartisan congressional resolution, signed by over 400 Members of Congress, supporting Israel and outrightly condemning the terrorist attacks launched by Hamas against Israeli civilians.
“Standing with Israel against terrorism in no way implies support for Israeli government policies. Indeed, we are concerned by the authoritarian drift of recent Israeli politics. But there will be ample time and occasion to debate these matters once the immediate crisis has passed.”
The Progressive Policy Institute (PPI) is a catalyst for policy innovation and political reform based in Washington, D.C., with offices in Brussels, Berlin and the United Kingdom. Its mission is to create radically pragmatic ideas for moving America beyond ideological and partisan deadlock. Learn more about PPI by visiting progressivepolicy.org.
* Florida Wildlife Commission, using two-year averages as green turtle nesting totals appear to vary in a two-year cycle. These are not total statewide (or U.S.) nesting estimates, but counts of nesting at 27 long-studied beaches, making up a representative sample of known Florida nesting beaches. Total nest counts in 2022 were 37,000
WHAT THEY MEAN:
Here’s 17th-century British navigator/pirate/early naturalist William Dampier, on the Caribbean’s vast green turtle flotillas and the swarms of fish traveling in their wake:
“I heard of a monstrous green turtle once taken at Port Royal in the Bay of Campeachy [ed. note: then the capital of Jamaica] that was four foot deep from the back to the belly, and the belly six foot broad. … [M]ultitudes of Turtles go from their common places of feeding and abode, to those laying eggs: and at the time the Turtle resort to these places to lay their Eggs, they are accompanied by abundance of Fish, especially Sharks; the places that the Turtle then leave being at that time destitute of Fish, which follow the Turtle.”
By the mid-20th century the “multitudes of turtles” were nearly gone. When Florida wildlife staff began counting green turtle nests in the 1970s, they found only about 500 each year and sometimes fewer. NOAA’s unhappy summary reports a “catastrophic global decline of the species” with six causes: (a) “by-catch,” as turtles drown in nets towed by shrimp boats; (2) direct hunting, taking green turtles “in extraordinarily high numbers for their fat, meat, and eggs”; (3) loss of nesting grounds, through beach erosion, seawall construction, and bright hotel lighting that deter night-time nesting; (4) collisions with boats close to shore; (5) ocean pollution, in particular plastics and balloons; and most recently (6) climate change and warming ocean temperatures. The green turtles’ decline is typical: the International Union for the Conservation of Nature lists all seven sea turtle species — greens, loggerheads, leatherbacks, Kemp’s Ridleys, olive Ridleys, flatbacks, hawksbills — as either “threatened,” “endangered,” or “critically endangered.”
Some of these threats — floating plastics, warming water — are daunting, global-scale issues. Others seem cheap and simple to fix. Most countries, including the U.S., have banned turtle hunting for food and jewelry, and excluded turtle products from international trade in 1977 through the Convention on International Trade in Endangered Species. Congress in 1987 adopted a law requiring shrimp boats serving the U.S. — whether local or foreign — to equip their nets with “Turtle Exclusion Devices,” which are metal grilles with holes allowing unintentionally trapped turtles to swim out of the nets, costing $325-$550 each. (See below for the WTO’s record of a celebrated U.S.-Mexico trade dispute over the application of this regulation to foreign boats, which the panels eventually decided in favor of the U.S.) And the Florida government under Gov. Lawton Chiles in 1991, meanwhile, imposed beach protection rules and night-time blackouts during nesting months.
A generation later, these cheap and simple fixes look like they’ve worked. Florida’s green turtle nesting counts, measured in two-year cycles, show very strong recovery. The Florida Wildlife Commission’s most recent report, out early this year, shows an 80-fold increase in nesting counts since the early 1980s: a few hundred a year then, about 40,000 per year in 2021 and 2022. The official count for the 2023 nesting season won’t come out until early 2024, but individual beach counts suggest a boom year with as many as 70,000 nests. Nor again are green turtles unique; populations of the smaller and rarer Kemp’s Ridley turtle in Mexico has also rebounded, and the U.S Fish and Wildlife Service has successfully started a new Texas nesting ground.
Not yet anything on the scale of Dampier’s “multitudes”, of course. And looking ahead, the challenges of floating plastics and warming water aren’t simply and probably won’t be cheap. But nonetheless, after many bad decades. the turtles have had a few good ones.
FURTHER READING
Dampier’s A New Voyage Round the World (1699, Chapter 5) recalls the massive Caribbean turtle populations of the 17th century.
The Palm Beach Post reports a boom nesting season for 2023.
And the Florida Wildlife Commission reports on nesting totals for five turtle species at “index beaches” from 1989 forward.
Another example:
The Kemp’s Ridley turtle, a smaller species that is unique as a daytime nester, is the world’s most endangered turtle. Until recently, Kemp’s Ridleys nested only on three stretches of beach in Tamaulipas (Mexican Gulf Coast, just south of Texas), and are thus especially vulnerable to oil spills and habitat loss. KR nest counts declined by over 99% in the later 20th century, from 30,000-40,000 recorded in a 1947 count to 702 in 1985. Since then totals have rebounded to about 9,000 per year in Mexico, and the U.S. Fish and Wildlife Service has created a second nesting site on Padre Island in Texas, whose nest counts are up from an initial 7 to 353 last year. Background from FWS.
Policy:
The CITES (Convention on the International Trade in Endangered Species) homepage.
The State Department explains shrimping import and turtle conservation rules.
And the WTO’s record of “DS-58,” a five-year case eventually validating the U.S.’ application of TED requirements to foreign shrimping boats.
And some work to do in Asia, with some very modern advice from the classics:
And proto-conservationist Mencius, somewhere around 320 BC near present-day Kaifeng, has TED-like advice for King Hui of Liang:
“If you ban nets with fine mesh from ponds, there will be more fish and turtles than the people can eat. If you ban axes from the forests on the hillsides except in the proper season, there will be more timber than the people can use.”
Mencius, with the passage on nets, excluder devices, and turtles in Chapter A3.
ABOUT ED
Ed Gresser is Vice President and Director for Trade and Global Markets at PPI.
Ed returns to PPI after working for the think tank from 2001-2011. He most recently served as the Assistant U.S. Trade Representative for Trade Policy and Economics at the Office of the United States Trade Representative (USTR). In this position, he led USTR’s economic research unit from 2015-2021, and chaired the 21-agency Trade Policy Staff Committee.
Ed began his career on Capitol Hill before serving USTR as Policy Advisor to USTR Charlene Barshefsky from 1998 to 2001. He then led PPI’s Trade and Global Markets Project from 2001 to 2011. After PPI, he co-founded and directed the independent think tank Progressive Economy until rejoining USTR in 2015. In 2013, the Washington International Trade Association presented him with its Lighthouse Award, awarded annually to an individual or group for significant contributions to trade policy.
Ed is the author of Freedom from Want: American Liberalism and the Global Economy (2007). He has published in a variety of journals and newspapers, and his research has been cited by leading academics and international organizations including the WTO, World Bank, and International Monetary Fund. He is a graduate of Stanford University and holds a Master’s Degree in International Affairs from Columbia Universities and a certificate from the Averell Harriman Institute for Advanced Study of the Soviet Union.
The COVID-19 crisis put America’s nurses in the national spotlight. Nurses were some of the most essential heroes of the pandemic — working long hours, putting their health at risk and bearing the emotional strains of more than 1 million deaths. Nurses across type and specialty demonstrated a commitment to public health and safety, reminding us of the importance of having a robust nursing workforce across U.S. communities — so that Americans are in good hands when the next public health crisis occurs.
However, that assurance may be far from reality. Currently, the U.S. has a shortage of 100,000 nurses. While this number is small compared to other industries, and the health care industry at large is seeing job growth in recent Bureau of Labor Statistics (BLS) projections, these numbers don’t represent the full picture.
A recent study by the National Council of State Boards of Nursing found that 610,388 nurses say they want to leave the field by 2027. This report found that high workloads and unprecedented levels of burnout from the pandemic have resulted in higher levels of turnover for young nurses and early retirements for those later in their careers. At the same time, the demand for health care services is increasing as the U.S. population ages. BLS projects that employment for registered nursing will grow 6% from 2022 to 2032, or roughly 193,100 jobs per year to meet this demand — equating to about 2 million more nurses. This growth is faster than the average for all other occupations.
The Conservative Party is haemorrhaging working-class votes across the country under Rishi Sunak’s leadership, particularly those of working age, with Keir Starmer’s Labour Party on course to reverse its historic decline with working-class voters.
New research released by the Progressive Policy Institute on the eve of the Labour Party Conference in Liverpool shows that the voters that were so crucial to the Conservatives’ majority at the 2019 general election are abandoning the party. Only 44% of working-class voters who voted Conservative in 2019 say they will vote for them next time. 74% of all those polled describe the Conservatives as not close to working-class people, strongly associating them with wealthy individuals and big business.
Under Keir Starmer’s leadership, Labour is on course to turn around its historic decline amongst working-class voters – but Labour’s lead is much narrower with working-class voters than the wider electorate, with many yet to make up their minds on who to vote for. The research reveals that those who are feeling more optimistic about the year ahead are more likely to vote Conservative; however, there are far fewer of them than those who are pessimistic about the year ahead. Overall, working-class Britons believe almost everything is going to get worse, including all of Prime Minister Rishi Sunak’s pledges: the rate of inflation, the cost of living, NHS waiting lists, climate change, their personal financial situation, the number of people arriving in small boats, the level of national debt, and the country’s financial situation.
In the report, ‘Roadmap to Hope: how to bring hope back to working-class voters in an age of insecurity’, project director and former policy director to Keir Starmer, Claire Ainsley, argues that Labour must redouble its efforts to reach disaffected working-class voters as it eyes a general election campaign, with concrete plans to ‘remake the deal’ for working people.
The report includes exclusive comparative analysis of the electoral coalitions of centre-left parties around the world by Professor Oliver Heath for PPI, which shows that far from the base of social democratic parties moving uniformly to middle-upper earners, those on low to middle incomes still form the social base for winning centre-left parties. The UK Labour Party has a particular challenge to attract older voters, compared to its centre-left contemporary parties around the world.
Overall economic concerns and policies to address them, such as controlling energy bills and inflation, are much more important to working-class voters than cultural issues that have gained disproportionate media attention. However, tackling illegal immigration and crime are highly salient for working-class voters. 59% tended to agree that you get less in return for working hard than you did a decade ago, compared to 12% who said you get more in return.
‘Under Keir Starmer’s leadership, Labour is on course to win over working-class voters who have been so failed by the Conservatives. They are feeling pretty pessimistic about the future, so the task for Labour is to inspire hope and belief that the deal can be re-made whereby if you work hard, you get on. That rests on offering concrete plans to improve people’s security and their prospects, and restore a sense of basic fairness to the economy and society’, said Claire Ainsley, Director of PPI’s Centre-Left Renewal Project.
The report includes PPI’s practical ideas to ‘re-make the deal’ for working people:
1. Relentless focus on raising wages for those on low to middle incomes.
2. Stabilise supply and costs of essential goods and services.
3. Open up housing investment to the next generation.
4. Reform school education to become the driver of progress.
5. Replace ‘one rule for them’ with ‘same rules apply’.
More working-class voters said the government is not doing or spending enough to try and reduce carbon emissions (34%), compared to those saying they are doing too much (25%), or getting the balance about right (16%), showing the awareness of climate action across all social groups. That said, they have a clear view when it comes to who pays: 53% agreed that it is important to combat climate change but ‘people like me should not be paying the cost of policies to reduce global carbon emissions’, whilst 16% said they would be prepared to pay some costs and 19% said they do not believe climate action is necessary.
PPI’s new Project on Centre-Left Renewal resumes our long-running conversation with centre-left parties in Europe and around the world. Its purpose is to exchange ideas, strategies and tactics for making centre-left parties more competitive and improve their governing performance.
The Progressive Policy Institute (PPI) is a catalyst for policy innovation and political reform based in Washington, D.C., with offices in Brussels, Berlin and the United Kingdom. Its mission is to create radically pragmatic ideas for moving America beyond ideological and partisan deadlock. Learn more about PPI by visiting progressivepolicy.org.
For many people, the economic and political turbulence of these past few years have made it a whole lot harder to achieve their hopes and dreams.
Every time inflation rises or mortgage costs escalate, the choices available get much more limited. Whether it’s buying a new home, retraining for a job you really want, or booking the holiday you’ve worked so hard for. The deal whereby if you work hard and do the right thing, you can achieve what you set out to, seems broken through a combination of failing markets, creaking public services, and politics unable to rise to the challenges of our times. This sense of insecurity – not knowing what the future holds – now seems semi-permanent.
This deeper-rooted belief that our governments don’t work in the interests of ordinary people has fuelled the rise of right-wing populism in many of our nations, which despite some recent success of centre-left parties, continues to gain ground. Even where right-wing populists remain at the margins, their effect on mainstream politics and society is being felt. And where the centre-left has won power, it is proving difficult to achieve more durable electoral majorities amongst a fragmented electorate, under siege from the scare tactics of the right.
The only way out of this is for the political centre-left to present and deliver a more unifying, compelling, and credible alternative to the extremities and their mainstream copyists, rooted in the hopes and dreams of ordinary people.
In January 2023, the Progressive Policy Institute launched a new project on the political renewal of the global centre-left. This report shares comparative analysis of centre-left voters, and how electoral strategies can build more sustainable coalitions.
The politics of a winning centre-left isn’t the triumph of reassurance over hope; it is reassurance so that people can realise their hopes and dreams again. The centre-left needs to reclaim hope and aspiration as well as offering security and reassurance, and in so doing, bring hope back to the many millions who deserve to have their faith restored.
Voters in the UK and beyond are looking again at what centre-left parties have to offer. But progress will only turn into lasting success if once in government, our parties are judged by voters to have met their economic, social and cultural needs and interests. This report, and PPI’s work, is in service of that goal.
A spate of recent polls showing President Biden either tied with or falling behind Donald Trump has some Democrats in a swivet. How could Biden be trailing a fabulist he’s already beaten, who’s facing 91 felony charges, and whose business empire may be crumbling around him?
It’s a good question. Today’s polls aren’t predictive of an election that’s more than a year out. But they are indicative of how little headway the president and his party have made since 2020 on their central political challenge: enlarging their party by winning back working class voters.
Luckily for them, a lifetime of deceit continues to catch up with Trump. A New York Supreme Court justice has ruled that his real estate companies defrauded banks and insurance companies by ludicrously overstating their properties’ value. The judge yanked their licenses to do business in New York and said he’d appoint a receiver to dismantle them.