A quick response after reading last Wednesday’s lengthy, startling, and troubling letter from Sen. Elizabeth Warren and Rep. Pramila Jayapal to Commerce Secretary Gina Raimondo: Don’t charge people with bad faith unless you have evidence of it. Progressives can do better.
By way of introduction, the two Members’ letter continues a correspondence begun in July whose point of departure is a disagreement on digital trade policy matters such as cross-border data flows, divergences in national privacy regulation, and data localization. Sen. Warren and Rep. Jayapal object along left-populist lines to potential Biden administration negotiating positions on some of these topics in trade venues such as the Indo-Pacific Economic Framework and U.S.-EU Trade and Technology Council.
Were these disagreements the core of their letters, this would be the standard stuff of Congressional correspondence and advocacy. Digital trade issues are intellectually and technically complex. Conclusions about the best way to define U.S. interests on them can vary in good faith. And while Sen. Warren and Rep. Jayapal may be mistaken, dissent is perfectly legitimate and their rights to their opinions are obvious.
But the core of their letter is not the substance of policy but an insinuation – unsupported by evidence – that the Commerce Department is forming its positions in an improper or even a corrupt way and is likely pursuing specifically tech-industry goals rather than acting on good-faith Biden administration judgments about American interests. The letter uses two quite troubling lines of argument to back this up:
(1) Charges without evidence: For the Commerce Department as a whole, the letter notes that “several former employees” of tech firms work at the Department, and uses this bare fact to claim that “Big Tech” has an “untoward influence” on trade negotiations and may be “exploiting the revolving door with the Department” to set policy from outside. Apart from noting that several Department officials once held tech-sector jobs, the letter provides no evidence that the Commerce Department has taken any decision on any grounds other than its best assessment of U.S. interests and policy goals.
(2) Guilt by association: For individual officials, the letter cites past tech sector employment as evidence of “Big Tech’s current influence within the Department”, and a likelihood that “the Department’s revolving door with Big Tech firms will provide those companies the avenue they need to push their proposals across the finish line.” That is to say, some Department officials are pushing for goals they know are not in the general interest. Again, the letter does not cite any specific case in which any individual might have acted in bad faith, or provided advice that he or she did not sincerely view as good policy
The October letter, as did the July letter, then concludes by asking for lengthy lists of names – all Commerce appointees and civil servants who have previously held tech-sector jobs; all who left the Department after President Biden’s inauguration for tech-industry work – and accompanying lists of all tech-industry meetings these officials attended, or for which they helped in preparation and follow-up work. Again, no such list would provide any evidence of bad faith or improper policymaking.
Two thoughts on this:
First, as a practical matter, the letters’ premise leads to an absurd conclusion about policymaking and government personnel. To wit, U.S. government agencies should never employ people from sectors in which they have any oversight or policy responsibility, because such a person will inevitably put the interest of former employers above the national interest and his or her sworn duties. Applied to the Department of Agriculture, for example, such a standard would bar hiring farmers or people who might want to work in production agriculture later on. At the Centers for Disease Control, the presumption would be against hiring doctors and public health professionals. The Labor Department would likewise be well advised to avoid union members, and the Transportation Department should steer clear of airplane pilots and bridge architects, and even the Justice might need to stay away from anyone with a law firm background.
Second and more fundamentally, this premise – past employment with tech firms should entail presumption of bad-faith policymaking, and the Department and the individual officers need to disprove it – is wrong and unfair. Accusations of bad faith policymaking should require evidence of wrongdoing. American government officials, whether civil servant or political, qualify for their jobs based on three things: (1) they take an oath of office; (2) they pass an FBI security clearance investigation at the appropriate clearance level; and (3) they understand and respect national ethics laws and administration policy, for example by recusing themselves in cases these laws and policies define as posing a conflict of interest. If there is evidence that any official has fallen short on these responsibilities, provide it. If not, keep your argument to the merits. But neither letter provides any evidence that any Administration official has fallen short on any of these responsibilities.
The digital trade agenda as such is important in immediate economic terms, and more basically as a question of future world Internet policy. Obviously it has lots of implications for growth, for science, and for individuals. There’s no reason to shy away from spirited debate over it. But there’s also no reason at all to substitute attacks on character and integrity for this sort of debate. Progressives really need to do better.
The 164 WTO members, having agreed in June on a five-year waiver of patent rules for COVID-19 vaccine production, are discussing a next question: should a similar waiver apply to a wider array of “therapeutics and diagnostics”? Their self-imposed decision point for this is December 17th. As this date approaches, some background on the WTO’s intellectual property rules, their aims, and their possible effects:
Per the U.S. Constitution, the core goal of intellectual property laws is “[t]o promote the Progress of Science and useful Arts, by securing for limited Times to Authors and Inventors the exclusive Right to their respective Writings and Discoveries.” U.S. laws on these topics date to the 1790s; international IP agreements and treaties, to 1883 for patents and 1887 for copyright. The WTO’s 73-article IP agreement, known as the “Agreement on Trade-Related Aspects of Intellectual Property Rights” or “TRIPs,” dates to 1995 and requires WTO members to adopt baseline IP patent, copyright, and trademark laws, enforcement procedures, and so on. Subsequent decisions provide exemptions for patenting rules for least-developed countries, and note that TRIPS rules do not prevent WTO members from acting on public health emergencies. Two data points on the intervening 28 years:
Research and Development: R&D spending, according to a World Bank database, averaged 1.97% of world GDP* in the mid-1990s. Between 2018 and 2020, R&D averaged 2.39% of world GDP. In practical terms, this now means about $2.5 trillion per year. Had the 1.97% figure remained constant, therefore, world governments, businesses, and universities would be spending about $400 billion less per year on science. By income group, high-income country R&D spending has risen from 2.3% of GDP to 2.8%. Low- and middle-income country spending has grown a bit faster, from 0.65% of GDP in 2000 (the first year in the World Bank’s database) to an average of 1.6% in 2018-2020. Based on the estimates in the table, about half of low-middle income country R&D spending growth was in China, and half in other countries.
Patenting: More research does seem to have meant more new inventions, or at least more patent awards. The World Intellectual Property Organization in Geneva reported 943,000 applications for patents around the world in 1994, 2.0 million applications in 2010, and nearly 3.3 million in 2020. The rise in actual patent grants has been faster, up four-fold from 450,000 patent awards in 1994 to 1.6 million in 2020: mRNA vaccines, touch-sensitive glass for smartphones, disposable satellite-launch rockets, biodegradable garbage bags, etc.
What to make of this? Causality is obviously hard to determine, and to some extent R&D investment likely rises with national wealth as well as responding to IP incentives. But the post-TRIPS world does appear to be one in which, as the Constitution’s references to incentives for useful Arts and Sciences” hoped, investment in science has grown (and grown especially rapidly in developing countries) and new inventions have cropped up.
Turning back to the WTO and its next steps, the June waiver for COVID vaccines is a highly specific one, and consistent with the existing 2005 “Declaration on TRIPS and Health,” on action during public health emergencies. No country so far, however, appears to have used this waiver (and the U.N.’s voluntary Medicine Patent Pool has arranged voluntary production licenses for 14 COVID medicines and therapies). This seems to indicate that the major challenges in raising vaccination rates are related to logistics and delivery to patients in low-income countries rather than to IP rules. “Diagnostics and therapeutics” are less specific terms, suggesting that a waiver for these products could apply to a variety of multipurpose medical devices and medicines yet to be invented. The data on R&D and patenting, meanwhile, suggest that the TRIPs agreement has at least contributed to a long-term upturn in scientific research and invention, a public good well worth preserving; which makes this next decision one that raises some systemic questions.
* The World Bank reports R&D spending at 2.33% of GDP in 2019, and 2.63% in 2020. We’re using a recent average on the assumption that the large one-year jump in 2020 was not an actual R&D increase but a COVID-related anomaly, reflecting less a jump in actual R&D than the temporary GDP effect of closing restaurants, hotels, construction sites, etc. for public health reasons.
FURTHER READING
TRIPS:
The World Trade Organization’s TRIPS page, with links to the agreement text, the 2005 Declaration on TRIPS and Health, and other matters.
… and the waiver for Covid-19 vaccine explained, with a link to text.
Medicines and COVID vaccination:
Tracking vaccinations by country and income level, ourworldindata.orgreports 4.74 billion people fully vaccinated as of the WTO’s June Ministerial, and 4.95 billion now.
Alternate approach: The WTO waiver authorizes “compulsory licensing” of medicines. The UN’s Medicine Patent pool, based on voluntary licensing agreements with companies, government science agencies, and nonprofits, now covers 14 COVID-19 vaccinations and treatments.
Research and Development:
The National Science Foundation reports on R&D spending among the top 8 R&D countries (U.S., China, Japan, Germany, U.K., France, Korea, India). At 3.5% of GDP, the U.S. is the world’s fourth-most R&D intensive economy; Israel is first at 5.4%, followed by Korea.
The World Bank has figures worldwide, by country, and by country categories (“low- and middle-income”, “Latin America and the Caribbean”, “Arab states”, and so on).
Patenting:
The World Intellectual Property Organization — WIPO, which continues to oversee the descendants of the 1883 Paris Convention on patenting — maintains a database which tallies patent applications and grants worldwide. The trend for grants post-1994:
And for comparison, the U.S. Patent and Trademark Office’s tallies of patent awards by year and origin. They count 388,000 patent grants in 2020, including 183,000 to U.S.-based applicants, and 205,000 to applicants abroad. Over a quarter of the foreign grants, 53,770, went to Japanese applicants. PTO’s tables.
A sample: A Corning fiber-optic cable patent, granted in 2001 and expiring last May.
IP Income:
According to the Bureau of Economic Analysis, revenue from overseas use of U.S. inventions (including trade secrets as well as patents) was $56.4 billion in 2021, or about two-fifths of $125 billion in total U.S. overseas IP revenue. This is about equal to the U.S. export figures for automobiles or of microchips. Worldwide, WTO’s figures on IP revenue show a global total of $470 billion in 2020, with the U.S. accounting for $144 billion or 31%. The EU was next at $90 billion, followed by Japan at $43 billion. By way of comparison, in 2020 top manufacturing exporter China had 19.7% of world manufacturing exports; the U.S. led in energy and agriculture, with respectively 8.6% and 9.4%. The WTO data here.
And the Bureau of Economic Analysis’ services database has U.S. IP receipts and payments, by country and type.
ABOUT ED
Ed Gresser is Vice President and Director for Trade and Global Markets at PPI.
Ed returns to PPI after working for the think tank from 2001-2011. He most recently served as the Assistant U.S. Trade Representative for Trade Policy and Economics at the Office of the United States Trade Representative (USTR). In this position, he led USTR’s economic research unit from 2015-2021, and chaired the 21-agency Trade Policy Staff Committee.
Ed began his career on Capitol Hill before serving USTR as Policy Advisor to USTR Charlene Barshefsky from 1998 to 2001. He then led PPI’s Trade and Global Markets Project from 2001 to 2011. After PPI, he co-founded and directed the independent think tank Progressive Economy until rejoining USTR in 2015. In 2013, the Washington International Trade Association presented him with its Lighthouse Award, awarded annually to an individual or group for significant contributions to trade policy.
Ed is the author of Freedom from Want: American Liberalism and the Global Economy (2007). He has published in a variety of journals and newspapers, and his research has been cited by leading academics and international organizations including the WTO, World Bank, and International Monetary Fund. He is a graduate of Stanford University and holds a Master’s Degree in International Affairs from Columbia Universities and a certificate from the Averell Harriman Institute for Advanced Study of the Soviet Union.
Over the last two years, Congress has passed a series of landmark bills that together fund more than $500 billion in clean energy investment, by far the largest ever enacted. More importantly, generous tax incentives can spur many trillions in direct private sector investments, creating a powerhouse U.S. advanced energy sector. Yet, right now, a broken U.S. energy permitting system short circuits thousands of major projects, imposing tremendously high costs in time and money to build clean infrastructure projects, if they get built at all.
Congress had an opportunity to fix this roadblock through a permitting reform bill, but despite claiming to support reform, Senate Republicans effectively killed the measure in a nakedly political effort to deny Democrats a popular policy win. Democrats should turn the tables on the GOP, making the economic and climate costs of this hypocritical action a major campaign issue in the upcoming midterm elections.
Ironically, in the name of environmental protection, a perverse process has developed over decades whereby often unnecessary and duplicative government reviews and nuisance lawsuits have pushed average time for permitting to 4.3 years for electricity transmission, 3.5 years for pipelines and 2.7 years for renewable energy generation projects. In the mid-Atlantic and near-Ohio valley alone, more than 2,500 projects are awaiting approval, 95 percent of which involve renewable energy. In fact, a new Progressive Policy Institute (PPI) report finds that without extensive permitting and regulatory reforms, large projected economic benefits and emissions reductions from recent laws would be substantially limited, and fail to meet policy goals.
LIVERPOOL, England — Brexit is done, and Donald Trump, given the boot by U.S. voters, is angrily pacing the political sidelines. But the upsurge of rightwing populism that produced them both continues to roil transatlantic politics.
Last Sunday, the far-right Brothers of Italy party, which has a fascist lineage, finished first in national elections. Its leader, Giorgia Meloni, will become Italy’s first female prime minister. She’s a socially conservative Christian who opposes immigration, abortion and LGBTQ rights. Although she’s toned down her Euroskepticism, Meloni also is an “Italy First” nationalist likely to align with illiberal regimes in Poland and Hungary.
A virulent strain of national populism also is advancing in Europe’s social democratic heartland. The Sweden Democrats (SD), formerly a fringe party with neo-Nazi roots, finished a strong second in national elections earlier this month and will join a right-leaning government.
The Progressive Policy Institute (PPI) recently commissioned a national survey by IMPACT Research of midterm voters’ attitudes on competition issues across a variety of industries. The survey found that a large bipartisan majority of voters are not focused on competition issues and do not want Congress or the federal government to take new regulatory action within the beer industry, as outlined in the Treasury Department’s February 2022 report. The polling finds that inflation is top of mind for likely 2022 voters and they generally don’t blame companies for high prices across industries.
“This data shows that overwhelmingly, voters want Congress and the Biden Administration to focus on inflation and the rising cost of living — and not on imposing unnecessary regulations on successful U.S. companies and a thriving industry. Americans have more choices for beer and more opportunities to buy from different brewers than ever before, with over 9,000 in the U.S. alone,” said Lindsay Mark Lewis, Executive Director at PPI. “This isn’t the time or place for the White House to raise prices on working families.”
Inflation continues to be the top priority of voters ahead of the 2022 midterm elections, while increasing competition between big companies ranks last. According to IMPACT Research’s findings, voters have concerns that new rules or regulations would raise the price of beer. PPI found in September 2021 that beer actually had a low rate of inflation compared to the overall price levels for personal consumption expenditures.
The memo on this exclusive polling can be found here.
The Progressive Policy Institute (PPI) is a catalyst for policy innovation and political reform based in Washington, D.C., with offices in Brussels and Berlin. Its mission is to create radically pragmatic ideas for moving America beyond ideological and partisan deadlock. Learn more about PPI by visiting progressivepolicy.org.
FACT: U.S. trade with Russia is down by 80% since February.
THE NUMBERS: American imports from Russia, 2022 –
January: 8.3 million barrels of crude oil, 35,700 carats of diamonds, 2,100 tons of Arctic crab June: 0 barrels of oil, 0 carats of diamonds, 0 tons of Arctic crab
WHAT THEY MEAN:
Reporting on the impact of sanctions, war, and conscription on Russia now tends by force of circumstance to be anecdotal, sometimes hard to verify, and relate to larger systemic trends: A tank factory halting production in March as a result of parts shortages, retail chains and international auto manufacturers departing, 98,000 young Russian men leaving for Kazakhstan last week and lines of cars at Georgian and Mongolian border crossings, and so on. Macro forecasting provides some context for these individual stories but is very abstract: The International Monetary Fund’s World Economic Outlook update this July projects a contraction of -6.0% this year (comparable to the 2008 financial crisis experience) and -3.5% in 2023.
Visible trade flows also provide only a partial picture (and an unusually limited one since Russia has declined to publish monthly trade data since the invasion), and can perhaps bolster anecdotes and macro vistas with some of the information in between. Two international sources, and a more detailed look at the post-February trends in U.S.-Russia trade flows, seem to show (a) a significant, but far from total disengagement, from world goods trade, and (b) in the context of the IMF’s overall prediction, probably a sharp domestic-economy effect given that Russia’s energy revenue remains high:
(1) The IMF’s “Direction of Trade Statistics,” a standard source for top-line goods trade totals, has country-by-country data for exports through May of 2022. Their figure for “world exports to Russia” reports $23.6 billion in exports to Russia in January, and $14.6 billion — i.e. a drop of about 38% — in May. Reporting on individual countries suggests that this may understate the total decline in Russian imports, as the IMF database finds Chinese exports to Russia down from $7.3 billion in January to $4.3 billion in May, the EU’s from $8.1 billion to $4.2 billion, Japan’s from $600 million to $190 million, Korea’s from $813 million to $339 million. These trends are not universal; Kazakhstan’s and Turkey’s Russia export figures, though smaller than those of the big economies, were both slightly up. The database unfortunately does not seem to have 2022 figures for “imports from Russia.”
(2) Analysts at Bruegel, an economic think-tank in Brussels, carry this a bit further, collecting national trade data through June from 34 countries accounting for about 75% of Russian trade, and adding imports as well. This concurs with the IMF’s less up-to-date finding, with Russian purchases from the relevant countries dropping from $18 billion in January to a low of $8 billion in April, then bumping up to $12 billion in June. Bruegel finds Turkey the only major economy whose Russian exports are at or above pre-invasion levels. Russia’s sales to other countries have been less affected: Russian energy exports rose a bit as world prices rose (from $26 billion in January to $27 billion in June, with the other months in between), but non-energy exports dropped by slightly more, from $17.5 billion to $13.4 billion. This matches EU data, showing less purchasing of Russian manufactures and farm products offsetting higher energy prices.
(3) The U.S. data is complete through July and quite detailed, showing drops of 80% in both the export and import accounts. U.S. exports to Russia have dropped from $500 million to $83 million, with sales to Russian industrial buyers now close to zero: semiconductor sales, for example, fell from $8 million in January to $0.25 million in July, computer equipment from $8.3 million to $0.4 million, motors and generators from $6 million to $0.2 million. The remaining significant U.S. exports to Russia appearing to be mostly medicines and medical equipment. Imports are likewise down by about 80%, from $2.5 billion in February to $484 million in July. The month-by-month figures looks like this, with energy-price related jumps in February and March followed by steady decline:
Overall, energy and luxury-good bans have eliminated almost all U.S. purchases of Russian oil and gas, diamonds, and seafood. The remaining Russian exports to the U.S. are mostly metals (exempted in most cases from the import bans and also little affected by withdrawal of MFN tariff rates) and fertilizer. Aluminum imports in fact are up from $41 million to $89 million, and nickel from $9 million to $52 million.
As with the macro forecasts and anecdotal reporting, the goods-trade figures suggest an economy (a) contracting sharply though not in free fall, (b) continuing to raise money through energy sales, and (c) possibly seeing somewhat sharper industrial declines than the macro figure suggests.
FURTHER READING
Big Picture:
The IMF (July) projects a contraction of Russian economic contraction of -6.0% this year.
Data:
Census’ basic month-by-month data on U.S.-Russian trade.
Bruegel analysts Zsolt Darvas and Catarina Martins review Russia import, export, and balance data for 34 countries. Sharp drop in imports, exports steadily more concentrated in energy, trade balance a secondary issue.
The IMF’s somewhat challenging “Direction of Trade Statistics” database.
Ed Gresser is Vice President and Director for Trade and Global Markets at PPI.
Ed returns to PPI after working for the think tank from 2001-2011. He most recently served as the Assistant U.S. Trade Representative for Trade Policy and Economics at the Office of the United States Trade Representative (USTR). In this position, he led USTR’s economic research unit from 2015-2021, and chaired the 21-agency Trade Policy Staff Committee.
Ed began his career on Capitol Hill before serving USTR as Policy Advisor to USTR Charlene Barshefsky from 1998 to 2001. He then led PPI’s Trade and Global Markets Project from 2001 to 2011. After PPI, he co-founded and directed the independent think tank Progressive Economy until rejoining USTR in 2015. In 2013, the Washington International Trade Association presented him with its Lighthouse Award, awarded annually to an individual or group for significant contributions to trade policy.
Ed is the author of Freedom from Want: American Liberalism and the Global Economy (2007). He has published in a variety of journals and newspapers, and his research has been cited by leading academics and international organizations including the WTO, World Bank, and International Monetary Fund. He is a graduate of Stanford University and holds a Master’s Degree in International Affairs from Columbia Universities and a certificate from the Averell Harriman Institute for Advanced Study of the Soviet Union.
Online platforms face an increasingly complex regulatory environment in the European Union. Altering their business models to comply with EU regulation while simultaneously experiencing intense scrutiny from competition authorities, American tech companies are being pushed to evaluate their profitability in Europe. Yet, proposals circulating within the EU are seeking to capitalize on this profitability by taxing these same companies to subsidize broadband infrastructure expansion.
While the sector is currently engaging in high levels of investment and enjoying consistent revenue growth, the notion that any industry can withstand significant taxation on top of mounting regulatory compliance costs threatens both the jobs created by the sector and the promise of future investment. These are circumstances that the European telecommunications industry knows well. With amassed regulation corresponding to relatively weak revenue growth over time, EU telcos have struggled to invest in the development of new high speed network technology such as 5G at the same rate as their counterparts in the United States and China. As high-capacity networks become the norm for consumers who rely on data-heavy services like streaming high-quality video and video conferencing tools, Europe risks being left behind in the next era of technological innovation. Though plagued with its own set of problems such as the ongoing debate over net neutrality, the U.S. telecommunications industry has managed to sustain a high level of investment, resulting in widespread 5G infrastructure and connectivity. Concurrently, European telcos have faced weak revenue growth and difficulty translating the demand for online services into a demand for new subscriptions.
Despite the apparent lag, the European Union’s “Plan for the Digital Decade” has set the goals that by 2030 every home in Europe will have Gigabit connectivity and every populated area of Europe will have access to 5G service. While this sounds like a great leap forward in digital expansion, the reality is that each of these goals presents a massive capital investment challenge to European telecommunications companies. Aware of this funding gap, the governments of France, Italy, and Spain released a joint paper in August 2022 calling on the European Commission to craft legislation requiring large online platforms pay a “fair share” of network infrastructure in Europe. EU regulators and industry groups such as the European Telecommunications Network Operators’ Association have echoed this proposal, with the idea being that the growth of these online platforms is dependent on the quality of network infrastructure. They make the claim that “over-the-top” (OTT) companies such as Google and Netflix need improved networks because of the data-intensive nature of their content and should thus contribute to the cost.
But there are regulatory factors preventing European telecommunications companies from accruing the revenue needed for significant network infrastructure investment which additional regulation will not solve. A recent letter signed by 13 European telecom CEOs points out the harm that EU price regulation causes to the competitive market for telecom services, 4 and major operators such as Vodafone have been vocal in their calls for market consolidation to support the scale needed for companies to invest in network expansion. In light of this, those calling for similar action against the tech sector should evaluate whether an additional tax in the face of strict competition guidelines and increasing regulatory hurdles will result in more network investment in the long run, or similarly impair the ability of the tech sector to contribute. This report offers a comparative analysis of the performance of the U.S. and European telecommunications industries, focusing specifically on their ability to achieve widespread high-speed network connectivity to examine the relationship between capacity for investment and heavy regulation. It finds that U.S. companies generally have had greater success in terms of connectivity and services speeds while Europe’s emphasis on low consumer prices may have resulted in underinvestment in its telecommunications sector. It recommends that for Europe to realize its full potential in terms of future technological innovation, the EU must adjust its regulatory policies to acknowledge the trade-off between low prices and investment, avoiding overregulation of high investment industries and supporting a sustainable digital transition for EU’s telecommunications industry.
COMPARING TELECOMMUNICATIONS MARKETS IN THE UNITED STATES AND EUROPEAN UNION
Over the last decade there has been a global shift in consumer preferences from a reliance on voice-enabled communication to more data-driven internet services such as online messaging and video-calling. The consequence has been a shift in profitability from telecommunications operators to companies which operate internet platforms.
This trend is evident when looking at the percentage of profit held by telecom companies and internet platforms over time. Combining the telecom and internet sector, the global industry had a cumulative profit of $251 billion in 2014. Of this, 74% was profit by telecom companies, leaving the remaining 26% as the profit made my internet platforms. Just five years later, the cumulative profit remained similar at $260 billion, but internet companies now accounted for 60% of the profit.
However, when looking at the telecom industry with a more regional lens, this loss in revenue may not be equally distributed across all telecommunications markets. Though they face similar challenges, there’s a difference in capital investment and subsequent levels of connectivity when comparing the United States and Europe.
Capital Investment by Telecom Operators
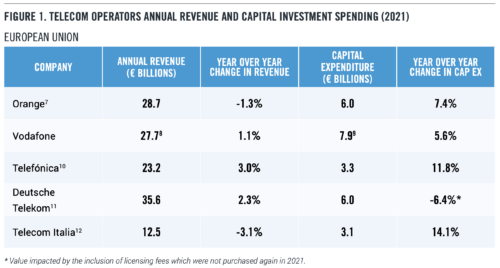
Telecommunications is a capital-intensive industry which requires continuous investment to maintain and develop efficient networks able to meet the challenges of rapidly evolving technology. With the struggle to reach new consumers looming over these companies, revenue growth is slow across the industry. However, while a handful of top European telcos experienced negative revenue growth in 2021, top American telecom operators grew a minimum of 4% — with T-Mobile’s U.S. division experiencing growth of almost three times that.
Figure 1 displays five of the top telecom operators by annual revenue in the European Union and United States, as well as their 2021 capital expenditure. Displayed are only the revenue and expenditures of these companies as they relate to telecommunications — excluding other lines of business. This data is reflective only of the company’s activity within the United States and EU member states and thus does not encompass global operations. Discrepancies such as the inclusion of spectrum licensing fees and inclusion of small amounts of overseas data may be present based on a company’s methods of reporting.
Despite the wavering profitability of the telecom business model globally, American companies are experiencing higher rates of revenue growth and therefore have the wherewithal to boost their capital spending on broadband. Many companies’ annual reports note that a significant amount of this expenditure is being directed to the expansion of 5G networks in the U.S., increasing American capacity for data intensive services. European consumers are not benefitting from the same level of investment in high-capacity networks, and European telecom operators are not experiencing the revenue growth required to catch up.
Service Speeds and Connectivity
The heightened need for investment in network infrastructure comes as global online traffic increased roughly 60% in 202018— tasking the telecom industry with ensuring not only widespread connectivity but that their networks have the bandwidth for high levels of consumer use. European networks were not prepared for the surge in online activity, making bandwidth comparatively scarce. As a result, in 2020 the EU called on streaming platforms to lower the quality of their video streaming services to reduce the bandwidth needed to bring video to consumers. In response, platforms such as Netflix and YouTube lowered the quality of video offered to consumers in certain European countries, lightening bandwidth needed to use their services to free capacity for other users.
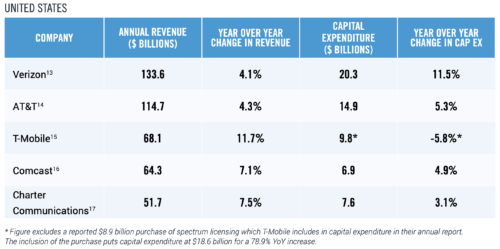
But bandwidth has not been the only challenge. The EU also trails behind the United States when it comes to levels of coverage. Though by 2020 Europe had begun to match the U.S. on the percentage of households covered by broadband networks, there are still disparities in levels of rural and high-speed coverage. The following figure considers connection to be “high speed” if it allows download speeds above 30 Mbps. In the U.S. in 2020, 98% of all households were covered by high-speed broadband, while in Europe only 87% percent of households had access to the same speeds. This is largely driven by the lack of high-speed connection in rural areas of Europe.
When it comes to internet connection speeds, America holds a substantial lead. Median download speeds in the United States more than quadrupled in the period between 2017 and 2020, when download speed grew by 157.7% year over year. Europe’s median speed also increased with a year over year growth rate of 76.2%, but this still left them lagging substantially behind. In 2021, the U.S. median of 83 Mbps was more than double the EU’s median of 38 Mbps. Only four European cities (Copenhagen, Stockholm, Bern, and Budapest) had reported median download speeds faster than the nationwide median reported stateside in 2021.
The United States has also pushed deployment of advanced networks, including fiber optics, at a higher rate than in Europe (see Figure 2). In general, American consumers are more likely to opt into internet subscriptions with higher service speeds. A study by USTelecom found that in 2020, 55% of connected U.S. households had subscriptions with speeds reaching at least 100 Mbps, while only 34% of connected European households had subscriptions capable the same speeds. Whatever the reasons for this wide performance gap, it’s clear that the United States proved better able to support surging demand for online services and commerce during the pandemic.
Differences in the Price of Service to Consumers
One metric by which the European telecom industry has the upper hand is prices paid by consumers for internet services. A study by New America’s Open Technology Institute found that in 2020, the average monthly cost of internet service in Europe was $44.71, compared to $68.38 in the United States.
During a period of global inflation there is considerable value in the EU’s prioritization of maintaining low costs to consumers who are juggling rising prices across other sectors. In the context of analysis of the sustainability of the telecommunications industry, however, is important to take account of the trade-offs associated with low prices. European telcos exhibit lower revenue growth, lower levels of capital investment and lower rates of high-speed connectivity than their U.S. counterparts. As Figure 2 shows, the United States also has a significantly higher proportion of rural households with access to high-speed broadband. Rural broadband comes at a high cost to the network operator. As companies expand coverage into less dense areas, the average cost per potential customer rises. Sparsely populated areas don’t provide companies with the return on investment through user fees needed to cover the cost of that network expansion. This generates pressures for both government subsidies and price hikes. Rural regions often also present geographic challenges, both in terms of remote locations and rough terrain for laying cables, further raising the cost to companies.
Prices in the European Union are also lower because of more aggressive regulatory intervention. Europe has maintained a stricter approach to competition policy in the telecommunications industry, contributing to the lower prices when compared to the more consolidated American sector. Additionally, regulations like the EU’s “roam like at home” policy, which requires telcos based in one country to provide service across borders within the European Union at no additional charge, also keep prices down — protecting consumers from predatory behavior by companies overcharging for roaming fees but at the expense of the profits firms need to make robust investments in high-speed networks.
Adoption of 5G Service
With the newfound prominence of data services, the telecommunications industry has largely looked to rising demand for 5G to fill the hole in revenue created by consumer preferences shifting away from traditional telephone lines and voice traffic. 5G technology is integral to business innovations such as driverless cars, virtual reality-based platforms like the Metaverse, the development of more integrated smart cities, and other Internet of Things applications. But many of these products are in their infancy, meaning that for consumers who would be accessing 5G networks from smartphones, which operate just as effectively on lower capacity networks, the benefits of 5G are relatively intangible. Without consumer need for these networks, the incentive for companies to invest the capital required for widespread deployment is low.
Still, European companies have joined their international counterparts in deploying 5G technology in preparation for that next wave of consumer tech products. The industry association GSMA estimated that as of May 2022, 34 out of 50 European countries had some level of 5G deployment and 92 of 173 operators in the region launched 5G networks. However, even though there are networks available in most countries, only 2.5% of all online connections in Europe were 5G connections in 2021. When compared to other leading economies such as the United States, where 5G accounted for 14.2% of connections, and China, where 5G accounted for 28%, this demonstrates a significant lag in deployment and consumer adoption. This is a trend which is also reflected in the types of hardware being purchased by consumers. The majority of smartphones purchased in Europe are 5G enabled, but 5G smartphones accounting for 60% of smartphone sales in Europe adoption still falls behind the 73% of smartphone sales in North America.
Advocates for 5G expansion tout its potential to support much higher speeds, superior network reliability, and negligible latency. But consumer tech products like smartphones aren’t going to operate much differently between 4G and 5G networks — leaving the appeal of 5G dependent on the promise of future technology. Telecom companies have invested in these networks nonetheless but, without an influx of products on the market which rely on it, the demand is unlikely to translate into the revenue needed for more network expansion. When you add the premium price operators would have to charge to improve their networks, consumers may not consider it a good deal. This is why analysts expect business adoption to be the main driver of 5G demand, though the lag in consumer adoption compared to the United States and China is concerning for the immediate financial state of the European telecom industry.
CONTRIBUTIONS OF OVER-THE-TOP COMPANIES TO NETWORK INVESTMENT
A 2022 report by MTN Consulting found that investment by global telecom operators as a proportion of their total revenues peaked at 17.3% in 2021, driven by 5G network deployments. However, because of the low return on 5G investment, this proportion is expected to decline in coming years. In any case, telecom investment alone doesn’t give us a full picture of the size and extent of broadband infrastructure in Europe or the United States. Six American companies — Meta, Google, Apple, Amazon, Microsoft, and Netflix — currently account for 56% of all global data traffic between both fixed and mobile networks.
They are considered “over-the-top” or OTT platforms because they are companies reliant on the internet to deliver their products to consumers, in contrast to content mediums such as cable and broadcast. Each of these companies offers highly data-intensive products such as streaming, putting significant strain on areas where the coverage does not offer sufficient bandwidth to run these services.
This is the rationale for the notion that over-the-top platforms are free riders on the telecom investments that allow them to reach their users. However, contrary to over-the-top moniker, these platforms have also made significant global investments in the underlying infrastructure required to support their services. The aforementioned six American companies invested a cumulative $137.3 billion globally in 2021, including $58.2 billion from Amazon 31, 24.6 billion from Google, and $24.2 billion from Microsoft. Included in these figures are investments into the construction of data centers, subsea cables, and network edge locations — all which store and transmit the data traffic that European networks are currently struggling to support.
These investments have been largely focused on supporting the creation and expansion of a cohesive global internet. For example, a partnership between Microsoft, Facebook, and Telxius, a Spanish telecom infrastructure company, finished construction of a transatlantic cable in 2017 connecting the U.S. to Spain with the capability to transmitting up to 160 terabits of data per second. Additionally, Google has least 15 subsea cable projects underway around the world, totaling over 10,000 miles of submarine cable. Outside of the EU and U.S., the company has announced $1 billion in investment to support network expansion in Africa in 2021.
Each of these cables can cost several hundred million dollars apiece, signaling that capital investment by these companies is both large and growing as more of these types of projects are announced. Combined, it is estimated that the subsea cable projects by American OTT platforms contributed to an increase in global data transmission capacity by 41% in 2020.
As they seek to extend the efficiency and accessibility of their products to new customer bases, OTT platforms are expected to increase their capital expenditure from an average of 26.4% of their revenues over the past five years to more than 37% over the next half-decade. That means OTTs likely will be the main driver behind global network infrastructure investment moving forward.
Another overlooked aspect of network infrastructure is the construction of global data centers and network edge locations. Data centers are facilities crucial to storing, processing, and disseminating data and applications over the internet or through the cloud, and network edge locations are facilities geographically distributed to efficiently deliver content to nearby end-users. These are vital investments for over-the-top platforms which, while relying on telecom networks to reach users, need physical locations to support global data transmission.
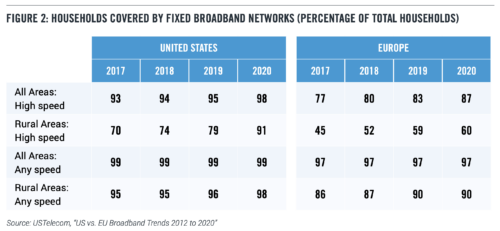
Five of the six big U.S. tech platforms (Netflix is the exception) the EU identifies as bandwidth hogs own and operate their own data centers and edge locations with both U.S. and European presence, as shown in Figure 3, highlighting the investment made to the larger network. Without construction of their own centers, companies outsource to third party content delivery networks to store and transmit data over the cloud. Netflix, for example, largely relies on Amazon’s AWS network for data storage and computing.
WHAT REGULATORY DIFFERENCES ARE HOLDING EUROPEAN COMPANIES BACK?
Although wireless prices have largely been flat in both European and American markets, U.S. telcos have been able to invest more in 5G and other high-speed network expansion. While some of this investment gap may be explained by lower prices and varying consumer interest in paying for high-capacity networks, the difference in regulatory strategies also is likely at play.
The EU has prioritized the lowest possible price to consumers through rigorous enforcement of competition law to discourage consolidation as well as caps on the prices paid for certain services. In contrast, U.S. policymakers have emphasized investment in high-capacity networks and rural broadband. Though favorable to consumers, it is difficult to see how the EU can sustain its strategy of price-focused regulation and still meet its aggressive connectivity targets for the next decade.
Enforcement of Competition Law Telecommunications networks present a unique challenge when it comes to competition law. Barriers to entry for new telecom operators are high given the capital needed to compete with established networks.
Because the cost of entry is so high, large companies utilize economies of scale to expand and maintain massive networks.
The United States and Europe tackle this challenge in different ways. The U.S. telecommunications market tend to be dominated by a few massive players. European countries aim at forming more localized markets with multiple providers, with regulations that ensure high levels of cooperation between companies to maintain a single coherent network.
High levels of competition help to keep consumer prices low. But as the U.S. case shows, a more consolidated market may allow for the economies of scale required to invest in areas where the return on investment is very low — allowing for higher quality service to rural communities.
This is not to say that the American model is ideal. Too many areas of the United States are served by only one provider, leaving consumers without the ability to shop for prices or consumer-friendly contracts. But for there to be substantial competition in more remote areas of the country, there either needs to be an influx of small telecom operators building rural networks — unlikely given the extremely low return on investment of expanding networks into sparsely populated places — or more large companies which can serve remote areas. This is the logic behind a federal judge’s approval of the merger between T-Mobile and Sprint in 2020. The judge reasoned that the combined company would be better equipped to compete with established industry giants Verizon and AT&T. Thus, despite the market becoming more consolidated, the merger would bring a new player to the top of the market putting pressure on incumbent companies in terms of service quality and price.
In contrast, the EU has been far stricter about the size of telecommunications companies, preventing consolidation and instead encouraging network sharing between operators. As a result, the European telecom market is highly fragmented with most countries hosting as many as four mobile operators, many of which are wary of making significant investment in 5G without clear signals that they will see a profitable return. This has prompted companies such as Vodafone and Orange to call for consolidation, claiming that overcrowding in European markets is making it difficult to invest and that network providers do not currently have the financial capacity to pay for the infrastructure needed to develop 5G technology
Europe’s fragmented broadband market necessitates a complex array of network sharing agreements between operators to ensure that their services work throughout the country. EU regulators have been clear in the goal that European consumers should have seamless access to data and voice services when traveling within the EU, requiring companies to negotiate with one another to ensure that their customers will have service in areas of the continent not covered by their own networks. In order for these agreements to be acceptable under EU antitrust law, they must ensure that they’re not reducing incentives for competition in deployment of infrastructure, putting an additional burden on companies which are struggling to achieve the scale needed to expand. It is for these reasons that CEOs of European companies such as Telefonica, Vodafone, and Norway’s Telenor have said that consolidation is necessary because current price wars and low margins are limiting funds available for 5G deployment. Critics of the movement for consolidation cite the likelihood that it will result in higher prices.
Government Funding for Network Expansion and Accessibility
In the U.S., the government spends billions annually to expand access to affordable internet service. Its efforts are mainly directed at subsidizing private companies to offer discount prices to low-income households. The pandemic-induced transition to online school and work in 2020 provided fresh impetus for these programs. In 2021, the Bipartisan Infrastructure Law allocated $65 billion broadband infrastructure deployment and affordability programs, including $401 million to provide access to high-speed internet for 31,000 rural residents and businesses in 11 states. Other programs such as the Affordable Connectivity Program are targeted specifically at long-term affordability for low-income households with a discount of $30 per month for internet service plans.
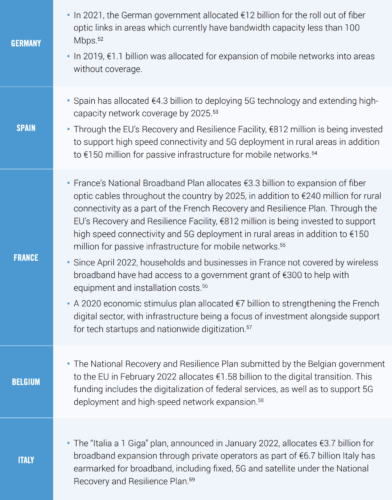
European funding for such projects differs on a country-by-country basis, but there are also initiatives being spearheaded at the EU level. The EU’s targets for the “Digital Decade” detail a series of initiatives for member states between 2021 and 2030. In addition to the ambitious connectivity targets, Brussels envisions a broader digital transformation in which at least of 80% of the population have digital skills and 75% of EU companies utilize the Cloud or other data services. As previously mentioned, under this plan the EU hopes to have Gigabit connectivity for everyone in Europe and 5G connectivity in all populated locations. To finance these goals, the EU suggests that member states allocate 20% of their funding from the Recovery and Resilience Facility — an EU program meant to finance reform and recovery post-pandemic — to the digital transition.
In addition to funding from the EU, member countries have put varying levels of public investment into expansion of fixed and mobile networks. While not a comprehensive list, the table below provides examples of the funding initiatives taken on by a handful of European countries since 2021.
European Price Caps on Telecom Services
While the U.S. government has negotiated with private network providers to lower prices of internet service for low-income Americans and implemented programs to give benefits for these households to front the costs, capping the prices that telecom operators can charge for given services without subsidy is a policy that is uniquely European.
Potentially the most consequential example of this is the EU’s “roam-like-at-home” policy, which allows customers with EU service plans to travel within the EU without additional charges for data roaming. In addition to requiring no charge to the consumer for crossing national borders, companies are required to ensure that data usage is available abroad at the same capacity and speed as the consumer would be paying domestically, with any additional surcharges for surpassing that data usage at €2 per GB of data. It would be infeasible for companies to have network infrastructure everywhere in the EU to meet the requirements of this policy, so it is made possible through network sharing. European telecom operators must enter agreements with other companies so that their customers can access other networks. This can be a costly process for telecom companies so, in the interest of supporting the sustainability of this policy for the telecom operators, wholesale caps are in place to provide a maximum amount that a visited operator may charge for the use of its network in order to provide roaming services.
The problems associated with this policy from a business standpoint are intuitive. By capping roaming fees, the EU limits telecom profits. On top of that lid on profits, companies are not allowed to charge one another more than the wholesale cap. If a company’s costs are at or above the cap, it loses money whenever its customers travel within the EU.
In addition to caps on roaming charges, in 2019 the European Parliament approved a rule to control the prices of intra-EU communication, capping cross-border phone charges at 19 cents per minute for calls and 6 cents per text message. Its purpose is to lower costs to consumers and bolster competitiveness for EU businesses, which will pay less for telecom services. However, for EU telecom operators forced to offer services with a lower profit margin, the net result is less global competitiveness.
There is no question that this is a beneficial policy for consumers in the short term, but the long-term impact is that such policies will disincentivize investment into Europe, ultimately hurting the individual who is having to consume other products at a lower quality than others around the world because of a lack of bandwidth and might not have access to future data-heavy services without network updates. Disincentivizing investment in Europe also pushes European telecom providers to bring their capital investment elsewhere. Vodafone has been in the Indian market since 2007 and continues to invest heavily in expansion in the region, working on bringing 5G to India. Similarly, as shown in Section I, T-Mobile in the United States is now much larger in terms of both revenue and capital investment than their parent company and European line of business, Deutsche Telekom.
CONCLUSION
The United States and the European Union have vastly different telecommunications sectors in terms of market structure, regulation, and operating capacity. Though these differing approaches have worked in the past, the recent influx in demand for bandwidth has exposed cracks in the European system which differ from those in the United States.
As Europe’s example shows, heavily regulated industries tend to invest less. In deciding how to move forward with goals for connectivity and digitalization, the trade-off between low prices to consumers must be weighed with the telecom operator’s propensity to invest such that the industry is not crippled by inability to achieve sufficient scale for network expansion.
This trade-off must also be weighed in the case imposing a fee on internet platforms. While over-the-top internet platforms are currently experiencing high growth, the mentality that they are therefore too big to fail and can withstand heavy regulation and taxation is an oversimplification of the market. This is a heightened risk given the other regulatory activities affecting the tech industry in Europe such as the Digital Markets Act passed in July 2022, which identifies many of these same companies as “gatekeepers” for purposes of competition law, further regulating their ability to profit in European markets. When an entity is taxed, it will also invest less. To add responsibility for network expansion to a growing list of recent EU regulations on leading American online platforms puts strain on an industry which currently engages in enormous capital expenditure, altering the incentive for them to continue to operate and invest within the EU.
With China and the United States leading the way for 5G and high-capacity networks, now is the time for Europe to strengthen its own networks to compete in the next era of technological innovation. As we move toward products that require higher data traffic there is a demonstrated need for updates to global network infrastructure. This will require global cooperation and investment, both from the telecom sector and the OTT platforms which are investing in ways to connect the international internet ecosystem in ways which are not necessarily covered by telecommunications companies. For a successful push toward global digitization, governments must recognize and support this private investment such that European innovation isn’t left behind.
Today, the Progressive Policy Institute (PPI) led a coalition letter to House Congressional Leadership urging their opposition to H.R.3460, The State Antitrust Enforcement Venue Act.
As explained in the letter, the bill would reduce the efficiency in the American judicial system — which is already backlogged — and disregards a clear opportunity for centralization that would conserve time and taxpayer dollars. The letter also lists additional concerns related to politically motivated judicial consequences from state attorneys generals where a company may be politically unpopular in a state or region.
Read the full letter:
Dear Speaker Pelosi, Leader McCarthy, and Leader Hoyer:
State enforcement of antitrust law plays a key role in protecting consumer welfare in the face of corporate monopolies. However, the national nature of our economy means that, in many cases, consumers across state lines are buying the same products and services. H.R.3460, the State Antitrust Enforcement Venue Act, retreats from the national nature of many markets by attempting to refocus antitrust law on a state-by-state basis. It makes this shift by preventing venue transfers for antitrust cases brought by state attorneys general in favor of a system where states can bring antitrust claims against companies with more control over the venue in which these cases are carried out. A major change such as this will have unforeseen consequences in a variety of antitrust situations. It is for this and the following reasons we urge you to oppose H.R.3460, which is incorporated in the House Rules Committ9.26.22 Venue Act Coalition Letteree notice hearing for the modified version of HR 3843, the Merger Filing Fee Modernization Act.
A July 2021 letter from the Director of the Administrative Office of the U.S. Courts explains the ways in which the bill would reduce efficiency in the American judicial system. It highlights that currently under 28 U.S. Code § 1407 similar civil cases in different districts are consolidated by the Judicial Panel on Multi-District Litigation, which then transfers the case to a single district. This can be requested by the defendant and the intent is to minimize duplicative processes and prevent inconsistent rulings.
By discarding this means for centralization through the passage of H.R.3460, the processes through which states approach antitrust cases is fundamentally changed. As is pointed out by the Administrative Office of the U.S. Courts, efficiency is compromised, as courts will need to separately engage in similar discovery and pretrial proceedings in different venues, even in cases where it would conserve the time of the court and taxpayer money to carry out in a single district.
Additional concerns lie in the potential for politically motivated judicial consequences associated with the bill. The bill’s elimination of the consolidation process for antitrust cases brought under 15 U.S.C. § 15c will give rise to a reality where different states could simultaneously pursue their own separate antitrust actions against the same companies across various federal courts. As such, state attorneys generals may harass companies that are politically unpopular in a particular state or region.
Creating a fragmented and inefficient antitrust system is not the optimal remedy for potential corporate antitrust violations. We urge you to oppose H.R.3460, the State Antitrust Enforcement Venue Act, and avoid the unintended consequences that may come with it.
Sincerely,
Progressive Policy Institute (PPI)
Center for New Liberalism (CNL)
Computer & Communications Industry Association (CCIA)
President Biden and lawmakers in both parties have prioritized slashing Americans’ out-of-pocket spending on insulin. And they recently made significant strides by including a $35-a-month co-pay cap for insulin for Medicare beneficiaries in the Inflation Reduction Act.
But as promising as these cost reduction measures are, they raise a key question: Why limit the co-pay price caps to just insulin?
More than 6 million North Carolinians live with at least one chronic condition, and 2.5 million are living with two or more. For seniors on Medicare, chronic disease prevalence is even higher, and for millions with fixed incomes, out-of-pocket costs are increasingly problematic.
If a $35-a-month co-pay cap makes sense for insulin — and it does — why not implement the same policies for medicines that treat asthma, hypertension and other common chronic conditions and focus on Medicare where chronic diseases are so prevalent?
FACT: Per the International Labour Organization, “Uzbek cotton is free from systemic child labour and forced labour.”
THE NUMBERS: ILO estimates of forced labor worldwide –
2021: 27.6 million
2016: 24.9 million
2011: 20.9 million
WHAT THEY MEAN:
A grim series of statistics, drawn from last week’s International Labour Organization report on worldwide forced labor in 2021:
“49.6 million people were living in modern slavery in 2021, of which 27.6 million were in forced labour and 22 million in forced marriage. Of the 27.6 million people in forced labour, 17.3 million are exploited in the private sector; 6.3 million in forced commercial sexual exploitation, and 3.9 million in forced labour imposed by states.”
The 27.6 million total — up by 2.7 million from the 24.9 million estimated in the ILO’s 2017 report — combines several different conditions under the broad term “forced labor.” The most common of these, found in 36% of cases, involves workers trapped in jobs by withholding of pay; others involve debt bondage, entrapment of migrant workers, threats of violence by criminal enterprises, and in 1% of cases, chattel slavery. Reacting to this report, the U.S., European Union, and Japanese Trade and Labor ministers express joint commitment “to eradicating all forms of forced labour, including state-sponsored forced labour, from our rules-based multilateral trading system, and resolve to strengthen national and international efforts to meet this commitment.”
How exactly would they do this? Perhaps more fundamentally, would “removing forced labor products from international trade flows” also eliminate forced labor as such, or simply shift the destination of the products? In thinking through these questions, it might be useful to look at a recent example of large-scale success: the elimination of a state-run program of seasonal forced labor in cotton harvesting in Uzbekistan. Some background and tentative conclusions:
Background:Largest of the Central Asian republics at 34 million people, Uzbekistan is the world’s sixth-largest cotton producer, harvesting about 3 million tons per year in a global total usually around 25 million tons. Having served in the Soviet era as the provider of cotton for Russia-based textile mills, as an independent country since 1991 Uzbekistan now grows cotton both for local factories and for exports to clothing-producers elsewhere in the world.
According to a series of ILO surveys begun in 2016, about 2.8 million people worked in Uzbekistan’s annual autumn cotton harvest in the early 2010s. Roughly 14% of these harvesters — almost 400,000 people – were forced laborers required by local governments to leave school or jobs for unpaid fieldwork during harvest season until regional harvest quotas were filled. The 2016 survey reported that those “most ‘at risk’ of forced labour were medical and education staff, people employed elsewhere, and university/college students.” Five years later, the January 2021 report declared that “systemic forced labour and child labour has come to an end in Uzbekistan,” and the March 2022 report found no return.
Eliminating this system appears to have involved at least three factors:
(a) A large and sustained international activist effort through the “Cotton Campaign” involving businesses, labor unions, and human rights groups, which provided information on forced labor practices in the cotton harvest and pressured textile and apparel industry buyers worldwide not to use Uzbek cotton.
(b) International government pressures, in the U.S. case including human rights reports published by the State and Labor Departments, and a ‘review’ of the tariff waivers Uzbekistan received through the Generalized System of Preferences entailing possible revocation.
(c) Contingent factors, in particular the death in office of post-Soviet leader Islam Karimov and his replacement by a new leader, Shavkat Mirziyoyev, whose government hoped to avoid the reputational and potential economic damage associated with forced labor and was willing to put sustained effort, with ILO advice and monitoring, into reshaping the cotton industry.
Tentative conclusions: In drawing lessons from this experience, it’s likely important to be aware that the term “forced labor” covers many different forms of coercion, and these may require different approaches. The Uzbek cotton harvesting system appears an unusual, both as a state-run program and as one designed mainly for economic/industrial purposes. The policies that succeeded in eliminating it may be less useful with respect to state forced labor systems used by militaries or for other political purposes. State-required forced labor in turn is a relatively small part of forced labor generally, accounting in the ILO’s estimates for about 15% of the worldwide 27.6 million forced laborers. Most forced labor (see data below) appears to be in small-scale private businesses and criminal enterprises, where the policy challenge will often be effective law enforcement, often at local levels. But some general features of the effort to eliminate forced labor in Uzbekistan’s cotton harvest may be generally useful.
Publicity: The Cotton Campaign’s work, and the publication of credible data and reports by the U.S. government and ILO, appear to have had a major impact on both international opinion and Uzbek government policy. The U.S.’ GSP review likely added to this; its economic importance was modest — in the mid-2010s it applied to $2.5 million in imports of dried peppers, apricots, and other agricultural goods, out of $100 million to $300 million in annual Uzbek exports to the U.S. — but the reputational impact of the case and potential loss of benefits may have been high. This is especially relevant since, as our January report on GSP notes, the system lapsed almost two years ago and is not now available for the six Ministers’ efforts on forced labor, but can be restored whenever Congress acts.
Patience and persistence: The Cotton Campaign began working in 2007, and remained focused specifically on Central Asian cotton harvesting for a decade before the change of government in Uzbekistan and the subsequent relatively rapid abolition of forced labor in cotton harvesting.
Optimism: In this case, some combination of government policies, activism, and changing perceptions within the Uzbek government worked. Different circumstances elsewhere may require different methods, but the fact of one success means others are also possible.
And via the Uzbekistan Embassy in D.C., remarks from Tanila Narbaeva (Chair of National Commission on Combatting Human Trafficking and Forced Labor) on the abolition of forced labor and next steps in labor reform.
Forced labor commitment from U.S./EU/Japan Trade and Labor Ministers.
And the U.S. Customs and Border Patrol explains forced labor-product interdiction.
Data:
Over the last decade, the world labor force has grown from 3.20 billion to 3.45 billion, and the ILO estimates of forced labor has risen from 20.9 million in 2011, to 24.7 million in 2016, to the 27.6 million cited in last week’s report. Basic statistics from last week’s report:
Industries: About two thirds of forced labor, totaling 17.3 million people, is in the “private sector.” This includes 5.5 million in a broadly defined “services” sector, and an additional 1.4 million in domestic work; 3.2 million in manufacturing, 2.8 million in construction; 2.1 million in agriculture; 0.2 million in mining and quarrying; and 0.1 million in fisheries. Child forced labor is most common in services, especially for domestic maid work.
Prostitution and pornography: 6.3 million forced laborers appear to be performing forced sex work (which in the ILO report is considered separately from ‘private sector’ industries). Of this total, 4.9 million are female and 1.4 male. Over a quarter of the 6.3 million people, 1.7 million, are children.
Government: 3.9 million people are held in labor camps or forced to work by governments. (Not including prisoners required to work as part of legitimate sentences for crimes). This total is nearly double the 2.2 million the ILO estimated for 2011, but slightly lower than the 4.1 million estimate for 2016. The ILO does not cite specific governments involved.
International trade: The report offers no guess at how much forced labor production enters international trade flows, but notes that the sectors where the risk of forced labor is “highest in severity and scale” are “informal micro- and small enterprises operating at the lower links of supply chains in high-risk sectors and locations”.
Geography: Forced labor estimates appear roughly consistent with shares of the world labor force, except that Africa’s share of forced labor is relatively low and the “Europe/Central Asian” share high. About half of all forced labor — 15.1 million people — is in Asia. Elsewhere, the ILO estimates 3.6 million people in forced labor in the Western Hemisphere, 0.9 million in Arab states, 3.8 million (and the lowest rate relative to population) in sub-Saharan Africa, and 4.1 million in Europe and Central Asia.
Case history in success: Uzbek cotton 2015-2022:
ILO’s 2016 report (first in the series, covering the 2015 harvest), with analysis on the nature of forced labor in cotton harvesting seven years ago.
And the March 2022 report announces an end to “systemic forced labour and child labour” in Uzbek cotton harvesting.
The Cotton Campaign lifts its boycott of Uzbek cotton, March 2022.
And historical Central Asia perspective:
Sadriddin Aini’s Sands of Oxus (1954), recounting childhood in the Emirate of Bukhara in the 1880s (conquered by imperial Russia in 1865 and no longer independent, but still a “protectorate” and locally self-governing), includes recollection of a temporary forced-labor recruitment episode for road-building.
ABOUT ED
Ed Gresser is Vice President and Director for Trade and Global Markets at PPI.
Ed returns to PPI after working for the think tank from 2001-2011. He most recently served as the Assistant U.S. Trade Representative for Trade Policy and Economics at the Office of the United States Trade Representative (USTR). In this position, he led USTR’s economic research unit from 2015-2021, and chaired the 21-agency Trade Policy Staff Committee.
Ed began his career on Capitol Hill before serving USTR as Policy Advisor to USTR Charlene Barshefsky from 1998 to 2001. He then led PPI’s Trade and Global Markets Project from 2001 to 2011. After PPI, he co-founded and directed the independent think tank Progressive Economy until rejoining USTR in 2015. In 2013, the Washington International Trade Association presented him with its Lighthouse Award, awarded annually to an individual or group for significant contributions to trade policy.
Ed is the author of Freedom from Want: American Liberalism and the Global Economy (2007). He has published in a variety of journals and newspapers, and his research has been cited by leading academics and international organizations including the WTO, World Bank, and International Monetary Fund. He is a graduate of Stanford University and holds a Master’s Degree in International Affairs from Columbia Universities and a certificate from the Averell Harriman Institute for Advanced Study of the Soviet Union.
A timely new report, published today by the Progressive Policy Institute’s Paul Bledsoe and Elan Sykes, argues the Biden Administration and the Democratic-controlled Congress’s historic clean energy and climate projects, passed in the Infrastructure Investment and Jobs Act, the CHIPs and Science Act and the Inflation Reduction Act, face major roadblocks that could threaten delivering on the promises of green innovation in the United States. The report authors find that America’s clean energy transition is dependent on permitting reform.
“If these reforms are not adopted, chances are we will face trillions of dollars in annual climate change impact costs in the U.S. and globally, and climate change impacts increasingly undermining domestic and global economic growth and security. The U.S. has made the initial policy investments to set the stage for clean energy and climate change success — now we must help ourselves, and the world, finish the job. No policy actions are more important,” write authors Paul Bledsoe, Strategic Adviser for the Progressive Policy Institute and Elan Sykes, Energy Policy Analyst at the Progressive Policy Institute in the report.
The report comes as Sen. Joe Manchin’s push for permitting reform has met pressure from far-left environmental groups, progressive activists, and members of the House Progressive Caucus. These concerns, which are overwrought, ignore the consensus among environmental analysts that slow regulatory review is creating more environmental and economic costs as we act to fight climate change.
Key policy recommendations from the report include:
Passing the Permitting Proposal led by Sen. Manchin and Sen. Majority Leader Schumer
Authorizing the study of successful permitting reforms – including the FCC’s ‘shot clock’ for cell tower siting
Passing the SITE Act, which would empower the Federal Energy Regulatory Commission as the siting authority for transmission projects that are currently forced to go through lengthy and fragmented approval processes and improve eminent domain procedures.
Maximizing Green Categorical Exclusions and Programmatic Reviews
Making reforms at the State and Local levels; and
Preventing new regulations from hindering new technologies.
Paul Bledsoe is a strategic adviser at the Progressive Policy Institute and a professorial lecturer at American University’s Center for Environmental Policy. He served on the White House Climate Change Task Force under President Clinton, at the U.S. Department of the Interior, as a staff member at the Senate Finance Committee and for several members of the U.S. House of Representatives. Read his full biography here.
Elan Sykes is an Energy Policy Analyst at PPI. Elan works on energy deployment, innovation, and decarbonization. Prior to joining PPI, Elan served as a researcher at the Climate Leadership Council where he focused on carbon pricing, global climate policy, and the intersection of climate and trade policies.
The Progressive Policy Institute (PPI) is a catalyst for policy innovation and political reform based in Washington, D.C., with offices in Brussels and Berlin. Its mission is to create radically pragmatic ideas for moving America beyond ideological and partisan deadlock. Learn more about PPI by visiting progressivepolicy.org.
The Biden Administration and the Democratic-controlled Congress have earned plaudits for enacting unprecedented funding for clean energy incentives and climate protection. These include provisions in the bipartisan infrastructure law (IIJA), the U.S. competitiveness legislation (CHIPS), sections of the Inflation Reduction Act (IRA), and other legislation, totaling approximately $514 billion in new spending on clean energy and climate, not including other related infrastructure funding.[1] Taken together, these new laws represent the greatest investment in new U.S. energy infrastructure in nearly a century.
And yet, because of regulatory roadblocks and nuisance litigation, it is unclear that this new funding will deliver on its two policy goals:
1) Rapid, low-cost build out of a powerhouse, world-leading U.S. clean energy sector.
2) Large reductions in domestic greenhouse gas emissions (GHG) necessary to put the U.S. in a vanguard position to force emissions reductions by other key emitting nations globally.[2]
America must lead the world as a whole toward a rapid clean energy revolution and decarbonization. But a big obstacle stands in our way:
A broken domestic U.S. energy permitting system that imposes tremendously high costs in time and money to build clean energy infrastructure projects, if they get built at all.
Ironically, in the name of environmental protection, a perverse process has set in whereby often unnecessary and duplicative government reviews and nuisance lawsuits have pushed average time for permitting to 4.3 years for transmission, 3.5 years for pipelines, and 2.7 years for renewable energy generation projects. Notably, these numbers don’t include those many hundreds of projects that are abandoned and never built because costs — often in the millions or tens of millions — and delays have become too burdensome for developers. These long, costly delays and false starts are simply not consistent with a rapid and cost-effective build out of U.S. clean energy generation and transmission, new hydrogen and carbon management infrastructure, or deep reductions in domestic GHG emissions in keeping with U.S. policy goals and climate science. In fact, initial studies note that without permitting and regulatory reforms, projectedclimate and economic benefits of these recent laws wouldbe artificially limited and fail to meet policy goals.[3],[4]
Equally, the potential economic and climate upsides for the U.S. of the actions recommended in this report are tremendous. Multiple studies[5],[6] show the IIJA, CHIPS and especially IRA new laws hold remarkable U.S. economic promise, including:
Growing the overall U.S. economy and new clean energy sector worth trillions each year;[7] creating millions of good, new jobs;[8] reducing consumer and business energy costs by 4% or $50 billion by 2050, while saving the average households hundreds of dollars each year;[9] and expanding U.S. technology and energy exports.
Reducing U.S. greenhouse gas emissions approximately 40% by 2030 below 2005 levels;[10],[11] the IRA bill alone would enable the U.S. to close 50% to 66% of the emissions gap between business-as-usual emissions and the Biden goal of 50% emissions reduction by 2030.[12] Together, the three new laws will help cut the near and long-term costs of climate change impacts and lower threats to public safety; protect worker productivity; improve public health and reducing health care costs;[13] enhance national and global security; and increase long-term U.S. competitiveness in the fast-growing global clean energy economy that will be worth tens of trillions of dollars during the 21st century.
But major studies that find large economic, clean energy, and climate benefits all assume significant improvements in clean energy project permitting and regulatory streamlining. Respected analysis also finds that to ensure these major benefits occur, and to maximize all potential economic and climate benefits[14] will require additional actions by the Administration and Congress.
When Senators Joe Manchin, D-W.Va., and Chuck Schumer, D-N.Y., announced that they had come to an agreement to pass the investments in energy and healthcare that became the Inflation Reduction Act, they also agreed to push for reforms aimed at speeding up the lengthy federal environmental review and permitting process. A draft summary of the deal proposes a prioritization process for strategically important projects, changes to review timelines and litigation rules, and reforms for certain projects and project-types.
The Manchin-Schumer proposal offers a path forward for the crucial reforms amid a narrowing window of opportunity for action this Congress. Leading Democratic climate hawks in the Senate, including Senators Brian Schatz, D-Hawaii, Martin Heinrich, D-N.M., and Ron Wyden, D-Ore., who helped designed the clean energy tax credit package that formed the core of the IRA’s climate component, have endorsed the call for swifter regulatory review and permitting of clean energy projects.
Unfortunately, however, the proposal has drawn fire from some far-left environmental groups and progressive activists. In the House, 77 members, most members of the left-wing Progressive Caucus, signed a letter arguing that permitting reform should not be included as part of a must-pass government funding bill, and may undermine efforts to improve environmental justice. Several senators, including Senators Ed Markey, D-Mass., and Bernie Sanders, I-Vt., have leveled similar concerns. Such fears are overwrought. There’s a growing consensus among environment analysts that slow regulatory review in fact creates environmental as well as other costs, and that slowing climate change is the most crucial goal of environmental justice.[15] Many of the key Manchin-Schumer proposals regarding NEPA administration, electric transmission, and hydrogen merely extend the benefits of existing law on infrastructure permitting, widening the scope of FAST-41 support through the Permitting Council to cover more energy projects and provide additional resources to coordinate and complete their reviews efficiently at a time where timely energy infrastructure deployment is of the utmost economic, political, and climate importance.[16]
The Manchin-Schumer proposals would not eviscerate environmental protections. Rather, in most cases, it will simply codify existing NEPA and other provisions, like those allowing simultaneous agency reviews, and greater use of the categorical exclusion process, already allowed under current law, as noted by leading Democratic siting expert Daniel Adamson.[17]
The proposal would also bring the U.S. in line with other advanced countries, notably the EU and Canada, which have high levels of environmental protection while maintaining firm deadlines for environmental reviews.[18],[19]
For years, most Republicans have advocated reforms not dissimilar to Manchin-Schumer, but Congressional Republicans are so far withholding support for the pending proposal, appearing wary of giving Democrats an additional legislative accomplishment. Now Senate Republicans, led by Senator Shelley Moore Capito, R-W.Va., have unveiled a new permitting reform blueprint, supported by 38 GOP senators. Their approach gives states “sole authority” over regulations on fracking on federal land and would allow states the right to “develop energy resources” on federal land within their boundaries. In general, the Republican approach only indirectly and insufficiently improves problems with renewables or transmission siting while taking a much more aggressive stance on oil and gas development on public lands, banning the Biden administration’s interim Social Cost of Carbon estimate, and codifying many of the Trump administration’s attempted changes to undermine environmental regulation.[20] These provisions are therefore not serious attempts to further the U.S. clean energy transition or limit greenhouse gas emissions in keeping with needed climate protection.
Our report describes in depth the ways in which our current regulatory systems are fundamentally broken, and concludes with the following recommendations to Congress for accelerating government reviews and permitting, including:
Pass the Manchin-Schumer Permitting Proposal:
The quickest and best step available to speed up permitting immediately and unleash the investments made in the IIJA, CHIPS, and IRA package is to pass the Manchin-Schumer proposal. This must include Reforming Energy Project Permitting and Streamlining Regulatory Hurdles, including under the National Environmental Policy Act (NEPA), as envisioned in pending legislation, specifically for major high voltage electric power lines to carry renewable energy from remote areas of generation to regions of strong demand; Natural gas and CO2 pipelines; Electricity Storage projects; Electric and other advanced vehicle charging and fuel infrastructure; Carbon Capture and Storage and Direct Air Capture technologies; Advanced Nuclear Power; Advanced Geothermal, and many other new technologies.
Study and Consider Adopting Successful Permitting Reforms — including 2-Year “Shot Clock” — from Other Sectors:
Congress should authorize the study of successful permitting reform in other parts of the economy, including the Federal Communications Commission’s adoption of time limiting “shot clocks” for the siting of cell phone and communications towers, with an eye toward adopting this time limit for appropriate energy projects. Applying these procedures to key green projects like grid-scale solar, wind turbines, battery storage, and transmission lines on public lands will ensure developers of rapid government decision-making that can increase certainty, reduce costly delays, and help speed up deployment. With all of the new resources available to agencies for permitting in the IRA, quick decisions will not undercut thorough examination of any localized impacts from these well-understood and environmentally critical projects.
Pass the SITE Act:
This bill, written by Senator Sheldon Whitehouse, D-R.I., and cosponsored by leading climate advocates Senators John Hickenlooper, D-Colo., and Martin Heinrich, D-N.M., and others in the House, would empower Federal Energy Regulatory Commission as the siting authority for transmission projects that are currently forced to go through lengthy and fragmented approval processes and improve eminent domain procedures. Ideally, these provisions would be included in reform legislation passing Congress this year.
Maximize Exclusions and Programmatic Reviews:
A Categorical Exclusion (CE) is a group of actions that a federal agency has determined, after review by White House Council on Environmental Quality, do not individually or cumulatively have a significant effect on the human environment and for which, therefore, neither an environmental assessment nor an environmental impact statement is normally required. Legislation should seek to expand the use of CE whenever possible, requiring use of the fasted possible review process available under law.
Reforms at the State and Local Levels:
At the state and local levels, policymakers should look for parallel opportunities to reform slow or outdated review, siting, and permitting procedures that in many cases are just as onerous, costly, and counterproductive as federal regulations. State and local jurisdictions are host to many crucial opportunities for clean energy deployment that will not rise to the federal level, including distributed renewable generation, local transportation networks, and denser forms of housing development. In New York, a new Office of Renewable Energy Siting established in 2020 has already improved on the older, more arduous approval process by consolidating and expediting siting and review requirements and empowering the State to override local restrictions on renewable energy that are “unreasonably burdensome”; this model should be emulated more widely by other states, especially California, whose California Environmental Quality Act is notoriously for many years of delaying needed energy infrastructure.
Prevent New Regulations from Hindering New Technology:
New permitting hurdles or regulatory bottlenecks may also emerge as innovative technologies like direct air capture, carbon capture, utilization and storage, CO2 pipelines, hydrogen hubs, advanced nuclear, and advanced geothermal wells scale up. These and other new clean energy technologies may require additional regulatory actions as they are more widely commercialized; however, federal policy makers in Congress and the Executive Branch must guard against the imposition of new unnecessary regulatory burdens especially those that delay needed infrastructure buildout.
A Broken Permitting System and Regulatory Gridlock
With the incentives to deploy clean energy technologies in place following the passage of IIJA, IRA, and partially-funded CHIPS, these permitting reforms are crucial for ensuring maximum economic and climate benefits. In fact, initial studies find that without permitting and regulatory reforms, projected climate and economic benefits of these new law would be severely limited and fail to meet policy goals.[21],[22] Congress should work quickly to pass them as proposed and continue to search for additional ways to speed up deployment.
The federal environmental review, siting, and permitting process (hereafter summarized as “permitting”) is a complex collection of requirements that oblige project sponsors to submit lengthy documents outlining the project’s impact on the environment and analyzing potential alternative projects. Depending on the type of project, federal law may require analysis under the 1969 National Environmental Policy Act, or NEPA, which can take several forms depending on the type of project and its expected impact. NEPA review can take one of three forms, increasing in stringency from Categorical Exclusions, which are intended to exempt unimpactful projects from unnecessary scrutiny, Environmental Assessments, or EAs, a sort of intermediate review after which a project can be declared to have no significant impact (FONSI), submit a “mitigated FONSI” that lays out steps taken to reduce the project’s impact and ensure that it stays below the threshold for further review, or sent up to the highest level of review, an Environmental Impact Statement, or EIS.[23],[24] Large projects with expected significant impacts go straight to the EIS stage. Only after the Final EIS is issued can federal agencies make final decisions regarding the project, including determinations made along the way on 64 different types of permit that might be required depending on the nature of a project.[25]
While initial NEPA reviews were generally brief documents produced quickly, the intervening decades have seen a marked increase in the completion time and page counts of NEPA review documents. In 2020 the CEQ released a report finding that recently published EISs took 4.5 years to complete from formal Notice of Intent to final Record of Decision and ran for an average of 661 pages — not counting the average 1,042 pages of appendices.[26] And while Categorical Exclusions and Environmental Assessments are quicker and shorter, the federal government is responsible for issuing many more of them, somewhere on the order of 10,000 EAs and 100,000 CEs per year, and so while a comprehensive assessment of their time and financial cost to the government does not exist, the cumulative resources dedicated to them are significant.[27]
Permitting Council data for a representative sample of energy sector projects from 2010 to 2017 bears out the finding that permitting adds years to these crucial projects: the average time from formal start to final decision averaged 4.3 years for transmission, 3.5 for pipelines, and 2.7 years for renewable energy generation projects.[28],[29] These reports are costly to produce for both the government and for private developers, not just in staff and consultant salaries, but also by adding years of delay where investment is tied up but cannot be deployed productively.[30]
These average review times obscure the occasionally devastating impact that NEPA review and equivalent requirements from state governments can have on clean energy infrastructure and other pro-environment projects. Cape Wind, an offshore project that would have been the first of its kind in the U.S., was caught up in litigation for 16 years; another Massachusetts project, Vineyard Wind, is finally going ahead after years of NEPA review and Trump administration-imposed delays.[31],[32],[33] On land, a wind project in Wyoming took 11 years for approval.[34] New York City’s congestion pricing program, a valuable attempt to incentivize cleaner alternative transport modes and disincentivize traffic that clogs Manhattan’s streets, is being put off for NEPA review as well.[35] At a time when climate change is exacerbating extreme weather phenomena and brutal wildfires rage in the Western U.S., NEPA delays USFS wildfire prevention by an average of 3.6 to 7.2 years depending on the project type.[36] Recent analysis finds that U.S. coal fired power plants that have been scheduled to close are staying open, in many cases in order to stabilize regional electricity grids, which are running into regulatory and permitting roadblocks in expanding intermittent wind and solar power.[37]
Sadly, the problem of environmental review bogging down environmentally critical projects is not exclusive to federal law. At the state level, regulations, such as California’s CEQA, have proved a similar barrier to green projects like high-speed rail between San Francisco and LA and to San Francisco’s bike lanes.[38],[39],[40] Climate-beneficial projects in other states have also encountered this problem, such as the rezoning of Minneapolis to allow denser and more climate-efficient forms of housing which was successfully sued under MERA, Minnesota’s state-level NEPA equivalent.[41] In Iowa, one analysis has found that local ordinances restricting wind turbines may obstruct more than half of future wind power development needed in the state for U.S. net-zero 2050 goals.[42] While this paper is focused on federal reforms, many of the issues discussed here also apply to this patchwork of varied and occasionally stifling state permitting processes that require reform as well.
Energy Permitting and the Deployment Challenge
The ability of the new programs laid out in the IIJA, CHIPS, and IRA to achieve their goals and maximize the public benefit depends on our ability to build the infrastructure and technologies they fund. This means rapid buildout of vast new low-carbon electricity generation, which in turn will require significant changes to our electricity grids in the form of long-distance transmission, large-scale storage, and resilience upgrades, along with new technologies to turn this clean energy into useful applications for industry, transportation, and buildings. Now, the funding is in place to make significant progress on this buildout, but the fraction of costs spent on bureaucratic paperwork and time spent waiting with NEPA review, siting decisions, and permits pending remain to be determined.
Just how much new energy infrastructure will be required? The National Academies report, Accelerating Decarbonization of the U.S. Energy System, lays out the scientific consensus on what the U.S. will need to deploy to reach net-zero emissions: far more than is currently in operation.[43] And all of this new deployment must happen at an accelerating pace.
Expert energy systems modelers have estimated that the IRA will accelerate renewable deployment significantly: The REPEAT Project at Princeton University’s ZERO Lab has projected that, absent permitting and siting obstacles, the IRA could spur 39 GW of wind and 49 GW of grid-scale solar per year by 2025 and 2026.[44] Energy Innovation, another modeling group, projects that the cumulative wind and solar generation on the grid could reach between 795-1053 GW by 2030 thanks to the IRA funding.[45] Both modeling reports, however, explicitly call out permitting and transmission capacity as potential bottlenecks that could limit this deployment.
Compared against historical renewable deployment rates, achieving this acceleration and ambitious net-zero targets will be a huge lift. For the last two decades, wind and solar generation have grown rapidly in the U.S. as technology improved, costs declined, and public policy support generally expanded. Between 2001 and 2021, the U.S. installed a total of 130 GW of wind and 95 GW of solar (including distributed and thermal solar — utility-scale PV generation is smaller, and in 2020 nameplate capacity for all of the U.S. was only 46.6 GW).[46],[47] Annual net capacity additions for the last 10 years in the same data averaged 9 GW each of wind and solar.
In that time, projects as small as 0.1 GW (10 MW) of solar and as large as 3 GW of wind were subject to NEPA reviews counted in the FPISC review, where renewable project permitting times stretched for an average of 2.7 years each. If each fraction of a gigawatt takes almost 3 years to secure federal permits, and the transmission upgrades needed to carry that power to consumers takes over 4 years per project, the modeled effects of the IIJA and IRA will never come to pass. Instead of rapid progress on clean energy, the funding appropriated in these laws will pay for slow-moving projects and countless person-hours of duplicative, unnecessarily burdensome reviews.
And for newer clean energy projects on the cutting edge of technology, like new advanced nuclear power, advanced geothermal, hydrogen hubs, and carbon management infrastructure in the form of capture and storage, direct air capture, and CO2 pipelines will struggle even harder. Because these technologies are newer, they may present novel environmental impact questions that take longer to sort out at first. All the more reason, then, to ensure that permitting staff are able to focus on these new technologies rather than clogging up their agenda with well-understood and environmentally vital renewable energy and transmission projects.
Passage of the Infrastructure Investment and Jobs Act and the Inflation Reduction Act’s clean energy provisions has committed the nation to deploy renewable generation capacity and battery storage at several times the historic pace. Permitting reform can help us step up the tempo of installing new solar panels, wind turbines, and other clean generation; upgrading aging transmission grids and ensuring reliable supplies; millions of new EV charging stations funded with $7.5 billion in the IIJA, improving energy efficiency in mass transit and buildings; and launching innovative new carbon management and clean hydrogen regional hubs. We should demand the highest possible public benefits from these investments.
Modest Steps Forward
The permitting problem is not new and several previous attempts to speed up approvals have helped incrementally improve the process.
Through executive action as well as legislation, the Biden Administration has pushed to speed up the federal permitting process without getting bogged down in controversies that stymied his predecessor’s efforts. The Biden Administration’s permitting timelines have improved by an average of almost four months due to more efficient bureaucratic management.[48] While an updated set of CEQ regulations is partially complete, the Biden White House released a Permitting Action Plan this past spring that emphasizes efficient processing, coordination across agencies and with relevant state, local, and Tribal governments, and leveraging tools like the Permitting Dashboard and FAST-41 authorities.[49]
The major infrastructure and clean energy legislation passed this Congress also include beneficial steps on permitting. The IIJA included key improvements to existing reform initiatives, turning the Permitting Council from a temporary body under FAST-41 into a permanent program and establishing two-year review goals, shorter documents for surface transportation project reviews of under 200 pages (with exceptions for unusually complex projects), single-document EISs, shorter deadlines for final Records of Decision after the completion of a Final EIS, allows for expanded eligibility for existing Categorical Exclusions, and allowing for the inclusion of a wider range projects on the Council’s Permitting Dashboard.[50] Many of these changes reinstated aspects of the “One Federal Decision” framework while avoiding some of the more contentious aspects of the Trump administration’s reforms.
The IRA tackled permitting delays from a different angle: As part of its overall clean energy spending package, $735 million will be appropriated to federal agencies to help hire staff, upgrade technical systems, and develop new tools to improve review quality and speed up the process.[51] The funding is split between the Department of Energy, Interior, EPA, CEQ, FERC, NOAA, the Permitting Council, and the FHWA. This funding is especially important from an efficiency standpoint because the federal agencies responsible for producing and reviewing NEPA documents and issuing permits will need sufficient technical expertise and workforce capacity if the government is to successfully speed up the process in practice. But without firm deadlines, enforcing the expectation that these new resources are used to speed up reviews, the funding will be spent on managing the existing paperwork burden that maintains the status quo to little public benefit.
All of these steps are commendable, but the sheer scale of the clean energy transition requires moving beyond incrementalism. Senators Manchin and Schumer are on the right track with their outlined proposal to take a next step, and Democrats should get on board to match the fiscal commitments the U.S. has made to unleash clean energy abundance with regulatory reforms to enable these investments to translate into rapid progress on the ground.
Recommendations to Congress on Permitting Reform
As of this writing, an official text of the Manchin proposal has not been released. A one-page summary lists a new procedure for designating high-priority energy projects, firmer enforcement of NEPA review timelines, changes to litigation, categorical exclusions, and some sector-specific changes.[52]
High Priority Projects: The President would be responsible for designating at least 25 “high priority energy infrastructure projects” of “strategic national importance” for expedited review among a “balanced list of project types, including: critical minerals, nuclear, hydrogen, fossil fuels, electric transmission, renewables, and carbon capture, sequestration, storage, and removal.”
Timeline Cap: Maximum timelines of 1 year for EAs and 2 years for EISs.
Litigation Reform: Limit litigation delays by shortening the statute of limitations and requiring quicker responses by agencies in NEPA lawsuits.
NEPA Exclusions: Actively evaluate potential new Categorical Exclusions to NEPA.
The summary also suggests changes for certain project types and one specific project:
Interstate electric transmission reforms: Grants new ability to the Energy Secretary and FERC to designate projects of national interest, requires FERC to allocate transmission project cost to benefiting consumers, and allows payments to transmission host jurisdictions.
Clean Water Act Section 401 reforms
Hydrogen infrastructure placed under clear FERC jurisdiction
Approving the Mountain Valley natural gas pipeline
This proposal would work well with the steps laid out by the Biden Administration and those taken in the IIJA and IRA to help move the ball forward on clean energy deployment that is absolutely necessary to meet U.S. climate goals. Transmission is a particularly important area for reform due to the changing needs of U.S. electricity grids pursuing decarbonization in a rapidly changing climate. The Manchin-Schumer proposal includes several tools that could strengthen landowner protection and retain State input while spurring nationally vital deployment, and we suggest further action to spur grid upgrades below by incorporating the SITE Act into the deal. The proposal would also ensure that U.S. natural gas exports are available to energy-constrained allies in Europe and Asia. At a crucial time in energy markets, U.S. gas exports would be poised to meet global demand with exceptionally low-methane supply thanks to the IRA’s new methane fee and methane reduction funding, helping to avoid the worst-case scenarios of increased coal combustion or severe energy shortages.[53]
Viewed with skepticism by some on the left — who view any new fossil fuel infrastructure as anathema — the growth of U.S. natural gas exports should be viewed as the best available course of action given the current circumstances of global energy markets. For European allies struggling to replace cut off Russian supplies, the U.S. is effectively the only producer who can scale up to meet their urgent needs. And in the global view, the U.S. has a continued role to play as a supplier of natural gas with less leakage upstream.
This pragmatic approach to position the U.S. as a green supplier in energy markets is not at all limited to natural gas. As the world pushes to expand battery supply chains for new electric vehicles and grid storage facilities, or mine copper, steel, and aluminum for renewables and transmission construction, the energy transition will require growth in all sorts of raw materials production. Rather than use NEPA review as a delay mechanism to try and limit the first-order emissions of U.S. extractive industries, we should look at global supply chains in their totality and expand domestic production or production among like-minded allies with comparable labor and environmental protections to see where we can produce the maximal amount of new clean energy technology at minimal environmental impact.
Pass the Manchin-Schumer Permitting Proposal with Strengthened Timeline Goals: The quickest and best step available to speed up permitting and unleash the investments made in the IIJA, CHIPS, and IRA package is to pass the Manchin-Schumer proposal. Firming up shorter review timelines and simultaneously dedicating new resources to conduct thorough reviews quickly will help orient the federal government toward meeting the deployment challenges that come with these new investments. While the IIJA’s permitting provisions established 2-year average timeline goals, we recommend 2 years be set as the final goal for key energy projects and commend steps taken to ensure timely litigation and dispute resolution to further reduce uncertainty. Better prioritization will ensure that staff time and contracting funds are spent more efficiently, both by provisioning additional resources to reviews of strategically important projects (that tend to be the most complex) and by expanding eligibility for Categorical Exclusions for projects that ought to require less time under review.
Study and Consider Adopting Successful Permitting Reforms — including 2-Year “Shot Clock” — from Other Sectors: Congress should authorize the study of successful permitting reform in other parts of the economy, including the Federal Communications Commission’s adoption of time limiting “shot clocks” for the siting of cell phone and communications towers, with an eye toward adopting this time limit for appropriate energy projects. Applying these procedures to key green projects like grid-scale solar, wind turbines, battery storage, and transmission lines on public lands will ensure developers of rapid government decision-making that can increase certainty, reduce costly delays, and help speed up deployment. With all of the new resources available to agencies for permitting in the IRA, quick decisions will not undercut thorough examination of any localized impacts from these well-understood and environmentally critical projects.
Pass the SITE Act: The Streamlining Interstate Transmission of Electricity Act, introduced by Senator Sheldon Whitehouse, D-R.I., and cosponsored by Senators Martin Heinrich, D-N.M., and John Hickenlooper, D-Colo., (along with Representatives Mike Quigley, D-Ill., Sean Casten, D-Ill., and Scott Peters, D-Calif., in the House),[54] would empower FERC as the primary siting authority for transmission projects that are currently forced to go through lengthy and fragmented approval processes, and would also grant the ability to use a new eminent domain process for transmission that is updated to include stronger transparency and landowner protections than existing eminent domain authorities for other projects. Transmission deployment will also need to work its way through complex planning and approval processes at the private level, whether through transmission systems operators (RTOs and ISOs) or through utilities, that may benefit from further policy support and political engagement.
Maximize Regulatory Exemptions and Programmatic Reviews for Clean Energy Projects: The Biden Administration should build on its record of successful permitting improvements and continue to prioritize project delivery with all available administrative tools. Between the new ability to apply some existing Categorical Exclusions more broadly and the Manchin-Schumer proposal’s provision to expand CEs more generally, federal agencies should look for all available opportunities to speed up clean energy projects. Implementation of the Administration’s Permitting Action Plan, especially the use of programmatic reviews that can cover broad areas of analysis to be reused efficiently by individual projects rather than doing individual reviews on a project-by-project, can also ensure that agency resources are dedicated to speeding up project delivery and improving environmental outcomes. IIJA and IRA funding to clean up legacy pollution and provide technical assistance to disadvantaged communities will also help improve outcomes in line with the Biden Administration’s environmental justice goals for new energy deployment and ensure that meaningful public input, especially from disadvantaged communities, occurs early in review processes rather than serving as a source of uncertainty and delay through the courts later.
Reform at the State and Local Levels: At the state and local levels, policymakers should implement parallel reforms to slow or outdated review and permitting procedures. State and local jurisdictions are host to many crucial opportunities for clean energy deployment that will not rise to the federal level, including distributed renewable generation, local transportation networks, and denser forms of housing development. In New York, a new Office of Renewable Energy Siting established in 2020 has already improved on the older, more arduous approval process by consolidating and expediting siting and review requirements and empowering the State to override local restrictions on renewable energy that are “unreasonably burdensome”; this model should be emulated more widely by other states.[55] These actions could unlock even further clean energy investment, emissions mitigation, and economic growth opportunities for ambitious states and localities in the coming decades.
PreventNew Regulations from Hindering New Technologies: New permitting hurdles or regulatory bottlenecks may also emerge as innovative technologies like direct air capture, carbon capture, utilization and storage, CO2 pipelines, hydrogen hubs, advanced nuclear, and advanced geothermal wells scale up. In new industries, a light regulatory hand can help avoid stifling fast-emerging opportunities out of undue precaution. Congress and the Biden Administration should continue to keep their eye on the ball to seize on new opportunities to speed up deployment, help nurture these new industries, and provide U.S. energy workers and households with abundance.
Conclusion
Domestic Permitting Reforms Needed for U.S. Clean Energy and Climate Success
The unprecedented new levels of U.S. clean energy investment enacted in the last two years hold vast potential for the overall U.S. economy and will spur a new clean energy sector worth trillions each year, creating millions of good, new jobs, saving consumers and business tens of billions in energy costs, and expanding U.S. technology and energy exports. But as this report has demonstrated, these benefits will only accrue fully if sweeping new permitting reforms are enacted quickly, including both in Congressional pending legislation this year and additional federal and state reforms over time.
Meanwhile, if the recommendations in this report are adopted, they can also dramatically improve and increase overall U.S. and global climate protection, reducing U.S. greenhouse gas emissions by approximately 40% by 2030 below 2005 levels, cutting the near and long-term costs of climate change impacts and lower threats to public safety, protecting worker productivity; improving public health and reducing health care cost, and enhancing national and global security. More broadly, they will set the stage for far more effective U.S. and global climate protection.
Equally, however, if these reforms are not adopted, chances are we will face trillions of dollars in annual climate change impact costs in the U.S. and globally, and climate change impacts increasingly undermining domestic and global economic growth and security. The U.S. has made the initial policy investments to set the stage for clean energy and climate change success — now we must help ourselves, and the world, finish the job. No policy actions are more important.
APPENDIX:
SUMMARY OF KEY CLEAN ENERGY AND CLIMATE PROVISIONS IN IIJA, CHIPS, AND IRA BILLS:
The first two years of the Biden Administration and the 117th Congress have come together to produce a remarkable slate of energy and climate investments across three bills, two passed with significant bipartisan support. Tallied together, the Infrastructure Investment and Jobs Act, CHIPS and Science Act, and Inflation Reduction Act will infuse our energy systems and economy with approximately $514 billion in new funding (though the process is incomplete for CHIPS: In legislative terms, the spending laid out in the bill has been authorized but not yet appropriated). Working in concert, the investments in infrastructure, research and development, demonstration projects, and deployment incentives will help spur investment in technologies at various stages of innovation from basic research to commercialization and mass adoption across a wide cross-section of the U.S. economy.
The three bills work in complementary ways. The IIJA provides investment in infrastructure like the electricity grid, EV charging networks, and rail. The IRA provides broad funding and incentives to mobilize public and private capital together to build out clean energy generation and electrified end-use applications for businesses and households. And CHIPS, while primarily focused on semiconductors and basic science, may end up dedicating a significant portion of its funds to research and development in energy and climate tech that could keep the U.S. at the frontier of energy innovation. Together they represent a triumph for clean energy, American workers and consumers, and the fight against climate change — just how big of a triumph, though, will depend on our ability to turn those investments into new physical infrastructure and clean tech on the ground.
Infrastructure Investment and Jobs Act
Not just a roads and bridges bill, the IIJA will direct tens of billions to lower carbon transportation, innovative climate programs in hydrogen and carbon management infrastructure, and electric grid improvements and innovations. Funding for public transit, passenger and freight rail, ports, and water infrastructure will also bring climate or other environmental benefits such as lower air pollution and cleaner drinking water to the American public.
Out of the $550 billion in new spending, $65 billion will go to electric grid upgrades and energy supply chains like battery materials processing, $47 billion to resilience projects, $7.5 billion for EV chargers, and $7.5 billion for cleaner school buses and ferries. Aging nuclear plants will receive $6 billion in funding to prevent retirement along with $700 million for legacy hydropower. Clean energy research and demonstration projects will receive $21.5 billion in total, split between $8 billion for clean hydrogen, $10 billion for direct-air capture, carbon capture, and storage, and $2.5 billion for advanced nuclear power generation.
Outside of the energy system investments, the IIJA also funds infrastructure programs with other important environmental implications. $105 billion will go to rail and transit. School energy efficiency will receive $2.5 billion in funding and the Weatherization Assistance Program for low-income homes is increased by $3.5 billion. Also important for environmental justice benefits are $1 billion for a “Reconnecting Communities” program to address negative impacts of legacy infrastructure and $21 billion for brownfield remediation.
The climate effects of these spending programs are more difficult to estimate than those of the Inflation Reduction Act, but Princeton’s ZERO Lab expects that the IIJA would reduce emissions by over 100 million metric tons per year in 2030.[56] Part of this finding stems from the difficulty of modeling the specific programs included, but another factor that leads these models to underestimate the emissions reduction effects of the IIJA’s programs is that they will be working in concert with the IRA by providing the infrastructural foundation for all of the new clean energy generation, transmission, and other technologies funded by the latter bill’s tax credits and new spending programs. For the IIJA programs themselves, the ability to start construction on all of these new infrastructure projects will depend on the effectiveness of the collective effort to reform permitting, including measures in the bill itself discussed below and future steps needed including Senator Manchin’s Proposal. With the right steps on review, siting, and permitting, however, the Infrastructure Investment and Jobs Act is poised to make transformative progress on U.S. infrastructure development in both “traditional” and new clean energy projects.
Inflation Reduction Act
The Inflation Reduction Act, passed by Congress in August of this year, will spend $369 billion to fund new clean energy, transportation, building, and manufacturing programs, as well as new conservation, agriculture, resilience, and air pollution initiatives. The funding is split between tax credits for individuals and businesses and direct government-funded programs. A methane fee will provide oil and gas producers with a strong incentive to reduce upstream emissions of the extremely potent greenhouse gas in their supply chains, and a program to fund methane reduction technologies will help too.
The IRA envisions major climate and energy progress through a suite of new clean energy tax credits. Many of the tax credits build upon existing tax code provisions but extend, expand, and make them technology-neutral so as to encourage the most efficient uptake possible. Financial tweaks to enable direct-pay for some eligible organizations and improved transferability will enable broader uptake of these credits as well. Many of the credits are structured so that the maximum incentives are available only after meeting domestic content and labor requirements.
Zero-carbon generation in the form of solar, wind both on and offshore, existing and advanced nuclear, and geothermal, will all be eligible for the credits. New or expanded tax credits will also be made available for carbon sequestration, existing nuclear power, clean hydrogen, and “advanced manufacturing” of key clean energy tech components. Energy efficiency incentives for individuals and businesses are expanded as well. In transportation, the law seeks to boost the entire supply chain for electric vehicles, encouraging expansion of domestic production in mining and processing raw battery materials, assembling batteries, producing the vehicles, and providing adoption incentives for consumers. All told, JCT estimates that the total expenditure on these credits will total $148 billion through 2031.
On the direct government spending side, the IRA is ambitious. The EPA will receive $27 billion to create the GHG Reduction Fund, a lending facility for green projects. The DOE’s Loan Programs Office, a similar lending program for innovative energy demonstration and commercialization, advanced vehicle manufacturing, and Tribal energy programs, receives major increases in both funding, with roughly $17 billion in new appropriations, and vastly expanded lending capacity. The methane fee will disincentivize leakage of that potent greenhouse gas, which will also be mitigated with $1.5 billion in methane reduction funding. Ports will receive $3 billion to reduce air pollution. In transportation, domestic auto manufacturing is allocated $2 billion in grants to retool for production of EVs, hybrids, and other alternative clean fuel vehicles and $1 billion in grants will be available to state and local governments for heavy-duty vehicles like buses and garbage trucks. Rural energy systems will receive significant upgrades, with $10 billion appropriated for rural electricity cooperatives and $2 billion for clean energy adoption through the Rural Energy for America Program. Conservation, agriculture, and forests receive $20 billion all together, as well.
The climate and energy implications of the IRA are staggering, and modelers agree that the law will enable major emissions reductions over the coming decade. Estimates vary based on assumptions about fossil fuel costs and tech adoption, so each model provides a range of estimates that each vary slightly: Rhodium Group projects 32-42% reductions, Energy Innovation estimates 37%-41%, and Princeton’s ZERO Lab preliminary reports suggests that emissions could fall by an average of 42% across scenarios.[57],[58],[59]
Crucially, these models estimate economically optimal responses by individuals and industries covered by the bill’s programs and do not incorporate frictions posed by local siting conflicts or any permitting delays. Much like the goals of the Infrastructure Investment and Jobs Act, the climate and energy outcomes of Inflation Reduction Act depend on the ability of its funds to be spent on the clean energy technologies themselves rather than spending high proportions of project cost on lengthy federal reviews. As will be discussed below, the IIJA and IRA contain limited progress on this front, but work remains for Congress and the White House.
CHIPS and Science Act
The CHIPS and Science Act, touted primarily for its role in bolstering the domestic semiconductor industry and seeking to enhance U.S. competitiveness against China, also contains an underappreciated share of support for research in energy and climate. According to an estimate by the Rocky Mountain Institute, as much as $54 billion of the law’s $280 billion overall spending might flow to energy innovation.[60] Importantly, though, this funding has only been authorized and must still be appropriated by Congress before these funds will be spent.
The CHIPS and Science Act did not include explicit legal changes to permitting, but subsequent moves have acknowledged the importance of reducing permitting barriers in the bill’s policy area. After its passage in August, the Biden administration announced the creation of an interagency working group to coordinate permitting for high-tech manufacturing in light of the issue’s importance for achieving the bill’s goals.[61] Congress, too, has acted to reduce permitting barriers for high-tech industries, passing a companion bill to CHIPS that allows tech projects such as semiconductor fabs, data storage, and others to take advantage of the FAST-41 process.[62]
As a science and technology bill, the CHIPS programs are focused on the earliest stages of innovation rather than incentivizing the buildout of market-ready tech like wind turbines or electric vehicles. Instead, the climate contributions in CHIPS flow to important research hubs like the Department of Energy’s ARPA-E program, a newly established Directorate of Technology, Innovation, and Partnerships, and labs like the National Renewable Energy Laboratory along with provisions for STEM education and workforce development. Working through government research labs, universities, regional tech hubs, and in partnership with private-sector entrepreneurs, the law funds basic energy science, storage, advanced nuclear, clean steel, energy materials, and other research programs with the aim of keeping U.S. researchers at the cutting edge of the energy technology frontier. If fully funded and successful in this aim, the CHIPS and Science Act may end up being viewed as the most important move this Congress made for climate action in the period stretching from 2032 onward.
References and Notes:
[1] Lachlan Carey and Jun Ukita Shepard, “Congress’s Climate Triple Whammy: Innovation, Investment, and Industrial Policy,” RMI, August 22, 2022, https://rmi.org/climate-innovation-investment-and-industrial-policy.
[2] There are of course many other actions Congress and the Biden Administration can take to improve the economic and environmental outcomes and implementation of these major climate and energy bills. Three of these opportunities deserves specific mention here, even though they are not detailed topics of this paper: Enhancing workforce, education, and training to match worker skills to new high growth sectors, especially in clean energy. For U.S. workers to benefit maximally from these investments will require new workforce training regimes particularly those directly involving the private sector.
Improving investments in natural resource and agricultural policy, including forest, ocean, and land management. Efforts must increase to improve the role of the U.S. forest public lands and farms in helping to mitigate climate change emissions and impacts, including the potential for civilian Climate Conservation Corps. Finally, taken together these three major laws have very large fiscal and budgetary implications which cannot be separated from their other policy goals. The U.S. must continue to reduce our debt even as we make these investments.
[10]Energy Innovation analysis estimated the IRA bill would reduce carbon emissions 37% to 41% below 2005 levels by 2030. (Mahajan et al., “Modeling the Inflation.”)
[11] The Rhodium Group study said the bill would cut emissions 31% to 44% in the same period. (Ben King, John Larsen, and Hanna Kolus, “A Congressional Climate Breakthrough,” Rhodium Group, July 28, 2022, https://rhg.com/research/inflation-reduction-act/.)
[15] Raul M. Grijalva and Bruce Westerman et al., “Letter to Nancy Pelosi and Steny Hoyer,” Committee on Natural Resources (U.S. House of Representatives, Washington, D.C.), September 12, 2022, https://naturalresources.house.gov/imo/media/doc/2022-09-12%20Group%20NEPA%20Letter%20to%20Pelosi%20and%20Hoyer%20UDPATED%202.pdf.
[17] Daniel Adamson and Paul Bledsoe, “Streamline Power Line Permitting to Achieve Ira Climate Goals,” The Hill, August 18, 2022, https://thehill.com/opinion/energy-environment/3607335-streamline-power-line-permitting-to-achieve-ira-climate-goals/.
[18] “Article 10: Duration and Implementation of the Permit Granting Process,” Regulation (EU) 2022/869) of the European Parliament and of the Council (Official Journal of the European Union, June 3, 2022), 152/70-71, https://eur-lex.europa.eu/legal-content/EN/TXT/PDF/?uri=CELEX:32022R0869&from=EN.
[29] “Baseline Performance Schedules for Environmental Reviews and Authorizations,” Federal Permitting Improvement Steering Council, April 8, 2020, https://www.permits.performance.gov/sites/permits.dot.gov/files/2020-04/FPISCRecommendedPerformanceSchedules2020_04062020.pdf.
[30] While comprehensive cost assessments for the permitting process do not exist, a 2014 GAO report found that DOE contractor costs for NEPA documents prepared between 2003-2012 cost an average of $6.6 million.
[43] “Accelerating Decarbonization of the U.S. Energy System,” National Academies of Sciences, Engineering, and Medicine, (The National Academies Press, Washington D.C.), 2021, https://doi.org/10.17226/25932.
[49] “Fact Sheet: Biden-Harris Administration Releases Permitting Action Plan to Accelerate and Deliver Infrastructure Projects on Time, on Task, and on Budget,” The White House, May 11, 2022, https://www.whitehouse.gov/briefing-room/statements-releases/2022/05/11/fact-sheet-biden-harris-administration-releases-permitting-action-plan-to-accelerate-and-deliver-infrastructure-projects-on-time-on-task-and-on-budget/.
[50] Infrastructure Investment and Jobs Act, H.R. 3684, 117th Congress (2021-2022), https://www.congress.gov/bill/117th-congress/house-bill/3684/text.
[51] Sections 40003, 50301, 50302, 50303, 60115, 60402, 60505, and 70007 of the bill are all dedicated to review and permitting funding: Inflation Reduction Act of 2022, H.R. 5376, 117th Congress (2021-2022), https://www.congress.gov/bill/117th-congress/house-bill/5376/text.
[57] John Larsen et al., “A Turning Point for US Climate Progress: Assessing the Climate and Clean Energy Provisions in the Inflation Reduction Act,” Rhodium Group, August 12, 2022, https://rhg.com/research/climate-clean-energy-inflation-reduction-act/.
Democrats’ midterm election prospects are brightening as voters’ attention shifts from high prices to abortion and the Republicans’ subservience to former President Trump and rightwing extremism.
By striking down the constitutional right to abortion, the Supreme Court has galvanized suburban women. According to liberal analyst Ruy Teixeira, Democrats now have a 27-point lead among white, college-educated women in party matchups. The ruling has thrown Republican candidates on the defensive and is spurring higher Democratic registration and turnout.
Damning testimony by former Trump White House officials in the Jan. 6 hearings, plus Trump’s inexplicable refusal to hand over top secret documents he illegally took home after leaving the White House, also seems to be moving independent voters back toward the Democrats.
House, but they now call the Senate a tossup or favor Democrats slightly to hold it. Given the usual midterm trends, a split verdict in November would be a major victory for President Biden and his party.
But one key group – white working-class voters – hasn’t budged. Democrats trail by a whopping 25 points among these voters, whose unwavering support for Trump sustains his chokehold on the GOP.
FACT: 42 of the world’s 195 countries are monarchies.
THE NUMBERS: 21st century monarchies –
Western Hemisphere: Canada, Antigua, the Bahamas, Belize, Grenada, Jamaica, St. Kitts, St. Lucia, St. Vincent.
Middle East: Bahrain, Jordan, Kuwait, Morocco, Oman, Qatar, Saudi Arabia, and the United Arab Emirates.
Europe: Andorra, Belgium, Denmark, Liechtenstein, Luxembourg, Monaco, the Netherlands, Norway, Spain, Sweden, United Kingdom.
Asia: Bhutan, Brunei, Cambodia, Japan, Malaysia, Thailand.
Africa: Lesotho and Swaziland.
Pacific: Australia, New Zealand, Papua New Guinea, Solomon Islands, Tonga, Tuvalu.
WHAT THEY MEAN:
Economist editor and poli. sci. pioneer Walter Bagehot explained in 1867 that monarchies hold public support better than republics because, being personal and symbolic rather than abstract and confusing, monarchies are more fun:
“Royalty is a government in which the attention of the nation is concentrated on one person doing interesting actions. A Republic is a government in which that attention is divided among many, who are all doing uninteresting actions.”
Recent TV statistics illustrate his thought in practice: 13.4 million Britons are said to have watched Queen Elizabeth II’s Platinum Jubilee ceremony last year, while a modest 1.3 million watched the 2019 Parliamentary debate on Brexit. Barbara Tuchman’s famous Guns of August introduction evokes the same mood with a bit less cynicism:
“So gorgeous was the spectacle on the May morning of 1910 when nine kings rode in the funeral of Edward VII of England that the crowd, waiting in hushed and black-clad awe, could not keep back gasps of admiration. In scarlet and blue and green and purple, three by three the sovereigns rode through the palace gates, with plumed helmets, gold braid, crimson sashes, and jeweled orders flashing in the sun. After them came five heirs apparent, forty more imperial or royal highnesses, seven queens—four dowager and three regnant—and a scattering of special ambassadors from uncrowned countries. Together they represented seventy nations in the greatest assemblage of royalty and rank ever gathered in one place and, of its kind, the last. The muffled tongue of Big Ben tolled nine by the clock as the cortege left the palace, but on history’s clock it was sunset, and the sun of the old world was setting in a dying blaze of splendor never to be seen again.”
Fifteen decades later, as the U.K. prepares for a similar event for his great-granddaughter next Monday — a moment of “sunset on history’s clock”, with attendant reflections on a life stretching from the Second World War, through the transition from Edward’s empire to Elizabeth’s Commonwealth, 15 Prime Ministers, etc., across seven decade of public service to the third decade of the 21st century — monarchy still seems to catch national and global imagination. Of the world’s 195* independent countries, 42 are monarchies — 15 Commonwealth realms including the U.K. itself, along with eight in the Middle East, one (Tonga) in the Pacific, two in sub-Saharan Africa, six in Asia, and 10 in continental Europe. R.I.P to a unique figure, and our sympathy with U.K. and Commonwealth friends this week.
* Using the State Department’s count of countries.
FUTURE READINGS:
Some looks back:
Then-Princess Elizabeth’s Children’s Hour broadcast during the Blitz in 1940 (pictured above).
And Danish Queen Margarethe, who marked 50 years last January, traces her antecedents back to a Viking named Gorm the Old (~ 900 A.D.) She is also queen of Greenland and the Faeroes Islands, technically autonomous realms “under the Danish crown.”
Also:
The current global count of monarchies is a bit less clear than the “42” figure suggests, since many countries retain hereditary ruling kings and queens of regions and ethnic groups incorporated in larger countries. Three examples:
Ed Gresser is Vice President and Director for Trade and Global Markets at PPI.
Ed returns to PPI after working for the think tank from 2001-2011. He most recently served as the Assistant U.S. Trade Representative for Trade Policy and Economics at the Office of the United States Trade Representative (USTR). In this position, he led USTR’s economic research unit from 2015-2021, and chaired the 21-agency Trade Policy Staff Committee.
Ed began his career on Capitol Hill before serving USTR as Policy Advisor to USTR Charlene Barshefsky from 1998 to 2001. He then led PPI’s Trade and Global Markets Project from 2001 to 2011. After PPI, he co-founded and directed the independent think tank Progressive Economy until rejoining USTR in 2015. In 2013, the Washington International Trade Association presented him with its Lighthouse Award, awarded annually to an individual or group for significant contributions to trade policy.
Ed is the author of Freedom from Want: American Liberalism and the Global Economy (2007). He has published in a variety of journals and newspapers, and his research has been cited by leading academics and international organizations including the WTO, World Bank, and International Monetary Fund. He is a graduate of Stanford University and holds a Master’s Degree in International Affairs from Columbia Universities and a certificate from the Averell Harriman Institute for Advanced Study of the Soviet Union.
In November 2016, Seattle voters approved a plan to expand the city’s light rail transit system. Almost six years later, the project still hasn’t properly begun. Instead, in January 2022 the city’s Sound Transit released a draft of their required Environmental Impact Statement, which ran more than 8,000 pages long. The final version of this EIS won’t be ready until 2023, at which point the project will already have spent hundreds of millions of dollars before a single shovel hits the ground. Current timelines, which might be delayed, call for services on the new lines to be open by 2039.
If a 23-year timeline from voter approval to project completion seems ridiculous to you, you’re not alone. America has a huge problem with not being able to build anything cheaply or quickly. One of the key obstacles is our environmental permitting process. The National Environmental Policy Act is one of America’s foundational environmental laws, but it now requires incredibly long review processes that end up doing more harm than good.
The Progressive Policy Institute (PPI) released a new report today calling for action from U.S. policymakers on the global “superbug” crisis. Antimicrobial resistant germs are killing tens of thousands of Americans annually, and the problem is only getting worse in the post-COVID age. The paper is titled, “The World Needs Better Incentives to Combat Superbugs”and is co-authored by Arielle Kane, Director of Health Care at the Progressive Policy Institute and Dr. Michael Mandel, Vice President and Chief Economist at the Progressive Policy Institute.
“Without changing how we use and develop new antimicrobials, millions more people will die, and health advances will be lost,” the co-authors write in the report.
Ms. Kane and Dr. Mandel outline a troubling public health trend that has far-reaching implications – including global economic stressors. The report authors note that roughly 35,000 Americans are killed annually by germs resistant to antimicrobials, or medicines like antibiotics and antifungals that are used to treat infections. These infections are on the rise, and without policy intervention, could kill 12 million people annually worldwide by 2050.
This crisis extends beyond a public health crisis – it is also putting the global economy at risk. According to a World Bank study, these infections could also reduce global GDP by 2%-3.5% by 2050.
The authors call for three methods in combating superbugs and the continuation of this trend, including curtailing the overuse of antimicrobials in medicine, limiting the use of antimicrobials on animals and agriculture; and new incentives to invest in the development of new antimicrobials.
The Progressive Policy Institute (PPI) is a catalyst for policy innovation and political reform based in Washington, D.C. Its mission is to create radically pragmatic ideas for moving America beyond ideological and partisan deadlock. Learn more about PPI by visiting progressivepolicy.org.