The world needs better incentives to combat superbugs

SUMMARY

Germs resistant to treatments kill roughly 35,000 Americans per year. Infections caused by drug-resistant bacteria, viruses, and fungi are on the rise, and without changes in policy, could kill 12 million people annually worldwide by 2050. Drug-resistant infections could reduce global GDP by 2%-3.5% by 2050, according to the World Bank.

The overuse of antibiotics and poor infection control during the height of the COVID-19 pandemic may have exacerbated antimicrobial resistance (AMR). AMR occurs when bacteria, viruses, fungi, and parasites evolve to no longer respond to treatments or when new pathogens that resist treatment emerge. Often referred to as “superbugs,” they pose the risk of severe illness or death.

If science doesn’t stay ahead of AMR, health care will slide backwards to the days when diseases now considered treatable — pneumonia and skin staph aureus infections — killed thousands of people each year. Yet today we’re seeing the spread of deadly strains of bacteria that can cause blood infections, pneumonia, and sepsis. That’s why the World Health Organization says that antimicrobial resistance is one of the top 10 global public health challenges threatening the practice of modern medicine.

The U.S. needs to combat these superbugs on three fronts:

• Curtailing the overuse of antimicrobials in medicine,

• Limiting the use of antimicrobials on animals and agriculture, and

• Investing in the development of new antimicrobials to stay ahead of nature.

BACKGROUND

Prior to the discovery of penicillin in 1928, diseases such as pneumonia, skin infections, meningitis, and whooping cough were often fatal. But once the use of antibiotics became mainstream in the 1940s, these infections became minor, easily treatable illnesses that no longer warranted a death sentence. The average life expectancy was extended by roughly 20 years because of the widespread use of antibiotics. But almost immediately, scientists discovered that certain types of bacteria were becoming resistant to penicillin and began working on second-generation antibiotics.

Unfortunately, scientific discovery hasn’t kept pace with evolutionary biology — both because superbugs evolve to evade antimicrobials and because new superbugs are also being discovered in the far reaches of the globe.

Without changes in scientific discovery and policy, AMR poses a risk to society and modern medicine. While pathogens are evolving to evade our current arsenal of drugs, scientific investment isn’t keeping pace in development of new antimicrobials. When COVID-19 emerged, the response was to invest in antivirals and there were roughly 260 COVID-19 antivirals in clinical development in 2020-2021. By contrast, there are only 73 new antimicrobials in clinical development because of poor incentives and a lack of investment.

PROBLEM STATEMENT

According to a recent study published in The Lancet, in 2019, 1.2 million people died directly from drug-resistant infections while AMR contributed to the deaths of 5 million additional people worldwide. This means that an infection may have exacerbated existing medical conditions and contributed to death rather than being the only causal factor.

Then came the COVID-19 pandemic. The Centers for Disease Control and Prevention (CDC) data show that resistant hospital-onset infections and deaths increased at least 15% during the first year of the pandemic. This could be because of an increase in hospital-acquired infection as more people were hospitalized, or because infection control languished as hospital staff were over-burdened with COVID-19 or because antibiotics were overused as people presented with ambiguous respiratory symptoms. But the fact remains that without changing how we use and develop new antimicrobials, millions more people will die, and health advances will be lost.

OVERUSE

About 80% of antibiotics used in the United States aren’t used by humans, but by livestock — cows, pigs, and chickens. Many industrial scale farms use antibiotics prophylactically — to prevent disease and to accelerate growth — which contributes to drug resistant pathogens living in the food and water supply. The European Union has recently banned prophylactic antibiotic use in livestock, but the U.S. and other countries don’t limit how farmers can use antibiotics.

But the overuse doesn’t stop there. In 2019, farmers under attack from a bacterial infection that threatened to decimate Florida citrus groves received permission from the Trump administration to use controversial bactericides on their trees. The Environmental Protection Agency allowed farmers across California, Florida, and Texas to use streptomycin and oxytetracycline — drugs typically used for syphilis, tuberculosis, and urinary tract infections — on their citrus plants. Using medical-grade antimicrobials increases the risk that pathogens develop resistance to these treatments in soil, water, and eventually humans.

Finally, antibiotics are overused in the practice of medicine, which is the final key driver of antimicrobial resistance. The CDC reports that 70% of the bacteria that cause two million hospital-acquired infections annually are resistant to at least one antibiotic. Although there were declines in hospital-acquired infections before the onset of the COVID-19 pandemic, hospital infections surged in recent years. This might have been because of increased antibiotics prescribed to prevent secondary lung infections brought on by a COVID hospitalization. Between March and October of 2020, 80% of hospitalized COVID patients were prescribed antibiotics.

While the prescriptions may be medically necessary, increased use contributes to resistance if science can’t stay ahead of AMR. Infection control efforts may have also lapsed under staff shortages and over-burdened hospitals.

Additionally, the CDC estimates that at least 30% of outpatient antibiotic prescriptions are unnecessary, most commonly prescribed for viral respiratory infections, such as viral bronchitis, otitis, and sinusitis. With millions hospitalized for respiratory problems, COVID likely exacerbated the overuse.

Even necessary antimicrobial use contributes to the weakened efficacy of treatments over time. Each time pathogens are exposed to antimicrobials, they have the opportunity to adapt to evade them. But unnecessary use means that patients have no medical need for the drugs, may damage their own health from taking the drugs unnecessarily, and add to the weakening of the drugs over time.

READ THE FULL REPORT


Kane for The Columbus Dispatch: Hospitals charge wildly different for same operations. New rules won’t fix that

By Arielle Kane

Back in July, federal regulators began requiring that health insurers disclose their prices for the services they cover both in- and out-of-network.

The idea is to help health care consumers better understand what their co-pays and liabilities may be depending on where they go for care.

The rule reveals, but doesn’t solve, a fundamental flaw of the U.S. health care system: widespread price variation.

As an experiment, I used a price estimate tool for OhioHealth, a large health system in Ohio. I typed in “Arthroplasty Hip/Knee Total,” a full knee replacement surgery, and searched the price as an uninsured patient. And within the same health care system, the price varied from $57,297 at Riverside Methodist Hospital to $67,842 at Grant Medical Center.

Read more in The Columbus Dispatch.

What a Reign

As a radical Democrat of a Jeffersonian persuasion, I’m no fan of hereditary privilege. But if anyone could make a monarchist of me, it would be Elizabeth Alexandra Mary Windsor, aka Queen Elizabeth II.

Her death at 96 today ends an extraordinary, epoch-spanning reign of 70 years. She was a teenaged princess during the Blitz, when Great Britain stood alone against the merciless Nazi war machine. On turning 16, she donned a uniform and served as a truck mechanic until the allied victory over Germany in 1945.

She ascended to the throne in 1952, in time to reign over the dissolution of the British Empire and its eclipse by the superpowers. On her watch came the long, pinched years of post-war deprivation, the nerve-wracking tensions of the Cold War and nuclear brinkmanship, and the outbreak of sectarian terrorism in Northern Ireland.

Of course, it wasn’t all trail and tribulation. The 1960s brought a tremendous explosion of art, comedy, theater, and music that produced the Beatles and the British Invasion and made “swinging London” a global capital of popular culture.

Margaret Thatcher, the end of the Cold War, Tony Blair and the Third Way, Brexit — through all the ups and downs and social churn, Queen Elizabeth was the constant, the sturdy embodiment of constitutional and cultural continuity. Hers was a reassuring role, and she played it bravely, intelligently, and with the old-fashioned virtue of grace.

My sympathies to her family and subjects. Elizabeth wasn’t America’s queen — but some of us will miss her, too.


PPI’s Trade Fact of the Week: The Trade Adjustment Assistance program expired June 30

FACT: The Trade Adjustment Assistance program expired June 30.

THE NUMBERS: TAA beneficiaries by sector, FY2021 –
Total 107,454
Manufacturing   80,588
Wholesaling     3,422
Information     2,227
Mining/energy     1,801
Retail        701
Agriculture          71
Accommodation/food service            0


WHAT THEY MEAN:

As 158 million American workers return from the Labor Day break to shops, offices, restaurants, factories, labs, grocery and retail checkout registers, construction sites, and bedside computer terminals, the Bureau of Labor Statistics abounds with good news. Businesses are hiring 6 million workers per month. Layoffs, contrariwise, are running about 1.3 million per month, 400,000 per month below pre-COVID levels. And the tally of unemployed workers, at 5.67 million last July, was the lowest since the golden summer of 2000 and barely half the 11.23 million currently open jobs.

Against this September’s blue and sunny labor-market skies, a policy cloud: the expiration June 30th of Trade Adjustment Assistance (“TAA” for short), a 60-year-old program dating to the Kennedy Administration which offers job training and other benefits to workers displaced by trade competition or job shifts abroad.  The end of these benefits is a challenge. But it is also an opportunity for fresh thinking, laid out in a joint piece today by PPI’s Ed Gresser and Workforce Development Policy Director Taylor Maag, which suggests going beyond simple renewal to make TAA benefits more widely available to displaced workers regardless of the cause of job loss. A couple of quick descriptive points, and then a thought on the reason for a fresh approach:

Scale and Coverage: Over the past decade TAA served an average of 91,000 displaced workers per year. Coverage is nationwide; of the 107,454 workers in the 2021 TAA cohort, 12,638 are in Texas, 11,012 in Oregon, 3,112 in Minnesota, 1,420 in Connecticut, 1,231 in Kentucky, and so on. By sector, about 75% of last year’s TAA beneficiaries (80,588 of the 107,454) were in manufacturing, as compared to 1,809 in mining and energy, 61 in agriculture and 24,966 in variety of services industries (e.g., 701 in retail, 3,422 in wholesaling, 2,227 in information industries, none in accommodation and food service, and so on).  Demographically, the 2021 beneficiaries have a median age of 51; two-thirds are men; half have high school degrees, GEDs or less; ethnically they are 65% white, 13% African American, 11% Hispanic, 9% Asian and 2% Native American.

Distinctiveness: After its 18 renewals and revisions, with especially significant ones in 1974, 2002, and 2015, TAA has become a sort of pilot program in active labor-market policy.  Its services go well beyond between-jobs income support to include self-help options for workers with widely differing career goals and local opportunities. Workers certified as TAA-eligible receive a menu of benefits: two years of job training for those interested in new career paths; temporary wage insurance for older workers taking lower-paying jobs; health care tax credits; and relocation support for workers planning a move to areas with more employment opportunities.

A comment on results: Examining the results in 2018, New York Fed researcher Ben Hyman found a strong though temporary benefit: “Ten years out, TAA-trained workers have $50,000 higher cumulative earnings, driven by both higher incomes and greater labor force participation. Yet annual returns fully depreciate after ten years. … Returns are further concentrated in the most disrupted regions.”

Where to now? The original argument John F. Kennedy made for TAA, as a complement to the Trade Expansion Act of 1962, provides a useful point of departure. His case, made with the standard New Frontier clarity and force, is that reducing tariffs and opening foreign markets promotes growth, fights inflation, helps new industries grow, and raises consumer living standards; but can also increase competition and stress at home. In such cases, he says:

“[C]ompanies, farmers and workers who suffer damage from increased foreign import competition [should] be assisted in their efforts to adjust to that competition. When considerations of national policy make it desirable to avoid higher tariffs, those injured by that competition should not be required to bear the full brunt of the impact. Rather, the burden of economic adjustment should be borne in part by the Federal Government. …  Just as the government met its obligation to assist industry in adjusting to war production and again to return to peacetime production, so there is an obligation to render assistance to those who suffer as a result of national trade policy.”

Kennedy’s logic held up for six decades and could be used again for a simple renewal. But it has a couple of weaknesses that suggest the need for a bolder approach. One relates to the particular circumstances of 2022 as opposed to those of 1962, 1974, 2002, or 2015. The other is more basic and troubling.

First, Kennedy and his successors argued for TAA as part of a national trade-liberalizing policy, in which the various benefits of an open market and export growth should be balanced with support for dislocated workers in previously sheltered industries. But with the U.S. at least for now not trying to cut tariffs, trade-related dislocation appears more likely to come from the opposite direction – trade lawsuits of the type that destabilized the solar power industry this spring, the costs that Trump-era tariffs on industrial inputs impose on U.S. machinery and automotive manufacturers, or (indirectly) retaliations against U.S. exporters. In these circumstances the case for a special program for import-related job loss is probably weaker than it was in the past.

Second, Kennedy’s case for special help for trade-displaced workers has always had an unspoken and troubling corollary:  some workers in distress, particularly in the manufacturing sector, get more help than others. Specifically, the manufacturing sector accounted for 7.0% of layoffs in 2021, and 6.2% of layoffs over the last decade.  Meanwhile, displaced manufacturing workers made up 75% of TAA beneficiaries in FY2021 and 72% over the past decade.  Retail, construction, and food service/accommodation workers who make up larger shares of annual U.S. layoffs typically make do with standard unemployment insurance. In more individual terms, TAA’s self-help policy options are much more open to a displaced auto plant worker than to a displaced auto shop worker, or to a textile worker than to a waitress or a gas station attendant.

With these facts in mind, Gresser and Maag suggest that Congress should consider something new: not removing TAA benefits as options for trade-dislocated workers by simply letting the program expire, but making them more broadly available to displaced workers, regardless of sector or cause of job loss. This is a complex question, requiring some budget thinking and possibly some reorganization of job-training and displaced-worker support more generally. But as they note in their post-Labor Day piece today, there is no better time to think about reforming and revising old labor policies than a sunny year in which jobs are plentiful and layoffs rare.

FUTURE READINGS:

TAA data and status

DoL’s TAA database, with counts of petitions and worker certifications from 2010 forward.

The DoL’s Annual Reports on TAA, FY2009 through FY2021.

And a comment on program expiration from Secretary of Labor Marty Walsh.

Policy goals and outcomes, 1962-2021 

JFK on tariff-cutting and Trade Adjustment Assistance, January 25, 1962.

Sen. Max Baucus, D-Mont., on renewal and options for reform, 2004.

An evaluation from Ben Hyman of the New York Fed, 2018.

And a Ways and Means Committee renewal hearing featuring workers, firm owners, and state officials, 2021.


ABOUT ED

Ed Gresser is Vice President and Director for Trade and Global Markets at PPI.

Ed returns to PPI after working for the think tank from 2001-2011. He most recently served as the Assistant U.S. Trade Representative for Trade Policy and Economics at the Office of the United States Trade Representative (USTR). In this position, he led USTR’s economic research unit from 2015-2021, and chaired the 21-agency Trade Policy Staff Committee.

Ed began his career on Capitol Hill before serving USTR as Policy Advisor to USTR Charlene Barshefsky from 1998 to 2001. He then led PPI’s Trade and Global Markets Project from 2001 to 2011. After PPI, he co-founded and directed the independent think tank Progressive Economy until rejoining USTR in 2015. In 2013, the Washington International Trade Association presented him with its Lighthouse Award, awarded annually to an individual or group for significant contributions to trade policy.

Ed is the author of Freedom from Want: American Liberalism and the Global Economy (2007).  He has published in a variety of journals and newspapers, and his research has been cited by leading academics and international organizations including the WTO, World Bank, and International Monetary Fund. He is a graduate of Stanford University and holds a Master’s Degree in International Affairs from Columbia Universities and a certificate from the Averell Harriman Institute for Advanced Study of the Soviet Union.

Read the full email and sign up for the Trade Fact of the Week

Why U.S. Policymakers Should Renew TAA (For Everyone)

What should the Biden administration and Congress do as Trade Adjustment Assistance expires? Consider a new approach: Renew it but drop the trade clause and reach more workers.

John F. Kennedy’s Trade Act of 1962 marked a watershed in U.S. trade policy, leading after a few years of negotiations to the largest single tariff cut in American negotiating history. It was also, though this is less well-remembered, a watershed in worker adjustment policy. The 1962 Act created the Trade Adjustment Assistance (TAA) program, which helps workers losing jobs to import competition by offering benefits that went well beyond the support available for other displaced workers. Kennedy’s argument for it noted that reducing tariffs and opening foreign markets promotes growth, fights inflation, helps new industries grow, and raises consumer living standards; but can also increase competition and stress at home. To address this, he suggested a new federal support program:

“[C]ompanies, farmers and workers who suffer damage from increased foreign import competition [should] be assisted in their efforts to adjust to that competition. When considerations of national policy make it desirable to avoid higher tariffs, those injured by that competition should not be required to bear the full brunt of the impact. Rather, the burden of economic adjustment should be borne in part by the Federal Government. …  Just as the government met its obligation to assist industry in adjusting to war production and again to return to peacetime production, so there is an obligation to render assistance to those who suffer as a result of national trade policy.”

Over the six decades since, TAA has represented a liberal-internationalist bargain, blending trade liberalization and support for exporters with a commitment to vulnerable workers. As Kennedy and each of his Democratic successors recognized, openness to foreign trade helps to catalyze the U.S. economy but can also harm less competitive domestic companies and their workers. They also recognized the value of a federal commitment to an active labor market policy that helps displaced workers develop new skills and find career paths, enabling them to support families and continue their contribution to communities and to the nation’s economy. Congress has reauthorized TAA 18 times since. The renewals in 1974, 2002, 2011, and 2015 were particularly ambitious, with the 21st century renewals adding coverage for workers grappling with internet-based competition, workers displaced by plant shifts abroad, and farmers. The most recent iteration, completed in 2015, offered reemployment services including training (on the job training, academic training, and apprenticeship), income support for those enrolled in training, job search services, relocation, and transportation benefits as well as wage subsides for older workers.

TAA thus pledged that as the U.S. reduced trade barriers, those who lost their jobs due to shifts in production and foreign labor would be adequately supported by the government to find new and often better employment. In FY2021, for example, the Department of Labor certified 801 petitions for TAA support, providing help to over 107,000 displaced workers. A statistical snapshot drawn from the Labor Department’s most recent annual report finds that 80,000 of these beneficiaries or 75% of the cohort come from the manufacturing sector. Their median age is 51; half half high school degrees or GEDs, 31% some additional schooling, and 19% are college graduates.  By gender, two-thirds are male; by race and ethnicity, two-thirds are white, 13% African-American, 11% Hispanic, and 9% Asian-American.

However, in the past decade since the 2015 reauthorization, the program has changed little. Most recently, Congress left TAA out of the stimulus and recovery packages passed in response to the COVID-19 pandemic and likewise out of the recently passed CHIPS and Science Act. As a result, TAA officially expired at the beginning of July 2022, and workers displaced by trade competition or job shifts abroad no longer can receive its support.

Where to now? TAA often received criticism, sometimes on budget grounds and sometimes on efficacy grounds. Its critics claim that the program failed to reach eligible workers, due to lack of program awareness and hoops to access services. As Andrew Stettner of The Century Foundation observed in a 2021 appearance before the House Ways and Means Committee, “Workers can only qualify for TAA if a union, local government agency, or a group of three or more workers files a petition that proves that job losses at a specific facility/unit are directly tied to trade. This is a laborious process that takes an average of 61 days from the time a petition is filed (which itself may come after a plant is closed), and as a result many potentially qualified workers do not receive coverage.”

These critiques have some force. To Stettner’s point, TAA’s impact is inherently limited by its qualification rules: A worker seeking help must know first that a special program for trade-related job displacement exists, and then be able to show that trade or jobs abroad contributed to their job loss.

Nonetheless, bipartisan policy analysis shows that TAA has had some significant success over time. New York Fed economist Ben Hyman in 2018 after comparing employment outcomes for TAA beneficiaries with outcomes for non-beneficiaries in similar circumstances, found that “ten- years out, TAA-trained workers have $50,000 higher cumulative earnings, driven by both higher incomes and greater labor force participation,” though earnings converge after a decade.  An earlier Peterson Institute for International Economics paper  highlighted significant change for the better in the 2002 TAA renewal, including increased uptake in services sectors and increased participation in skill development opportunities by affected workers. On the center-right, a recent AEI report found that TAA generally has had long-term impact on earnings for workers receiving services, especially those that received the full benefit of skills training. Additionally, as part of the 2011 reauthorization, the TAACCCT grant program was created. This program encouraged partnerships between community colleges and the workforce system to develop accelerated pathways to careers for adult learners. And a report by New America found individuals that participated in TAACCCT-funded programs were more likely to complete their training, earn a relevant credential, and find in-demand employment.

Not only have multiple sources and research found that TAA has had considerable and valuable impact for trade-displaced workers, but TAA also has a potentially greater importance as a pioneer of generous benefits that other federal programs do not always consistently offer to displaced workers. These include the length of the training benefit (two years) for workers committed to developing new skills, wage subsidies for those in training or based on age eligibility, and the option for workers in particularly distressed areas to get financial support for relocation and job search elsewhere. This type of holistic approach is increasingly important to ensure people persist and complete in their training to prepare for in-demand opportunities. And it is a good model for a better, more active support program for workers generally.

This last point leads to a final, unsettling fact for advocates of the TAA program. TAA has by nature always included a troubling inequity, inherent in Kennedy’s original case for special support for workers displaced by import competition. That is, workers who lose jobs to trade competition can get more generous benefits than workers who lose jobs to recession or domestic competition.  Is there really a strong ethical case to distinguish between (say) a displaced clothing factory worker and a displaced waitress or gas station attendant, and view the former as more in need of benefits or more entitled to benefits than the latter?

So, we return to the expiration of the program this year, and potential next steps. By missing the opportunity to renew and update TAA at all, federal policymakers are yet again forgetting about working Americans and the policies that were designed for them specifically.  On the other hand, with the Biden administration so far not seeking to open new export markets and declining opportunities to liberalize the U.S. trade regime, does the historic liberal-internationalist bargain — more open markets, support for displaced workers — still apply?  And if it is less applicable in current circumstances, should we not therefore think about an opportunity to generalize the program, so that it supports not only trade-affected workers but other workers in industries that have been hard hit over the past two and a half years from the pandemic and technological advancement?

Looking ahead, here is our take: Since TAA is expired, Congress should take this time to think about ways we can do better. Here are three ideas that could address critiques to the program and make sure it better serves workers in our 21st century economy.


  • Expand Eligibility: Consider expanding services to reach a broader group of workers — perhaps any worker – facing dislocation, for international or domestic reasons beyond their control. This would still include trade-affected workers but would also open the benefits to those dislocated from industry decline based on automation, climate-related provisions (i.e., coal) and/or fallouts from the pandemic (i.e., retail & hospitality industries).
  • Market & Streamline Services: TAA Administrators must better ensure that eligible workers know the program exists and are able to access benefits. This means a more robust public relations campaign, better partnership with other systems (i.e., workforce boards, community colleges) and community-based organizations that are reaching people on the ground as well as collaboration with employers so they can accurately communicate opportunities to at risk employees.
  • Prioritize Skill Development: While reemployment services like job search are important, we need to do a better job of helping people prepare themselves for new in-demand jobs, which often means opportunities to up-skill. Skill development opportunities available through TAA are critical to make sure dislocated workers find employment that helps them find new and better jobs.


To make these changes work, policymakers also must think about the budgetary implications. In FY 2021, prior to expiring, TAA served a total of 107,000 workers with an appropriation of $633.6 million dollars.  The precise number of workers a generalized program would serve is unclear, but current statistics on TAA use and the universe of potential new beneficiaries can provide some guideposts.  On one hand, the 80,000 manufacturing workers in the FY2021 cohort is about 6% of total manufacturing-sector layoffs, and total layoffs in a year typically average about 1 million.  On the other, the most likely users are long-term unemployed workers unable to find new jobs quickly, and the total long-term unemployed population has varied in recent years between the current 1.2 million and 3 million.  Such figures suggest that a million displaced workers might be something of an upper bound.  To serve this many dislocated workers across an array of disrupted industries and the long-term unemployed, TAA’s budget would have to increase about ten-fold, reaching roughly $6 billion annually. However, that number shouldn’t alarm policymakers and probably can be reduced. Determining whether a particular worker’s layoff is ‘trade-related’ requires a significant investment in administrative overhead and costs. A more generalized program would reduce the time and money spent on proving eligibility. Additionally, with an expanded TAA, other federal workforce programs may be duplicative and unnecessary. This means programs could be consolidated or cut, which could also help reduce costs.

In sum, the TAA program is an important one, delivering valuable benefits to hundreds of thousands of workers each year. Congress should remember this impact and make sure it does not simply disappear.  It should also remember, though, that trade is far from the largest cause of job displacement, and all workers — especially those in lower-skilled jobs that are subject to increased disruptions as the economy changes — deserve support. With the program lapsed, federal policymakers should consider ways to improve and broaden it. An updated policy could focus beyond trade and international competition, and provide adjustment assistance for all economic disruption, would help empower working Americans to advance by giving them access to the skills and financial support necessary to find new and emerging in-demand work. This is critical to enhance workers’ confidence, broaden economic opportunity, and help our nation grow from the bottom up and middle out.


Johnson for Liberal Currents: The Case for Abolishing the National Environmental Policy Act

By Jeremiah Johnson

In November 2006, Superior Court Judge Peter Busch upheld a preliminary injunction against the city of San Francisco, preventing them from moving forward with their plan to build new bike lanes and bike infrastructure. Busch ruled that the city hadn’t properly followed the environmental review process mandated by the California Environmental Quality Act, or CEQA. In November 2008, San Francisco was finally finished with the review. All it took was more than 2.5 years, 1,353 pages and more than $1 million in direct costs. This allowed San Francisco the chance at a public hearing in January of the next year, after which the bureaucratic process could either continue or face more delays.

If you think a two year, million dollar, 1,000+ page environmental report simply to build new bike lanes in an already developed city seems absurd, you’re not alone. Americans are more concerned than ever about addressing climate change, but one of America’s foundational environmental laws is functionally preventing us from doing so. The National Environmental Policy Act—and its state level equivalents such as CEQA—make it far too difficult to take major actions that would help lower carbon emissions. NEPA is a fundamentally broken piece of legislation and should be entirely repealed.

Read the full piece in Liberal Currents.

Weinstein for Forbes: U.S. School Closures Leave Students Behind

By Paul Weinstein Jr.

Since the Civil War, the president’s party has had a net loss of seats in 36 out of 39 midterm elections. However, this year could be different. With the Supreme Court’s decision to repeal a women’s right to choose, Democratic voters have become increasingly energized. That, combined with a slate of extremist Republic candidates, has increased the odds that Democrats will hold the Senate and turn what was expected to be a red wave in the House of Representatives into a drip.

But if Democrats want to further strengthen their chances in the Senate and the House, they will need to restore parent’s trust in all our schools.

As Will Marshall, founder and president of the Progressive Policy Institute recently noted, faith in public schools is approaching a nadir. Less than 30% of Americans have confidence in their children’s schools, and since the onset of the pandemic, 1.4 million children have left the public school rolls.

Read the full piece in Forbes.

Remembering Why We Celebrate Labor Day and How We Keep Moving Forward

As Americans across the country celebrate their long weekend, marking the end of summer, PPI wants to remind everyone the reason for this holiday — American workers — and offer a new way for our government to celebrate them.

Labor Day became a federal holiday in 1894, to acknowledge the contributions and achievements of American workers. As the economy shifted from agriculture to manufacturing, workers pressed for better working conditions and higher pay, and the holiday commemorated that struggle.

While today, we applaud those who fought for progress, we also must acknowledge that we are living in a very different world than we were a century ago. Today, jobs are changing, and new jobs are being created due to technical advancements. As a result, workers, especially those in jobs at risk of being automated, need to learn new skills to remain relevant. On top of that, the nation is still recovering from a global pandemic which disrupted service industries that are critical to our nation’s tourism, health, and learning, including retail and hospitality industries as well as health care and teaching careers.

We need new policies that truly help American workers economically advance.

Yet federal policymakers have done little to support working Americans that have been hardest hit by these shifts. While stimulus dollars provided workers emergency assistance, there has been too little policy innovation aimed at getting people back to work in good jobs that offer new opportunities for upward mobility.

This neglect has affected workers returning to jobs that are facing severe labor shortages — changing hours and ways of operation (i.e., health care workers and teachers); workers that have been laid off and need re-skilling to find in-demand employment and workers that have left the workforce entirely due to personal and familial needs. These challenges are affecting workers across an array of careers, industries and circumstances— leaving more and more people feeling frustrated and forgotten.

This Labor Day, PPI urges our government, to recommit to workers across our nation. This recommitment does not mean pouring more dollars into the status quo, but focusing on quality skill development strategies — deploying new and innovative policies that work to solve persisting challenges facing workers.

Federal policymakers should continue to look at apprenticeship models, scaling these opportunities across an array of industries to ensure more Americans can access quality earn and learn programs. They should expand opportunities in the short-term — including more flexible postsecondary programs that better meet the needs of individuals, their families and businesses — and they should work to harness the power of private markets and innovations in technology to provide new ways of delivery learning that are tied to industry demand.

These approaches can help solve talent shortages in industries that are key to our health, education and safety; create opportunities for individuals to access skill development opportunities so they can prepare for the jobs of today and tomorrow and provide the necessary supports individuals need to retain employment while also supporting their families.

This is critical to ensure American workers are better off, can economically advance, and we avoid further leaving behind those that are working so hard to keep America thriving. If we could do that — now that would be something to celebrate.

PPI’s Trade Fact of the Week: 1.4 million Americans have Pacific Island roots

FACT: 1.4 million Americans have Pacific Island roots.

THE NUMBERS: U.S.-Pacific Island economic links –

Aid                 $20 million
Imports          $486 million
Remittances  $300 million

WHAT THEY MEAN:

Speaking last month to the Pacific Islands Forum (the annual assembly of 18 countries and territories around the South Pacific*), Vice President Harris regretfully observes that “in recent years the Pacific Islands may not have received the diplomatic attention and support that you deserve.” To make up for lost time, she announces an array of new political and economic supports, to be finalized this September at the first U.S.-Pacific Islands summit ever held:

  • Opening new embassies in Tonga and Kiribati (both countries of about 100,000 people, now served by the U.S. embassy in Suva, the capital of Fiji), along with an AID office in Fiji and a new Peace Corps volunteer program.
  • Raising annual U.S. aid to Pacific Island states from $21 million to $60 million for “economic development and ocean resilience” along with “infrastructure programs that are sustainable, high quality, climate friendly, and very importantly do not result in insurmountable debts.”
  • Pledging to conclude a long-pending South Pacific Tuna Treaty and cooperative policies to reduce illegal/unreported/unregulated fisheries.

All this will be amplified, presumably with more ideas, by a “U.S. National Strategy on the Pacific Islands” to be published sometime after the summit.  Some explanation below, plus a couple of suggestions:

Background: The South Pacific expanse spans 3,000 islands, spread out over an expanse of sunlit water as large as Asia, Europe, and North America combined.  These islands combine to form 14 independent countries, two French departments, one U.S. state plus three insular territories.  They are home to 50 million people, of whom 35 million live in Australia and New Zealand, 9 million in Papua New Guinea, 1.5 million in Hawaii, and 2.5 million in the other 15 countries and territories combined.

This region suddenly seems like an arena for big-power diplomatic competition. Some of its rapidly proliferating Chinese aid programs are civilian and visually striking: a ring road around Papua New Guinea’s capital Port Moresby, a large hospital on the coastal road east of Suva in Fiji, a “royal military band” facility in Tonga. Others carry murkier overtones of intelligence and high naval strategy: leaked mutual defense and telecommunications arrangements between China and the Solomon Islands, the sudden withdrawal of coral atoll-state Kiribati from the Forum after a visit by the Chinese Foreign Minister, etc.  With this subtext, the VP’s concern and interest presumably goes beyond abstract hope to raise the American diplomatic profile.

The policy outlined in her speech focuses, along with climate and fisheries policy, on aid and infrastructure development. These are useful and needed no doubt; on the other hand, the impact of aid likely has some limits.  On one hand, the Pacific Islands are already the world’s most aid-saturated region.  By the Sydney-based Lowy Institute’s calculations, they receive $2.4 billion in aid annually.  This amounts to 10 percent of the region’s economy, a figure sixteen times higher than the 0.6% average for all low- and middle-income countries.  Adding more may encourage the governments of very small countries – setting aside Papua New Guinea, the populations range from 11,000 in Nauru to 900,000 in Fiji – to take on more aid than they can manage.

More conceptually, a strategy focused particularly on aid may miss an area of American “comparative advantage”, which Harris’ speech notes in observing that 1.4 million Americans trace family to the Pacific islands.  A useful insight here comes from the influential 1993 essay Our Sea of Islands, in which the late Tongan intellectual Epeli Hau’ofa argued that the people of Pacific island nations should see themselves as citizens of a large ocean continent extending to expatriate communities in the United States, Australia, and New Zealand, rather than as comparatively helpless residents of small and isolated islands.  He notes in particular the large role these communities play in island economies through remittances and exchanges of goods (clothes, TVs, refrigerators etc. going to the islands; crafts, agricultural goods, information coming in turn), and concludes with a caution against very heavy reliance on aid: “Ordinary Pacific people depend for their daily existence much more on themselves and their kin, wherever they may be, than on anyone’s largesse.”

With this in mind, two policy options for the VP and her administration associates as they think about next steps:

1. Trade preferences: Americans bought $0.5 billion worth of goods from Pacific islands last year. This is a tiny sum in the $2.8 trillion world of U.S. goods imports, but a large part of the islands’ export portfolio.  A simple way to bolster it would be renewal of the Generalized System of Preferences, the main U.S. trade program for developing countries, which lapsed in 2020.  Before the lapse, it provided substantial support for growth and employment through candied and sushi-grade ginger and taro from Fiji, canned tuna from the Solomon Islands, taro and cassava from Tonga. A more ambitious option would be creation of a special trade program analogous to the Caribbean Basin Initiative’s permanent duty-free access to the U.S., which could offer additional support for processed fish exports.

2. Reducing remittance costs: The 1.4 million Americans from Pacific Island and Native Hawaiian families noted in Harris’ speech are a source of income almost equal to trade. Remittances — wires of money from workers abroad to families — account for 7%-10% of Pacific island GDP, and peak at levels of 43% of GDP for Tonga and 21% for Samoa. Assuming a roughly equal division between the islands’ three main remittance sources (the U.S., Australia, and New Zealand), this would probably mean about $300 million per country.  The challenge is that, by World Bank tallies, Pacific islanders abroad pay a lot more than other remittance senders for their generosity:  bank and wire fees eat up 11% of remittance value for Vanuatu, 9.8% for Tonga, and 8.4% for Samoa.  Reducing these costs to 2.9% of remittance — the figure for equally remittance-reliant El Salvador — this would free up as much as 2% of national income for some countries, all of which would go directly to families.

Summary: Harris’ remarks are a thought-provoking read and a good beginning for policy; but one has room for more.

* Australia, Cook Islands, Marshall Islands, Federated States of Micronesia, Fiji, French Polynesia, Marshall Islands, Nauru, New Caledonia, New Zealand, Niue, Palau, Papua New Guinea, Samoa, Solomon Islands, Tonga, Tuvalu, Vanuatu, and associate member Tokelau. Outlier Kiribati withdrew on July 14.

FUTURE READINGS:

Some quick geography/economy background: Geographers traditionally divide the South Pacific into three areas with Fiji more or less in the middle. Melanesia, just north and east of Australia, includes Papua New Guinea, the Solomon Islands, New Caledonia, and Vanuatu, which have large extractive-industry economies driven by timber and mining exports to China. Polynesia, the largest expanse of ocean, goes east from Fiji through Tonga and Samoa to Tahiti, Hawaii and Easter Island (and also includes New Zealand’s Maori community), with fisheries along with taro, vanilla, ginger, and other specialty agriculture. Most Polynesian trade is with the U.S., Australia, and New Zealand. Micronesia, in the north heading toward Guam, has six countries mostly made up of small coral atolls with especially high climate change risk; three of these (Palau, the Marshall Islands, and the Federated States of Micronesia) have special trade access to the U.S. dating to their independence.  Fiji, in the center, is a middle-income state with a diversified economy with the region’s main air and maritime logistics centers and the University of the South Pacific, along with a large tourism sector, agriculture, and light manufacturing.

U.S. policy:

Remarks by Vice President Kamala Harris to the Pacific Islands Forum.

The White House promises more in the run-up to next month’s Summit.

Capitol Hill views from the Congressional Pacific Islands Caucus.

Policy spectrum: 

regional overview from the Forum Secretariat looks at climate change response, COVID, nuclear weapons tests legacies, and big-country diplomacy.

Epeli Hau’ofa’s Our Sea of Islands essay and other writings on Pacific islands culture and government in We Are the Ocean.

The Diplomat on Kiribati’s withdrawal from the Forum.

Brookings Institution China scholar Patricia Kim on the possible implications of the China-Solomon Islands security document.

Trade:

Trade Fact series editor/PPI Vice President Gresser, then in government, visits a Fijian ginger factory and GSP exporter in 2018. They were buying sushi-quality vinegar from Oregon and Florida-made machinery, and selling candied ginger and sushi ginger back.

And a look at the GSP program, with a friendly critique of Congressional reauthorization bills and suggestions for next steps.

Remittances:

The World Bank on remittance flows to Pacific Island nations during and after COVID.

Sydney-based Lowy Institute on remittance policy.

Aid programs from the U.S./Australia/New Zealand:

The Lowy Institute’s Pacific Aid Map, with aid figures by country and donor.

USAID’s Pacific Islands programs.

MCC’s Solomon Islands Threshold Program.

AUSAID’s Pacific programs.

And New Zealand’s Pacific Islands aid and diplomacy.

And from China:

MoFA on China’s Pacific aid programs.

… and the Chinese Embassy in Tongan capital Nuku’alofa reviews deliveries of water tanks, computers, and tractors along with building a “royal military band” facility.

ABOUT ED

Ed Gresser is Vice President and Director for Trade and Global Markets at PPI.

Ed returns to PPI after working for the think tank from 2001-2011. He most recently served as the Assistant U.S. Trade Representative for Trade Policy and Economics at the Office of the United States Trade Representative (USTR). In this position, he led USTR’s economic research unit from 2015-2021, and chaired the 21-agency Trade Policy Staff Committee.

Ed began his career on Capitol Hill before serving USTR as Policy Advisor to USTR Charlene Barshefsky from 1998 to 2001. He then led PPI’s Trade and Global Markets Project from 2001 to 2011. After PPI, he co-founded and directed the independent think tank Progressive Economy until rejoining USTR in 2015. In 2013, the Washington International Trade Association presented him with its Lighthouse Award, awarded annually to an individual or group for significant contributions to trade policy.

Ed is the author of Freedom from Want: American Liberalism and the Global Economy (2007).  He has published in a variety of journals and newspapers, and his research has been cited by leading academics and international organizations including the WTO, World Bank, and International Monetary Fund. He is a graduate of Stanford University and holds a Master’s Degree in International Affairs from Columbia Universities and a certificate from the Averell Harriman Institute for Advanced Study of the Soviet Union.

Read the full email and sign up for the Trade Fact of the Week

Korean App Economy Update 2022

INTRODUCTION

Korea is one of the leading technology countries in the world. By some measures, Korea’s manufacturing sector is more diversified and complex than U.S. manufacturing.

In this report, we focus on one aspect of Korea’s technological strength: the App Economy, which reflects the employment of workers to develop, maintain, and support mobile applications. The global App Economy expanded rapidly during the pandemic. Individuals and businesses were suddenly dependent on the internet, their smartphones, and their mobile applications for critical daily activities like work, shopping, and communication with loved ones. The App Economy, already important, became an increasingly indispensable part of the real economy.

In Korea, the pandemic was much more controlled compared to the United States and Europe. Still, almost overnight, huge swathes of economic activity that relied on face-to-face interactions were forced into virtual mode. In Korea, time spent on mobile applications rose from 4.1 hours in 2019 to 5.0 hours in 2021, the third highest in the world.

Even as the pandemic enters a milder stage largely due to vaccines, many jobs and economic interactions are still remote, placing an increased premium on mobile communications. After a slow start because of government regulations, Korean health organizations have learned about the usefulness of telemedicine apps. Korean financial companies like Toss and Kakao Bank are increasingly doing transactions through their mobile apps. Delivery apps are also still experiencing booming business.

In Korea, as in other countries, the increased prominence of the App Economy is reflected in the growing number of jobs that required App Economy skills. We did our first report on Korea’s App Economy in 2018, using detailed data on job postings as our major tool for analysis. In this 2022 report, we update our previous estimate, finding that Korea has 516,000 App Economy jobs as of July 2022, a number that is highly competitive globally. We end with a brief discussion of policy.

MEASURING THE APP ECONOMY

As the App Economy grows in significance globally, it becomes essential to have a consistent set of App Economy job estimates so that policymakers can compare their country’s performance with that of other countries. However, official economics statistics do not provide an easy way to measure the size of the App Economy. In response, PPI developed a methodology based on a systematic analysis of online job postings. In particular, we look for job postings that call for app-related skills such as knowledge of iOS or Android. We issued our first App Economy report for the United States in 2012. Since then, this methodology has been applied to a wide variety of countries, languages, and economic environments.

Our goal is to produce a set of globally-consistent and credible estimates for App Economy employment by individual countries, by broad geographical regions, and in some cases by major cities. The ultimate objective is to be able to track the growth of the App Economy globally, and to see which countries are benefitting the most. Ideally, we should be able to link App Economy growth to policy measures implemented by governments. For this study, a worker is in the App Economy if he or she is works in:

• An information and communications technology (ICT) related job that uses App Economy skills — the ability to develop, maintain, or support mobile applications. We will call this a “core” App Economy job. Core App Economy jobs include app developers; software engineers whose work requires knowledge of mobile applications; security engineers who help keep mobile apps safe from being hacked; and help desk workers who support use of mobile apps.

• A non-ICT job (such as human resources, marketing, or sales) that supports core App Economy jobs in the same enterprise. We will call this an “indirect” App Economy job.

• A job in the local economy that is supported by the income flowing to core and indirect App Economy workers.

These “spillover” jobs include local retail and restaurant jobs, construction jobs, and all the other necessary services.

To estimate the number of core App Economy jobs, we use a multi-step procedure based on data from the universe of online job postings. Our first observation is that online job postings typically describe the skills and knowledge being sought by the employer. For example, if a job posting requires that the job candidate have experience developing apps for iOS or Android, then we can reasonably conclude that the posting refers to a core App Economy job. The methodology section at the end of the paper describes the procedure in detail.

RESULTS

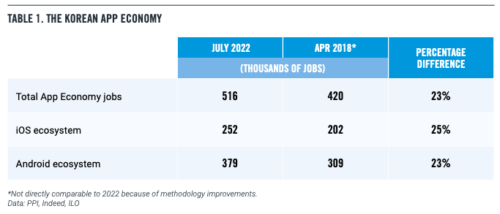
Table 1 presents an estimate of App Economy jobs in Korea. We estimate that Korea has 516,000 App Economy jobs as of July 2022. This figure includes a conservative estimate of spillover jobs. Our methodology also allows us to estimate the relative share of mobile operating systems in Korea’s App Economy. We find that the iOS ecosystem includes 252,000 jobs, and the Android ecosystem includes 379,000 jobs. The two numbers sum to more than the total because many App Economy jobs belong to both ecosystems.

These figures are 23% to 25% higher than our previous 2018 estimates for Korean App Economy employment. Because of improvements in the implementation of the methodology, the number are not directly comparable. Nevertheless, this increase across the pandemic years is similar to what we see in other countries.

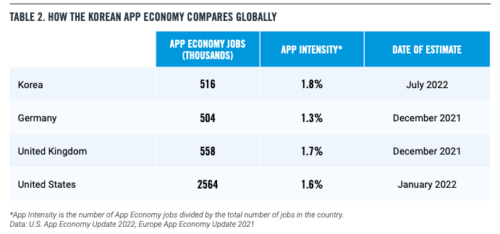
Table 2 compares Korea’s App Economy with the United States, Germany, and the United Kingdom, three large technologically advanced countries (we currently do not have a public estimate for China or a recent report for Japan). Korea has roughly the same number of App Economy jobs as Germany, somewhat less than the U.K., and much fewer than the U.S.

However, a better measure for comparing the App Economy of countries of different size is “App Intensity.” We define App Intensity as the number of App Economy jobs divided by the total size of employment. We see from Table 2 that Korea’s App Intensity of 1.8% is higher than the U.K., the U.S., and Germany.

Another way of assessing the strength of Korea’s App Economy is to look at the nationality of the companies who are doing well in terms of downloads and consumer spend. In 2021, measured by number of downloads, 9 out of the top 10 companies are headquartered in Korea, led by NAVER, Kakao, and SK Group. Measured by consumer spend, 8 out of the top 10 companies are Korean.

It’s useful to compare Korea with Germany’s App Economy. The two countries have roughly the same number of App Economy workers. But in Germany, only 3 out of the top 10 companies measured by downloads are headquartered in Germany, and only 2 of the top 10 by consumers spending. Five are headquartered in the United States, two are headquartered in the U.K., and one is headquartered in China.

POLICY AND CONCLUSIONS

Korea’s App Economy has entered an interesting period of development and regulation. Up to now, the Korean App Economy has been a sizable contributor to national employment. But notably, it was based on a system where much of the cost of building, maintaining, and supporting the Korean app infrastructure has been provided by non-Korean firms, Apple and Google. At the same time, these companies received a share of download fees and in-app purchases. In effect, Apple and Google were getting a financial return on investing in the Korean App economy.

Korea implemented new regulations on the Apple App Store and Google Play as of March 2022, which required Apple and Google to give developers more choices for in-app payment systems. In response, the two U.S. tech companies reduced their commission somewhat for developers who used alternative payment systems. In addition, Apple required developers to provide a separate binary for Korean iOS apps that use non-Apple payment systems. That’s one step toward a globally fragmented internet.

The group of Korean companies that monetize their apps through download fees and in-app purchases — many of which are gaming and entertainment companies — would prefer that Apple and Google charge even lower commission rates. However, there is a much larger second group et of Korean companies whose apps do not charge significant download fees or make heavy use of in-app purchases. This second group would likely prefer the current system, because they benefit from distribution and malware screening services for virtually no cost. This second group would include banks, retailers, manufacturers, providers of telemedicine services, providers of travel apps, and virtually any app connected with the physical economy.

Security and privacy concerns will also be important for policy going forward. Apple and Google follow different mobile app development and distribution strategies, with Google taking more of an open approach and Apple restricting app downloads to the App Store. Nevertheless, both companies devote huge technological resources to scanning apps uploaded to their official stores for malware. These investments have helped fuel the success of the Korean App Economy, which has been built on trust that downloaded apps will be safe. Regulators who underestimate security and privacy concerns run the risk of undercutting consumer trust in the mobile app ecosystems, and making it more difficult to use apps for key functions such as banking and health.

Finally, there is a broader issue as well. As one of the most technologically advanced countries in the world, Korean companies sell products and services globally, including cutting-edge chips, which embody large amounts of investment and intellectual capital. The question is whether Korea should be in favor of a global regulatory regime which intervenes in new technologies and significantly reduces the return on successfully-invested capital. That’s not the way to achieve global growth or national success.

Read the full report and download the report in English or Korean:


New PPI Report estimates 516,000 App Economy jobs in Korea as of July 2022

A new report on the Korean App Economy released today by the Progressive Policy Institute shows the prominence of the App Economy in Korea — reflecting the employment of workers to develop, maintain and support mobile applications — has grown as more jobs require app-based skills. The new report shows significant gains in App Economy jobs since our previous report on the Korean App Economy, published in May 2018. The new report also finds that Korea’s “app intensity” exceeds that of Germany, the United Kingdom, and the United States. This report is authored by PPI’s Vice President and Chief Economist, Dr. Michael Mandel.

“Korea’s App Economy is highly competitive globally,” said Dr. Michael Mandel. ”The key question is whether a new wave of regulation will help or hurt the functioning of the Korean App Economy.”

Download the full report in English here.

Download the full report in Korean here.


The Progressive Policy Institute has developed a methodology to measure App Economy jobs and shifting trends, publishing their first report for the United States in 2012. Since, this methodology has been applied to a wide variety of countries, languages, and economic environments. The first Korean App Economy report was published in 2018.

The Progressive Policy Institute (PPI) is a catalyst for policy innovation and political reform based in Washington, D.C. Its mission is to create radically pragmatic ideas for moving America beyond ideological and partisan deadlock. Learn more about PPI by visiting progressivepolicy.org.

Follow the Progressive Policy Institute.

Find an expert at PPI.

###

Media Contact: Aaron White; awhite@ppionline.org

Marshall for The Hill: Ban the culture war from classrooms

By Will Marshall

As America’s children start getting back to school this month, our country needs a grown-up conversation about public education’s future. The odds of having one this fall are slim.

It’s more likely that the midterm election campaign will intensify today’s noxious trend toward politicizing public schools. That’s reprehensible, because our children, who suffered severe learning losses and emotional stress during the pandemic, deserve better than to be treated as hostages in the nation’s vitriolic culture wars.

Republicans, who seem to be at war with all of America’s public institutions, are the worst offenders. But Democrats aren’t blameless, and even as they fend off the right’s demagogic attacks on public schools, they need to come to grips with the valid reasons why parental frustration is boiling over.

Read the full piece in The Hill.

PPI’s Trade Fact of the Week: Mexico is now the principal source of illicit fentanyl and methamphetamines sold in the U.S.

FACT: Mexico is now the principal source of illicit fentanyl and methamphetamines sold in the U.S.

THE NUMBERS: U.S. deaths by drug overdose –
2021 total
 107,500*
Opioids
 73,400 deaths among 9.5 million users
Psychostimulants
 32,500 deaths among 2.6 million users
Cocaine
 26,000 deaths among 5.2 million users
Heroin/other opiates
   8,000 deaths among 0.9 million users
* Mortality from overdoses from the Centers for Disease Control; user totals from HHS’ Substance Abuse and Mental Health Services Administration. Many overdose deaths involve use of combinations of drugs, so overdoses measured by individual substances often double- or triple-count.


WHAT THEY MEAN:

After two decades of steady escalation, drug overdoses caused over 107,000 premature deaths in the United States last year. This was more than double the 41,500 overdose fatalities of 2012 and six times the 17,400 recorded in 2000. Or, alternatively, it is more than the combined total of U.S. deaths to automobile accidents (38,800 in 2020, 42,400 in 2021) and homicides (24,600 in 2020, likely higher in 2021).

Four classes of drugs, often in combination, account for most of these overdoses: synthetic opioids such as fentanyl, whose very high “purity” and variable chemical content make them especially dangerous; “psychostimulants” such as methamphetamines; cocaine; and heroin along with other natural or semi-synthetic opiates refined from naturally grown opium poppies. The Drug Enforcement Administration’s most recent “Annual Drug Threat Assessment” report, released in early 2021, suggests that (a) most of these products are imported, and (b) supply chains for opioids and amphetamines have changed substantially over the past decade and now center on Mexican production and land transport. A precis:

1. Opioids and opiates: A decade ago, fentanyl was mostly made in China and (being very light and cheap to transport) shipped to the U.S. via air cargo. Use of this from-China-by-air route has sharply declined since 2019, however. Most U.S.-consumed fentanyl is now produced in Mexico and moved to the U.S. by land. DEA’s report suggests a complex and adaptable precursor-chemical “supply chain,” with the relevant chemicals “primarily from sources originating in China, including purchases made on the open market, smuggling chemicals hidden in legitimate commercial shipments, mislabeling shipments to avoid controls and the attention of law enforcement, and diversion from the chemical and pharmaceutical industries.” Heroin production appears simpler in the DEA report; about 92% is from Mexico, refined from locally grown opium.

2. Psychostimulants: The methamphetamine supply system has likewise evolved over the past decade, though in this case away from local U.S. lab production. As with heroin, “most of the methamphetamine available in the United States is clandestinely produced in Mexico,” using precursor chemicals purchased from China and India. As with opioids and heroin, the finished products travel mainly by land.

3. Cocaine: Coca leaf is grown and refined into cocaine principally in Colombia and secondarily in Bolivia and Peru. DEA believes total cocaine production is around 1,900 tons per year. Cocaine trafficking routes appear to have remained stable over the last two decades, with cocaine transported in smuggling boats and planes, or using cargo containers, through the Caribbean with smaller quantities arriving by land through Central America and Mexico.


FUTURE READINGS:

CDC’s grim estimates of death by drug overdose in the United States, 2000-2021, summarized by year:

2021 107,500
2020   92,500
2019   71,100
2016   63,600
2012   41,500
2000   17,400

And the numbers in detail by year and substance.

The Substance Abuse and Mental Health Services Administration has tables for use of narcotics, abuse of prescription drugs, marijuana, alcohol and tobacco use.

The White House releases the 2022 National Drug Control Strategy, including health and overdose prevention, data improvement, DEA and CBP funding, anti-money laundering programs, and international police coordination.

And DEA’s 2020 National Drug Threat Assessment reviews use, production, and trade of narcotics.

And three global economy context questions:

(a) How large is the international narcotics trade? A 2019 RAND study estimates that in 2016 Americans were spending $150 billion on narcotics. This total included $50 billion on marijuana and $100 billion on heroin, cocaine, and methamphetamines, but did not venture a guess on opioids. Accepting RAND’s estimate for the sake of argument, a guess at the value of the imports would require understanding the markup from border to distributor to retail. As a guidepost, the National Coffee Association put U.S. consumer spending on coffee (also almost entirely imported) at $74 billion, or about 12 times that year’s $6 billion in coffee imports. A 10:1 markup for heroin, cocaine, and amphetamines would suggest an import value of around $10 billion, but presumably a criminal business’ markup would have to be much higher.  At 20:1, a figure of $100 billion in U.S. retail spending on narcotics would imply $5 billion in import value, the equivalent of about 1 percent of the $385 billion in legitimate imports from Mexico in 2021, and not far from the value of total U.S. coffee imports.  Obviously the 20:1 figure is arbitrary and could be quite different, and may also vary by narcotics type.

(b) How large is the criminal economy? On a world scale, a 2017 paper by the DC-based Center for Global Financial Integrity guessed at a total of $426 billion to $651 billion for illicit drug trade as of 2014, including both intra-country and cross-border transactions, as part of a larger $1.8-$2.2 trillion global shadow economy. (The other elements include counterfeiting, human trafficking, illegal wildlife/fishery/logging exports, and other illicit activities.) Cocaine, amphetamines, opiates and opioids accounted for about 60% of the illegal drug business, and marijuana and hashish-type products 40%. The ~$2 trillion estimate, if correct, would have been about 2.5% of that year’s $77 trillion global GDP.

(c) How many drug users are there, and which countries are the largest narcotics markets? UN’s Office on Drugs and Crime’s annual World Drug Report reviews production, transport, health, and other policy matters, and also estimates users counts worldwide.  Their most recent guesses:  209.2 million users of cannabis, 61.3 million of opioids, 34.1 million of amphetamines and other stimulants, 31.1 million of opiates, and 21.5 million of cocaine.  The analysis of use in UNODC’s 2022 report covers regions rather than countries, but suggests (though not stating explicitly) that the U.S. is the world’s largest narcotics market and largest importer: “North America” is the largest market for cocaine and amphetamines, and at par with Asia for opioids.  By population, comparing HHS user estimates for the U.S. to the UN’s worldwide estimates, American narcotics use seems slightly above the world average rate for amphetamines (2.6 million of the UN’s 34.1 million users), below the average for heroin and other opiates, and well above average for fentanyl-type opioids and cocaine.  Read more in the UNODC’s World Drug Report 2022.

ABOUT ED

Ed Gresser is Vice President and Director for Trade and Global Markets at PPI.

Ed returns to PPI after working for the think tank from 2001-2011. He most recently served as the Assistant U.S. Trade Representative for Trade Policy and Economics at the Office of the United States Trade Representative (USTR). In this position, he led USTR’s economic research unit from 2015-2021, and chaired the 21-agency Trade Policy Staff Committee.

Ed began his career on Capitol Hill before serving USTR as Policy Advisor to USTR Charlene Barshefsky from 1998 to 2001. He then led PPI’s Trade and Global Markets Project from 2001 to 2011. After PPI, he co-founded and directed the independent think tank Progressive Economy until rejoining USTR in 2015. In 2013, the Washington International Trade Association presented him with its Lighthouse Award, awarded annually to an individual or group for significant contributions to trade policy.

Ed is the author of Freedom from Want: American Liberalism and the Global Economy (2007).  He has published in a variety of journals and newspapers, and his research has been cited by leading academics and international organizations including the WTO, World Bank, and International Monetary Fund. He is a graduate of Stanford University and holds a Master’s Degree in International Affairs from Columbia Universities and a certificate from the Averell Harriman Institute for Advanced Study of the Soviet Union.

Read the full email and sign up for the Trade Fact of the Week

PPI Statement on Student Debt Cancellation

Ben Ritz, Director of the Center for Funding America’s Future project at the Progressive Policy Institute (PPI), released the following statement regarding President Biden’s executive order to cancel up to $20,000 of student debt for most borrowers:

“We are disappointed that the Biden administration has caved in to left-wing demands to pursue mass debt cancellation through executive action. This decision will cost taxpayers much more money than the Inflation Reduction Act will save for the foreseeable future and undermine the administration’s claim that it is doing everything it can to bring rising prices under control.

“Whether it’s through inflation today, or higher taxes and spending cuts tomorrow, workers who don’t reap the benefits of a college education will bear the costs of canceling debt for those who do. Policymakers should instead be focusing on finding ways to control the underlying problem of skyrocketing tuition and provide stronger post-secondary pathways to good jobs that are more affordable and flexible than a traditional four-year degree.

“Attempting to grant mass debt cancellation by executive order also risks setting a dangerous precedent that would allow future presidents to unilaterally spend over a trillion dollars of taxpayers’ money without explicit approval from their representatives in the House and Senate. Congress and the courts must set clear guardrails to prevent future presidents from abusing their discretion and usurping the power of the purse.”

Read More on student debt cancellation from PPI:

Six Reasons Biden Should Not Cancel Student Debt
Broad Student Debt Cancellation Would Backfire
The Right Way To Do Student Debt Relief

Listen to Ben’s recent TV and radio interviews on student debt cancellation.

The Progressive Policy Institute (PPI) is a catalyst for policy innovation and political reform based in Washington, D.C. Its mission is to create radically pragmatic ideas for moving America beyond ideological and partisan deadlock. Learn more about PPI by visiting progressivepolicy.org.

Follow the Progressive Policy Institute.

Find an expert at PPI.

###

Media Contact: Aaron White; awhite@ppionline.org

Ritz for The Hill: Six reasons Biden should not cancel student debt

By Ben Ritz

Next week, President Biden’s executive order imposing a freeze on student loan repayments and interest accrual is set to expire. It’s almost guaranteed that the president will extend the freeze for a fifth time because no effort has been made to notify borrowers that payments are resuming, and to do so now would be providing too little time to prepare.

But in addition to extending the current freeze, Biden is under tremendous pressure from a years-long campaign by leftwing activists to cancel at least $10,000 of debt per borrower under a certain income threshold. This is a regressive and fiscally irresponsible demand likely to further estrange Democrats from working-class voters. Here are six reasons why he should develop a plan to resume payments in a timely manner that doesn’t include mass debt cancelation by executive order.

Read the full piece in The Hill.

Big transformative change is sometimes slow

Earlier this month, a new report showed that the United States reached the lowest uninsured rate ever recorded, according to the Department of Health and Human Services (HHS). This was the result of Democrat persistence of the last decade: the passage of the Affordable Care Act (ACA), the subsequent Medicaid expansions, the additional subsidies for ACA plans passed under Biden, and because throughout the pandemic, people have kept their Medicaid coverage.

In 2009, before the ACA was passed, roughly 50.7 million people, 16.7% of population, were uninsured. Today, despite narrow majorities and Republican opposition, the uninsured rate is half that. Since the passage of the ACA, 38 states and the District of Columbia expanded their Medicaid programs to cover people up to 138% of the federal poverty level. During the pandemic, in exchange for increased funds from the federal government, states were asked not to disenroll people from Medicaid. As a result, more people have received coverage and kept it over the past 2.5 years.

Medicaid expansion improves access to health care, financial security, and health outcomes. The states that have expanded the program have lower uninsured rates, better hospital budgets, and lower mortality rates compared to states who haven’t.

While more people were receiving Medicaid coverage, President Biden and Congress pushed to enhance the subsidies for ACA plans for people in the individual market. The expanded subsidies were recently extended through 2025 by the Inflation Reduction Act, and will save the average enrollee $800 per year. This led to approximately 2 million additional enrollees in ACA plans, increasing it to its highest ever enrollment of 14.5 million people.

But there is evidence that these policies will continue to grow. More states are considering Medicaid expansion: The Supreme Court made Medicaid expansion optional more than a decade ago and the question of expansion has seemed to be stuck in the mud in recent years. But, there is evidence that some of the last holdouts are beginning to warm to the idea as some rural hospitals have struggled to survive. Expanding Medicaid in the 12 non-expansion states would bring health care coverage to 3.7 million people and reduce the already low uninsured rate by a third. The remaining uninsured are largely low-income families, undocumented workers, and people who churn between coverage options.

Lasting change is hard, and in the U.S. our system is designed to make large, systemic change nearly impossible. But when lawmakers can coalesce around a policy, and build on it with time, big transformative change is possible. The ACA started by plugging holes in our current system: it created a marketplace for people who don’t have coverage through work, expanded Medicaid, and tweaked some Medicare programs. In the years since, lawmakers have built on the success of those policies, and today we are seeing the fruits of those efforts.

The work isn’t done: The system still costs far too much and doesn’t deliver high quality results for everyone. But the groundwork has been laid and it’s important to note how far we’ve come.