It was an unmarked, unprepossessing building on the outskirts of Zaporizhzhia, a dusty industrial city in the heart of Ukraine that is all but sure to see intensified fighting when Kyiv’s anticipated counteroffensive begins. The wounded soldiers were crammed into a warren of tiny rooms, but the trio of musicians, also fighting-age men in fatigues, found places to stand between beds and began playing—first a rousing song with dirty lyrics making fun of Russians, then a string of haunting ballads full of melancholy and longing.
The hospital was the first stop on a two-day trip I took earlier this month with Cultural Forces, a collective of Ukrainian entertainers now devoting themselves full-time to boosting morale on the front lines. A world away from the Hollywood stars who entertained mass rallies in World War II Europe and Vietnam, Cultural Forces sends a handful of soloists—on my trip, an acoustic guitarist, a violinist and a keyboard player, plus two amateur poets—to play in gritty, intimate settings like hospitals and mess halls.
On this episode of the Mosaic Moment, PPI’s State and Local Political Director Reid Fauble sits down with Sahar Fathi, Policy Director for the Washington State Attorney General’s office and Mosaic Project Alum to discuss her role in the Washington State AG’s office, why the legislative work and policy initiatives of state and local legislative chambers matter, and how state and local governments will serve as the new frontier of shared democratic values.
FACT: Corruption is a large factor in the global economy, but one with few verifiable statistics.
THE NUMBERS: U.S. “corruption perception” ranking, Transparency International –
2022 24th
2020 28th
2017 16th
WHAT THEY MEAN:
Corruption is notoriously difficult to track and measure: hidden from the public for obvious reasons, slippery to define, perhaps meaning one thing in government and other things in businesses, unions, media, nonprofits, etc. Those hoping to put numbers on it find it still harder to get anything very reliable. Even the White House’s June 2021 Memorandum on Establishing the Fight Against Corruption as a Core United States National Security Interest wound up passing on a long-debunked data point. (“It has been estimated that acts of corruption sap between 2% and 5% of global gross domestic product.” See below for a look at the origins of this statistic.) But though particular numbers and definitions may dissolve under examination, broad definitions, general observations, and case studies alike suggest that the White House’s view of corruption as a security threat is well-founded. Three useful approaches:
(1) Definitions – Corruption beyond bribery and crimes: William Riordan’s Plunkitt of Tammany Hall (1905), an admiring/appalled biography-in-interviews of an early 20th century NYC political boss, explains why actual bribery (and by extension other crimes) aren’t always the right things to look for. “With the grand opportunities all around for a man of political pull,” says Plunkitt, “there’s no excuse for stealin’ a cent.” He viewed taking a bribe as the high-risk, low-reward act of a fool, because the big money was in low-risk, high-reward insider deals. Plunkitt made himself rich through perfectly legal purchases of land he knew NYC would later designate for city parks, which he then sold to the city at much higher prices a few months later. As a more sinister and security-linked modern counterpart, look perhaps to the high-pay, low-work sinecures and Board consultancies Russia’s state energy and mining firms were giving out to retiring Western politicians during the 2010s.
(2) A general approach – Corruption shifts wealth and reduces long-term growth: The IMF’s Paolo Mauro (2021) looks at ways in which corruption can shift taxation and spending, and (over time) eat away at long-term growth and development. He reports that governments in low-corruption countries collect about 4% of GDP more in tax revenue than governments in high-corruption countries, and that in practical terms this suggests that if high-corruption governments reduced corruption rates to those of their low-corruption counterparts, they would gain perhaps $1.25 trillion in revenue. This wouldn’t be “lost,” or “sapped” from global GDP, but would presumably move away from mansion-building and tax-haven accounts to public investment. Moreover, Mauro observes, lower-corruption governments use revenue differently (spending somewhat less of their money on defense and public works and somewhat more on education and public health), and get more growth for the money:
“Grand corruption is usually associated with complex and costly projects such as construction and defense equipment. By comparison, it is harder to collect bribes on teachers’ and health care workers’ wages. As a result, spending on education and health is likely to be lower where corruption is high, making it less likely that worker productivity and living standards will improve.”
(3) A case study – Corruption and the erosion of state legitimacy: In Thieves of State (2015), Sarah Chayes draws on ground-level experience to explain how province- and federal-level corruption hollowed out attempts to build a representative government in Afghanistan, prefiguring the fall of the state:
“Officeholders who had to recoup the money they’d spent buying their jobs would request assignments in zones where cash flowed. Senior officials, anticipating the sums to be collected, would not try too hard to fill billets in impoverished rural districts. … An absence of integrity in the system meant that this late in the game [2009] constructive men and women had been stripped out – and by now might want to stay clear. ‘No one would dirty his hands getting near this government,’ a Kandahar-area farmer exclaimed to me once.’”
In conclusion: The White House might have been a bit quick to pass on an interesting data point. But it’s probably right to view corruption as a national security threat, and to think about ways to do better.
FURTHER READING:
Policy:
The White House’s June 2021 Memorandum designating corruption as a national security threat.
… and from this past March, Treasury Secretary Yellen updates.
Analyses and examples: IMF analyst Paolo Mauro estimates that governments lose about $1 trillion in tax revenue to corruption.
Sarah Chayes’s prescient Thieves of State: Why Corruption Threatens Global Securityanalyzes the fall of democratic Afghanistan six years before it actually happened.
Where did the White House figure come from? To refresh, the June 2021 Memorandum asserted that: “it has been estimated that acts of corruption sap between 2 and 5 percent of global gross domestic product.” Others — the U.N. Secretary General, academic analysts, etc. — had used variants of this before, often adding a figure of “$2.6 trillion” to the percentage. A January 2021 note by the World Bank’s Anti-Corruption Resource Center tracked this back through a quarter-century of quotations and extrapolations, to a 1998 speech on money laundering (a different though related topic) by then-International Monetary Fund Managing Director Michel Camdessus. Camdessus had cautiously suggested that the ratio of annual laundering flows to global GDP might be 2% to 5%. A separate organization appears to have inappropriately converted this in 2008 from a “flow” to a “net cost to global GDP” and derived the $2.6 trillion in losses from it. (World GDP in 2007 was $58 trillion.) The WB group’s plea: “No organisation or advocate should cite this statistic under any circumstances.”
The WB fact-checks 10 frequently cited corruption stats, and finds not even one of them usable.
… a similar error from the UN Secretary-General (2018).
… and a depressing coda, in which the WB press office encourages lazy tweeters to forward a short sentence that seems more likely to aggravate the problem than to warn over-eager analysts away. (“A popular estimate is that more than $2.6 trillion, or 5% of global GDP, is lost to corruption annually around the world.”) Another approach:
What then might be a useful measurement? One very well-known approach is that of Transparency International, a 30-year-old NGO which else publishes an annual Corruption Perceptions Index. This is a kind of global opinion poll asking how corrupt the respondents think various governments and institutions might be. Their most recent edition, released in January 2023 and covering perceptions as of late 2022, ranks 180 countries. It places Denmark, Finland, and New Zealand at the very top; North Korea, South Sudan, and Somalia at the bottom; and India exactly in the middle. The U.S. is in 24th place. This is an improvement from the 28th-place ranking of 2020, enough to America’s anti-corruption image above those of Taiwan, Bhutan, Chile, and the United Arab Emirates, but still well below the 16th-place ranking in the 2017 Index (and only sixth among the G-7 countries). TI’s summary suggests that the U.S.’ not-entirely-savory reputation reflects perceptions less of corruption in state/federal bureaucracies or of private-sector businesses than of a deteriorating political system:
“The [U.S.’] lack of progress on the CPI [Corruption Perceptions Index] can be explained by the persistent attacks on free and fair elections, culminating in a violent assault on the U.S. Capitol, and an increasingly opaque campaign finance system.”
Ed Gresser is Vice President and Director for Trade and Global Markets at PPI.
Ed returns to PPI after working for the think tank from 2001-2011. He most recently served as the Assistant U.S. Trade Representative for Trade Policy and Economics at the Office of the United States Trade Representative (USTR). In this position, he led USTR’s economic research unit from 2015-2021, and chaired the 21-agency Trade Policy Staff Committee.
Ed began his career on Capitol Hill before serving USTR as Policy Advisor to USTR Charlene Barshefsky from 1998 to 2001. He then led PPI’s Trade and Global Markets Project from 2001 to 2011. After PPI, he co-founded and directed the independent think tank Progressive Economy until rejoining USTR in 2015. In 2013, the Washington International Trade Association presented him with its Lighthouse Award, awarded annually to an individual or group for significant contributions to trade policy.
Ed is the author of Freedom from Want: American Liberalism and the Global Economy (2007). He has published in a variety of journals and newspapers, and his research has been cited by leading academics and international organizations including the WTO, World Bank, and International Monetary Fund. He is a graduate of Stanford University and holds a Master’s Degree in International Affairs from Columbia Universities and a certificate from the Averell Harriman Institute for Advanced Study of the Soviet Union.
A new AP poll found that only 31% of Americans approve of President Joe Biden’s handling of the economy, a result both shocking and familiar. Shocking because no modern president has received such poor marks during a period of very low unemployment and a growing economy. But it is also familiar because it shows Democrats have a chronic political problem regarding the economy: Many voters don’t trust them on economic issues even though Democratic presidents have demonstrably better records of producing job growth, income improvements and avoiding recessions.
As research has found, of 17 recessions over the last century, 13 began under Republican presidents, including all of the biggest: the Great Depression and the major recessions of 1981, 2007 and 2020. The last Democratic recession occurred more than four decades ago.
Why don’t voters believe it? One problem is that the far-left of the Democratic Party reflexively indulges in anti-business rhetoric, and often in policies, led today by the Sen. Bernie Sanders (I-Vt.) wing of the party. If you spend time bashing the very companies that produce most jobs, growth and wealth, it should come as no surprise that most Americans don’t trust you to help the private sector be more productive. So, while issues like income inequality are important to address, as recent Biden legislation helped do, condemning the private sector as a political strategy often ends up backfiring.
Elan Sykes, Energy Policy Analyst at the Progressive Policy Institute (PPI), released the following response in reaction to the New Democrat Coalition’s bipartisan permitting reform proposal.
“Combatting the climate crisis requires the ability to swiftly build and deploy massive new infrastructure and technology, without a thicket of federal and state regulations that slow the transition and in many cases even penalize cleaner technologies relative to fossil fuels. The Progressive Policy Institute has long advocated for updates to the existing regulatory framework to better reflect the impact and benefits of clean energy technologies for the climate and the U.S. economy.
“PPI supports the New Democrat Coalition’s proposal, which builds on successful, existing reforms while highlighting the need for ambitious modernization of the National Environmental Policy Act (NEPA) and specific new reforms for electricity transmission to place it on par with rules for natural gas. In September, PPI released policy recommendations for permitting reform legislation and is pleased to see those recommendations included in the New Democrat Coaliton’s plan.
“Securing permitting reforms will not only help address climate change with the proper urgency, but it will also lower household energy costs for American families in a time of concerning inflation. Congress must take effective, bipartisan action to break through this outdated, bureaucratic red tape and let America build.”
The Progressive Policy Institute (PPI) is a catalyst for policy innovation and political reform based in Washington, D.C. Its mission is to create radically pragmatic ideas for moving America beyond ideological and partisan deadlock. Learn more about PPI by visiting progressivepolicy.org.
Last week, the Los Angeles Department of Transportation held a press conference and ribbon-cutting ceremony to launch its latest facility: a bus shade and lamp roughly the size of a streetside parking sign called “La Sombrita.” Pictures displaying the device showed an internet eager for Sombrita content and its limited ambitions (see the viral chatter on Twitter and TikTok), as it provides little or no shade at certain times of day and the lamp is pointed so it doesn’t even illuminate its surroundings:
The Los Angeles Department of Transportation (LADOT) and Kounkuey Design Initiative (KDI), the nonprofit behind La Sombrita’s design, explicitly acknowledge that the structure was specifically designed for situations where permitting delays, agency conflicts, or narrow sidewalks prevent the installation of street trees or traditional bus shelters with a roof and seating. Indeed, highlighting these constraints may have been the most valuable contribution that La Sombrita makes to the Los Angeles bus system, because these limitations are self-imposed, or at the very least, stem from a narrow political vision that must be widened for cities to govern effectively through coming challenges.
Despite the humorous tone of the discussion — and La Sombrita certainly deserves the jokes at its expense — the issues of shade, nighttime lighting, and general infrastructure needs for pedestrians and bus users are all quite serious business. Bus riders — often low-income workers using current American bus systems as a mode of last resort — are forced to wait for infrequent service under the scorching sun with nowhere to sit, and without coverage from street trees like those common in richer neighborhoods. The structure’s lamp was included to meet an identified need for better lighting to help provide security for women against the risk of gendered violence. Narrow sidewalks and poor maintenance hurt all users, but they make any further obstruction especially difficult for people with mobility disabilities to pass by. And for the public and planet at large, infrastructure that improves low-emissions transportation methods like buses and walking will be increasingly important to us all as climate change continues to raise temperatures and reduce cloud cover in a brutal feedback cycle.
Adopting programs like these in the U.S. will never succeed if every program is launched as an expensive pilot project forced to jump through the hoops of countless agencies’ rules and forced through tortuous process requirements. U.S. cities aiming for ambitious progress on climate, mobility, and equity should be applauded for the results they achieve rather than the ideals they profess in service of overpriced half-measures. A comprehensive and forward-looking mode of urban governance does not require spending lavish sums on vanity projects but should instead focus on:
Enabling real infrastructure deployment by streamlining the permitting process, consolidating and coordinating across separate agencies, and empowering agencies to buy and implement off-the-shelf components faster and cheaper.
Ending land-use restrictions on urban density including zoning, setbacks, and parking requirements that limit shade from buildings and disperse destinations to inhibit walking and bus transport.
Treating pedestrian and bus infrastructure investment on par with other transport modes.
Encouraging wider adoption of solar shading and cooling facilities in hot and warming cities.
If America’s cities get out of their own way with unnecessary requirements and limitations to embrace a vision of livable and vibrant cities, the next $200,000 spent on urban infrastructure will go much further than La Sombrita.
Malena Dailey, Technology Policy Analyst at the Progressive Policy Institute (PPI), released the following response in reaction to the U.S. Supreme Court’s rulings in Gonzalez v. Google and Twitter, Inc. v. Taamneh, leaving intact Section 230 of the Communications Decency Act, the legal framework through which websites are able to host third-party content.
“PPI has consistently argued any changes to the landmark Section 230 statute must consider the potential risks to American innovation and the digital ecosystem, including in an amicus brief filed in the case of Gonzalez v. Google.
“Since Section 230’s inception, the internet has been a platform for entrepreneurship, advocacy, and community, empowered by the ability for individuals to lift up their voices online. The preservation of Section 230 is a win for American innovation and the growing digital economy — all of which have spurred American job growth in the last several decades.
“There is a clear need for moderation of content users post on online platforms. While there may be room to update content liability to reflect the harms of the modern internet, any changes must keep in mind the integral role Section 230 plays in the development of an ever-growing digital ecosystem.”
The Progressive Policy Institute (PPI) is a catalyst for policy innovation and political reform based in Washington, D.C. Its mission is to create radically pragmatic ideas for moving America beyond ideological and partisan deadlock. Learn more about PPI by visiting progressivepolicy.org.
In part 2 of this two part series, PPI’s Reinventing America’s Schools (RAS) Project Co-Director Curtis Valentine, in collaboration with EdChoice, sits down for a live panel conversation and podcast recording at the ASU+GSV Summit in San Diego with Sharif El-Mekki, Chief Executive Officer of the Center for Black Educator Development and Mikyeil El-Mekki, and Matthew Mugo Fields, Executive Leadership of Houghton Mifflin Harcourt.
Learn more about the Reinventing America’s Schools Project here.
Learn more about the Progressive Policy Institute here.
Earlier this week, former Chicago Teachers Union (CTU) negotiator Brandon Johnson became Chicago’s 48th mayor. “Progressives” are celebrating, but when it comes to prioritizing high quality public schools, the new mayor couldn’t be more regressive.
This should be a national wakeup call for moderates. During the pandemic, many Democrats ignored parents’ demands. That abetted the party’s surrender of the historic trust we long enjoyed on education policy. Now, the elevation of a CTU leader to the most important office in the biggest city in the Midwest — where the Democratic National Committee (DNC) will hold its convention next summer — makes reclaiming our mantle as the “education party” harder.
THE NUMBERS: Export share of state “GDP,” 2022, goods only –
Louisiana
43.4%
Texas
20.6%
Oregon
11.4%
Alabama
9.2%
Indiana
9.9%
Washington
8.4%
Wisconsin
6.8%
Pennsylvania
5.4%
Massachusetts
4.8%
New Mexico
3.9%
D.C.
1.0%
Hawaii
0.7%
* Goods only (manufactures, agriculture, energy, mining, returns, waste & scrap, low-value shipments); no data exists for state services exports.
WHAT THEY MEAN:
A note from Virginia electric co-op newsletter “Cooperative Living” last week tallies farms and trade: 41,500 Virginia farms export $4 billion a year to 152 countries, topped by China at $1.36 billion, then Canada, Taiwan, Mexico, and Japan at $362 million, $161 million, $140 million, and $129 million.
Their piece draws on work at the Census, Department of Agriculture, and the Bureau of Economic Analysis, whose stat experts over the past decade become steadily more ambitious and precise in tracking exports down to states, cities, and “metro areas.” Their data — try in particular the Commerce Department’s “TradeStats Express” — show that (a) Virginia overall is very close to the “typical” state, placing exactly 24th in 2022 with $25 billion in total exports; (b) is one of 34 states for whom Canada is the top overseas (if that’s the right term) customer, and one of 13 whose top ag market is China; and (c) together with the agriculture exports comes in at $5.8 billion in energy, $2.2 billion in computers and electronics, and $1.4 billion worth of paper (fifth-ranked in the country); $631 million in waste and scrap metal for recycling, $188 million in pesticides and “other agri-chemicals,” and so on.
To produce such figures is challenging. Manufactured goods, for example, are usually composite assemblies of parts made in lots of places rather than monoliths built from scratch at a single site. (If a car has an engine made in Ohio, a windshield made of Kentucky glass, a chassis from Indiana metals, computers using semiconductor chips in Arizona, all coming together at a Michigan factory, the logical and preferred — but still not totally satisfying — answer is that it’s “from” Michigan.) Agricultural exports are even more hotly disputed: One Department calculates totals based on the location of the port or railhead where river barges and containers full of (say) soybeans come together to load for shipment abroad, and counts processed foods as manufactured goods, while another uses average production value by state and counts processed foods as agricultural products. And nobody has figured out a way to calculate state services exports. But these points noted, the government’s upgraded state data make one thing very clear, make a lot of things pretty clear, and provide many interesting points to say about state specialties, regional economies, and their links abroad:
Very clear: As of 2022, Gov. John Bel Edwards’ Louisiana is the king of state exporters. Louisiana’s $122 billion in exports last year — more than double the $56 billion in 2017 — gives the state a 43% export-share-of-GDP ratio when matched against its $281 billion GDP. This is twice the 20.6% ratio of second-place Texas. The boom mainly reflects the roaring growth of U.S. energy exports centered around Louisiana’s three specially designed liquefied natural gas export terminals. (Since 2021, the U.S. has been the world’s top energy exporter, with gas and oil, and the smaller coal/electricity/biofuels sectors, accounting for 18.4% of U.S. exports last year, an all-time record far above the 13.2% peak achieved in the 1920s.)
A look at the top five state export-to-GDP ratios illustrates:
Pretty clear: The remaining 46 states and D.C. fall in a range from sixth-place Oregon’s 11.4% through the 5% to 7% common in the Northeast, to the lowest export-to-GDP ratios (D.C.’s 1.0% and Hawaii’s 0.7%). Finding patterns is tricky given that some of the data remain blurry, especially for small, agriculture-reliant inland states. But overall, Southern and Midwestern states appear on average somewhat more export-reliant than East Coast and West Coast states. Measured in total dollars, Texas (benefiting, like Louisiana, from a gas and oil surge) is easily the top exporter at $486 billion, with California a distant second at $186 billion. (Though, given the absence of services data, this doesn’t include anything Californians may possibly be earning from overseas sales of software, movies showings, music downloads, etc.). Louisiana’s $122 billion is third, followed by New York’s $106 billion and Illinois’ $78 billion. The next five are Florida, Washington, Michigan, Ohio, and Pennsylvania.
Lots of Information: TradeStats Express lets you arrange the data in an unusual variety of ways: by overseas markets, by single products, in-depth panoramas for particular states, comparisons among neighboring states, etc. For example, Texas is by far the top state exporter to sub-Saharan Africa at $5.1 billion of a nationwide $18 billion; Pennsylvania, meanwhile, is the U.S.’ top exporter of sugars and confectionery, while Florida leads in ships and boats, and California in mushrooms. As to farmed fish, Maine exports over two-thirds of the U.S. total. Or, as noted earlier, Canada is the top market for 34 states, while among the rest, Mexico is the top market for six states (Arizona, California, Kansas, Nebraska, New Mexico, Texas); China for four (Alaska, Washington, Oregon, and Massachusetts); Germany for two (Alabama and Connecticut); the U.K. for one state (Utah) and the District of Columbia; and one each for Brazil, (Florida), Singapore (Hawaii), Switzerland (New York**) and the Netherlands (Puerto Rico). Or, a few single-state studies:
1. Arizona: On the bottom-left corner of the map, Arizona’s $27 billion in exports rank 20th in total dollars, in a three-way tie with Virginia and Minnesota. Mexico is Arizona’s main customer, buying $8.7 billion or about a third of the $27 billion total. Canada is second, followed by China and the Netherlands. Top products are aerospace ($4.6 billion), semiconductors and electronics ($4.4 billion), and old-standard metal ores ($2.2 billion).
2. Illinois: The U.S.’ fifth-largest exporter at $78 billion in 2022, Illinois relies especially heavily on Canadian and Mexican customers ($23.8 billion and $11.7 billion respectively). Australia is the third-largest at $4.6 billion, buying mainly farm equipment and medicines, followed by Germany and China. Illinois beats California and Texas as top exporter to Australia, and ranks 4th for New Zealand.
3. Kentucky: Gov. Andy Beshear’s justifiably enthusiastic press release notes heavy international investment in Kentucky business: “Kentucky’s international presence includes more than 500 facilities that employ almost 115,000 people and represent 33 different countries.” His trade experts, obviously adept followers of the Census and BEA stats, report exports of $34.4 billion led by “aerospace products and parts, pharmaceuticals and medicines, motor vehicles”, etc., with Canada, Mexico, the U.K., China, and France as the Kentucky’s top five buyers.
4. Oregon: The most “export-intensive” state in the West in 2022, with exports accounting for 11.4% of Oregonian GDP. China is easily the top market, buying $8.3 billion of Oregon’s $34 billion in total exports, mostly semiconductors and related high-tech electronics. Next come Mexico, Canada, Malaysia, and Ireland.
5. Puerto Rico: The Commonwealth’s $20.7 billion in exports are very concentrated in pharmaceuticals, which make up $16.3 billion or nearly 80% of the total. Most go to Europe: $3.5 billion to Spain, $3.4 billion to the Netherlands, and $1.3 billion to Italy, with Japan and China next, followed by Belgium, Germany, and Austria. The only Caribbean neighbor in Puerto Rico’s top 20 markets is the Dominican Republic, in 11th place at $465 million.
6. Vermont: And in the map’s top right corner, with $2.5 billion in 2022 exports, Vermont ties New Hampshire as the most export-reliant Northeastern state. (6.2% of Vermont’s $40.6 billion GDP.) Semiconductors and other electronics account for about half of the total, with Canada the top market at $777 million, Taiwan second at $465 million, and China third at $211 million. Note the $54 million in sugars and confectioneries — presumably the iconic “sweetest thing,” maple syrup and maple sugar — all destined for Canada.
* Using 2021 exports and ‘GDP’ for Puerto Rico, as the 2022 figures aren’t yet available.
** A 2022 anomaly, probably reflecting a one-year surge in gold exports; typically Canada is New York’s top market.
FURTHER READING:
From the states:
Cooperative Living (pg. 35) has a snapshot of Virginia farm exports.
???? King of exports: Louisiana Gov. John Bel Edwards pitches natural gas exports and investment opportunities in Asia last March.
And for international context and comparisons, the WTO’s World Trade Statistical Review 2022 (2021 data; next annual edition likely in November).
ABOUT ED
Ed Gresser is Vice President and Director for Trade and Global Markets at PPI.
Ed returns to PPI after working for the think tank from 2001-2011. He most recently served as the Assistant U.S. Trade Representative for Trade Policy and Economics at the Office of the United States Trade Representative (USTR). In this position, he led USTR’s economic research unit from 2015-2021, and chaired the 21-agency Trade Policy Staff Committee.
Ed began his career on Capitol Hill before serving USTR as Policy Advisor to USTR Charlene Barshefsky from 1998 to 2001. He then led PPI’s Trade and Global Markets Project from 2001 to 2011. After PPI, he co-founded and directed the independent think tank Progressive Economy until rejoining USTR in 2015. In 2013, the Washington International Trade Association presented him with its Lighthouse Award, awarded annually to an individual or group for significant contributions to trade policy.
Ed is the author of Freedom from Want: American Liberalism and the Global Economy (2007). He has published in a variety of journals and newspapers, and his research has been cited by leading academics and international organizations including the WTO, World Bank, and International Monetary Fund. He is a graduate of Stanford University and holds a Master’s Degree in International Affairs from Columbia Universities and a certificate from the Averell Harriman Institute for Advanced Study of the Soviet Union.
Taylor Maag, Director of the New Skills for a New Economy Project at the Progressive Policy Institute (PPI), released the following response in reaction to President Biden’s announcement of new efforts to ensure all Americans can access the jobs created by the President’s Investing in America agenda, including the American Rescue Plan, the Bipartisan Infrastructure Law, the CHIPS and Science Act and the Inflation Reduction Act:
“The Biden Administration has created a record number of jobs through these policies, yet our country continues to struggle to find the workforce to fill them. The White House’s announcement today showcases how the Administration plans to solve this challenge while also ensuring these job opportunities are available to all working Americans, not just those with a four-year degree.
“The Progressive Policy Institute’s New Skills for a New Economy Project applauds the Biden Administration’s announcement for acknowledging that to build a competitive workforce we need to ensure every American — whether they go to college or not — has equitable access to high-quality training, education, and services that provide a path to a good career.
“Initiatives announced today, such as Workforce Hubs and the Advanced Manufacturing Workforce Sprint, do just that. These programs are regionally driven — relying on partners in the community to drive programming and industry-led, ensuring employers are a key partner in informing and developing workforce strategies. This type of action is critical to equip American workers with the skills they need to get ahead in a new economy, to close the diploma divide, and to ensure our nation remains competitive.”
The New Skills for a New Economy Project at the Progressive Policy Institute helps shape policy discussions at the federal and state levels around investments in a robust workforce development system that is fully-funded, modern, industry-responsive, and equips current and future workers with the skills they need to get ahead. The project promotes policy solutions that address the current challenges facing workers’ success and helps the U.S. remain competitive by lifting up new ideas and best practices happening across the country.
The Progressive Policy Institute (PPI) is a catalyst for policy innovation and political reform based in Washington, D.C. Its mission is to create radically pragmatic ideas for moving America beyond ideological and partisan deadlock. Learn more about PPI by visiting progressivepolicy.org.
Those of us who desperately want to see the back of this dismal Conservative government should take heart from the recent local elections in England.We should also be encouraged by the successes of the centre left around the world, which has defeated the political right in elections in Australia, Germany, Spain, Portugal and the US, after a dramatic decline in support for social democratic parties after the 2008 financial crisis.
But if we can learn one thing from these recent successes, it is that there is nothing inevitable about the return of social democracy. Granted, after the pandemic, many voters have grown weary of the failure of the political right to address their need for security and prosperity as they face the cost of living crisis. But voters everywhere remain sceptical of the ability of politics and politicians, from all parties, to act in their interests. They are sceptical too of the capacity for government to change their lives for the better, at a time when we badly need to renew the modern state in the face of the perma-crises hitting all our nations.
The metaphor that the pendulum inevitably swings back from right to left and back again ignores the simple fact that of the 123 years of the Labour party’s existence, it has only been in power for just over 30 of them. If there is a pendulum, it gets stubbornly stuck on one side. The UK Labour party needs to take learning, not comfort, from the tentative revival of the centre left.
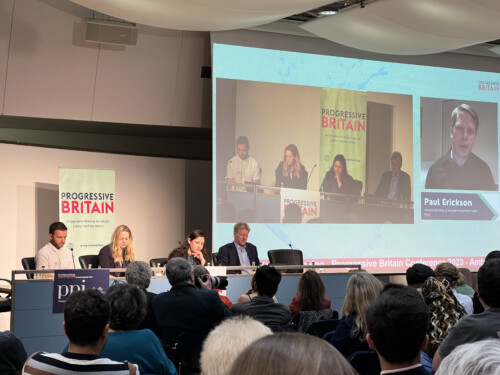
The Progressive Policy Institute (PPI) partnered with Progressive Britain to host their 2023 conference, Ambition for Britain, featuring Labour Party Leader Keir Starmer MP and leading center-left politicians and thinkers. As part of an ongoing dialogue between the U.S. and U.K., Will Marshall, President of the Progressive Policy Institute (PPI), and Claire Ainsley, Director of PPI’sProject on Center-Left Renewal, led a panel discussion providing a global perspective on the need for a strong center-left alternative to right-wing populism and nationalism.
“Now more than ever, the United States, United Kingdom, and other countries need strong center-left parties to turn back the tide of rising reactionary nativism and nationalism,” said Will Marshall, President of PPI. “The UK Labour party is working to expand their voting base to build bigger governing majorities. Ahead of the next U.S. election in 2024, the Democratic party must take a similar approach to win back working-class voters.”
“Across the world, center-left parties are seeing a revival in voter support as the political right fails to answer the everyday challenges of today and tomorrow,” said Claire Ainsley, Director of the Project on Center-Left Renewal and former Executive Director of Policy to Labour leader Keir Starmer. “The UK Labour Party can take inspiration and learn from their success, as well as heed the warnings that right-wing populism has not gone away. Center-left parties across the world can work together and learn from each other to continue winning and creating lasting coalitions.”
Labour Party Leader Keir Starmer highlighted recent local elections where the Labour party had its strongest result in more than a decade, winning in all parts of the country and winning back many Brexit voters.
The Project on Center-Left Renewal is focused on working with center-left parties in Europe and around the world to exchange ideas and compare notes to build winning coalitions that last. Last month, members of the project traveled to Australia to meet with members of the Australian Labor party, who won the recent 2022 federal elections. Their recent victory in the New South Wales state elections means they are in government in every state except Tasmania.
The Progressive Policy Institute (PPI) is a catalyst for policy innovation and political reform based in Washington, D.C. Its mission is to create radically pragmatic ideas for moving America beyond ideological and partisan deadlock. Learn more about PPI by visiting progressivepolicy.org.
Kudos for recognizing that the Federal Energy Regulatory Commission is the agency best equipped to consider and approve proposals to build long-distance interstate electric transmission needed to deliver affordable but remote renewable energy to where it is needed. Otherwise, America will not be able to decarbonize our grid or our economy.
Republicans seem to be racing backward in time, resurrecting old tenets that defined their party’s outlook in the 1920s and 1930s: Christian fundamentalism, nativism, protectionism and isolationism.
Long discredited by events, these reactionary shibboleths are risen from the dead and lurching like zombies across the U.S. political landscape. We hear their echo in today’s red state crusade to stamp out women’s reproductive rights, the hysteria over immigrant hordes “replacing” whites and the Trump administration’s high tariff policies, which remain on the books despite having failed to reduce U.S. trade deficits.
The former president also dredged up the hoary isolationist slogan, “America First” to signal his rejection of key pillars of America’s post-war internationalist strategy — open trade, security alliances and the formation of world bodies dedicated to collective problem-solving.
We may be on the verge of a titanic shift in how drug prices are set. It’s been led by a dramatic decline in insulin prices, but it’s spreading to other brand drugs as well. This new paradigm is the unintended but welcome result of legislative, regulatory, and market pressures exerted on the biopharmaceutical industry.
The big change: the three major insulin manufacturers decided to sell their medicines at a set low out-of-pocket price for all patients. The previous list prices offered for insulin were bloated by all manners of rebates, discounts, and fees necessary for the byzantine rebate contracting model promoted by the pharmacy benefit managers (PBM) and state Medicaid programs. The new list prices are stripped of all the extraneous baggage and now closely reflect the actual net payments received by manufacturers. In other words, with a straightforward move, pharmaceutical companies Lilly, Sanofi, and Novo Nordisk cut out the middlemen, the PBMs, and others who benefit handsomely by keeping some or all of the rebates, discounts, and fees provided by those companies.
But that’s not all: another brand manufacturer has started selling its brand-name diabetes medicine directly to patients at a significant discount through an innovative retail pharmacy outfit. The reduced price is 50% of the drug’s average retail price. This move helps patients saddled with substantial deductibles and co-insurance since those out-of-pocket costs are calculated based on the inflated retail prices when they utilize their insurance benefit — not the significantly lower prices negotiated by the PBMs that never reach the pocketbook of patients who are consuming those medicines. Furthermore, patients can continue to benefit from patient assistance programs offered by biopharmaceutical manufacturers.