Chile: The Road to the App Economy

Apple’s introduction of the iPhone in 2007 initiated a profound and transformative new economic innovation. While central bankers and national leaders struggled with a deep financial crisis and stagnation, the fervent demand for iPhones – and the wave of smartphones that followed – was a rare force for growth.

Today, there are five billion mobile broadband subscriptions, an unprecedented rate of adoption for a new technology.1 Use of mobile data is rising at 65 percent per year, a stunning number that shows its revolutionary impact.2

More than just hardware, the smartphone also inaugurated a new era for software developers around the world. Apple’s opening of the App Store in 2008, followed by Android Market (now Google Play) and other app stores, created a way for iOS and Android developers to write mobile applications that could run on smartphones anywhere.

En Español: PPI_ChileAppEconomy_TRANSLATED-1

Understanding the New “Median Employee Pay” Statistics

Summary: The new “median employee pay” statistics tell us very little about pay. However, they do illuminate the future of economic statistics.

The median center of the United States population, as calculated by the Census Bureau, is Pike County, Indiana, in the rural southwest corner of the state. A visit with a resident of Pike County, with a density of 38 people per square mile, might tell you something important about the rural Midwest, but it wouldn’t give you any insight into Silicon Valley or New York City.

That, in a nutshell, is the problem with the new “median employee pay” figures that companies are now required to publish. These figures provide us with some useful pieces of information that were hidden before. It’s interesting to know that the median employee at GE, for example, earns $57,211 per year, while Ford’s median employee receives $87,783.

But we’re learning that “median employee pay” for a company has a lot more to do with geographic scope and the nature of the corporate business model than with the actual level of pay in the company. For example, median employee pay at megabank Citigroup is $48,249, while median employee pay at Bank of America is $87,115. Does that mean that comparable workers get paid twice as much at Bank of America? No, it merely reflects that two-thirds of Citigroup employees are outside the United States, many in lower-wage countries. By contrast, Bank of America’s business is mostly focused in the US.

Another odd set of numbers comes out of the utility industry. Median employee pay at The Southern Company, a gas and electric utility employing 31,000 workers in 34 states, was reported at an eye-popping $138,000. Meanwhile, the AES Corporation, with three-quarters of its operations outside the US, reported median employee pay of $49,229. These two numbers tell us nothing, however, about pay for comparable workers.

A different set of issues arises in retailing. The need to staff weekend and evening hours means that many retailers employ a large number of part-time workers to cover off-hours. Similarly, the annual surge in holiday shopping requires hiring an enormous number of seasonal workers. Moreover, there’s a large amount of turnover in the retail industry, which means that many workers hired for a permanent position may not have been working for that employer for a full year at the time when the count is made.

As a result, the reported median employee pay for most retailers is not directly comparable to other sectors of the economy. For example, Macy’s reports median employee pay of $13810, as of October 29, 2017. That number reflects the reality that 54% of its workers are part-time or seasonal. Similarly, Walmart is reporting median pay of $19177, and Loew’s is at $23905. Amazon reported a median employee pay of $28446, and Nordstrom’s median pay is at $30105.

Meanwhile, Connecticut-based tech manufacturer Amphenol, a major global designer and manufacturer of electronic products such as fiber optic connectors, reported median pay of only $12179. But as the company points out in its proxy, that’s because the majority of its employees are in low-wage countries. However, its US employees have a median pay of $54532.

Indeed, in the bigger picture, the data on employee median pay is telling us something important about the ongoing changes in economic statistics. Today, economic and labor statistics mainly come from government statistical agencies. These agencies mainly do expensive surveys which cover the whole country. These surveys are carefully curated and standardized, and systematically designed to be comparable over time and across the economy. The national unemployment rate and inflation rate come from surveys such as these, which were originally designed in the middle of the 20th century.

However, these surveys are increasingly expensive and often lag changes in the economy. Moreover, it’s getting hard to justify sending out teams of interviewers when companies have so much business data on their servers already.

As a result, going forward, economic statistics will be based much more heavily on “organic” data, generated in the normal process of doing business. That’s good news and bad news. The good news is that information technology allows companies to generate new types of economic data that weren’t possible before. Median employee pay, for example, would have been prohibitively expensive to require as recently as ten years go. Most companies just didn’t have the global pay databases that would allow them to do these kind of calculations.

The bad news is that these new types of data—such as median employee pay—may not be comparable across companies, either because they use different calculation methodologies or because different companies have objectively different business models. The median employee in a global company with large operations around the world is very different than the median employee of a company whose operations are based solely in one region of the United States.

The danger is that journalists and politicians treat these new types of organic data as if they were the old type of government-curated statistics. They are not. Comparisons of median employee pay across companies tell us more about how the companies are organized and about their industry than they do about the level of pay.

To put it a different way: If you had a magic wand and could ask corporations to produce one new statistic about their operations, you likely would not have asked for “median employee pay.”

Are Democrats Really the Party of Fiscal Responsibility? (Part 2)

Earlier this week, we published a blog exploring the relationship between budget deficits and unemployment under both Democratic and Republican presidents over the last 40 years. Our analysis found that deficits under Democratic presidents rose and fell with unemployment (which is what should happen when adhering to responsible counter-cyclical fiscal policy), while deficits under Republican presidents did not. Moreover, we found that deficits under Democratic presidents were consistently lower than those under Republican presidents facing comparable economic circumstances. Below is a chart depicting the data upon which our analysis was based:

Following the blog’s publication, a lively discussion ensued on Twitter over how much credit a president deserves for the fiscal situation on their watch. Marc Goldwein of the Committee for a Responsible Federal Budget and Brian Riedl of the Manhattan Institute rightly pointed out that Congress plays a major role in crafting federal fiscal policy and should be taken into consideration when adjudicating fiscal records by party.

As a result, we decided to make a second chart that focused on partisan control of Congress instead of the White House. The underlying data is the same as the chart above, with the exception of projections for 2019 and 2020, which were removed because nobody knows what the composition of Congress will look like after this year’s midterm elections. (We considered doing a third chart that combines the partisan composition of both the presidency and Congress, but there weren’t enough data points for every possible permutation to draw any reasonable conclusions.)

The chart above shows that, under comparable economic circumstances, deficits under divided Congresses have generally been slightly lower than deficits under unified Congresses. The chart also shows that deficits under unified Congresses have been roughly identical in level regardless of which party is in control. But there is one key way in which the partisan control of a unified Congress matters: when at least one chamber of Congress was controlled by Democrats, budget deficits have historically had a modest correlation with unemployment. When Republicans were in full control of Congress, however, deficits have had little to no relationship with the unemployment rate.

This finding appears to reinforce our conclusion from the previous blog: under Democratic governance, budget deficits have been consistent with responsible counter-cyclical fiscal policy. Under Republican governance, they have not.

There are many possible rationales for why Democrats appear to have a better budgetary track record than Republicans. Goldwein hypothesized that “Republican Congresses make Democratic presidents their best (fiscal selves) while they enable Republican presidents to be their worst fiscal selves.” David Leonhardt of the New York Times, whose column last the weekend inspired PPI’s first analysis, suggested that although this phenomenon may have some effect, there have also been instances (specifically in the early years of the Clinton administration) in which Democrats pursued responsible fiscal policy of their own volition that cannot be explained by this “external pressure” theory.

Regardless of the reason, there is relatively strong evidence that the federal budget over the past 40 years has been more responsibly managed under Democrats than Republicans – at least in the short term. Riedl noted that our analysis ignores the impact of policy changes implemented under a president (or Congress) that are inexpensive in the short term while costing more in later years. A cursory review of the record suggests to us that Democrats would likely still come out ahead under this metric over the past 40 years, but for now it remains a very real blind spot we hope to address at some point in the future when we have more time to compile and analyze the data.

Another good point Riedl made is that the biggest contributor to long-term budget deficits is the rising cost of social insurance programs that were created by Democratic administrations more than 40 years ago. These programs, the largest of which are Social Security and Medicare, are growing roughly twice as fast as the economy as more and more baby boomers move into retirement and begin collecting benefits. Other categories of federal spending, meanwhile, are projected to shrink relative to the size of the economy.

Although Democrats have generally been the more fiscally responsible party since the Carter administration, they still need to present voters with a credible plan for making their social insurance legacy from earlier years more fiscally sustainable. Doing so would cement their recent superiority on the issue of responsible fiscal stewardship and save young voters – a key component of the Democratic Party’s base – from being buried under a mountain of debt.

Kim for Washington Monthly, “The Mirage of ‘Full Employment'”

Low unemployment rates mask soft spots in the job market, especially among rural Americans and minorities.

For the last several months, Republicans have been resting on the laurels of positive job growth and low unemployment—proof, they say, of the Trump economy’s strength. In March, the nation’s official jobless rate stood at 4.1 percent, the lowest it’s been since the peak of the Great Recession and a level that many economists say is at or approaching “full employment.”

Certainly on paper, the labor market looks to be nearly as tight as it was during past expansions, such as during the boom of the late 1990s and early 2000s. In reality, however, the low official unemployment rate masks some serious weaknesses in the economy, including in the parts of the country that are the strongholds of Trump’s support.

Rural job growth, for example, is lackluster in comparison to that of cities. And while college graduates and the highly-skilled are in demand, minorities and lesser-skilled workers are still struggling. The share of people actually participating in the labor market is also significantly lower than in the past, including among “prime-age” adults between the ages of 25 and 54 who are the backbone of the job market. Simply put, fewer Americans are working or even looking for jobs. This means the decline in jobless rates reflects to some extent a shrinking pool of Americans looking for work.

Continue reading at Washington Monthly.

House GOP’s Balanced Budget Amendment Proposal is a Sham

On Thursday, House Republicans will vote on a constitutional amendment proposed by Rep. Bob Goodlatte (R-VA) that would require the federal government to balance its budget every year. The vote, which is virtually guaranteed to fall short of the two-thirds super majority necessary for passage, is nothing more than a cynical ploy to give the party of debt and deficits a veneer of fiscal responsibility while they make no serious effort to earn it. Anyone who is truly concerned about soaring deficits should ignore this distraction and focus on the real record of the Republican-controlled Congress.

In December, the same House Republicans who now ostensibly want to reduce budget deficits championed a partisan tax cut that instead grew the gap between revenue and spending by $1.9 trillion over 10 years. In February, they voted to increase deficit spending by roughly $400 billion over two years. As if more than $2 trillion of additional deficits over two months wasn’t enough, Republicans are hoping to pile on even more borrowing later this year with yet another round of tax cuts. On our current path, deficits over the next decade could total $15 trillion.

Closing this gap through spending cuts alone, as most Republicans would presumably seek to do, would require lawmakers to immediately and permanently cut more than one-quarter of all non-interest spending. If they sought to exempt defense spending or entitlement programs such as Social Security, the cuts to non-exempt programs would need to be even deeper. Simply mandating the budget be balanced doesn’t liberate policymakers from the painful trade-offs required to make it happen.

Should Congress and the president fail to adopt the policy changes necessary to comply with the balanced budget amendment of their own volition, there is no enforcement mechanism in the Goodlatte proposal to compel them. Ill-equipped courts would inevitably be asked to determine national economic policy that should be crafted by the legislative and executive branches.

The Republican crusade for this poorly crafted amendment is particularly dubious considering that most economic experts, including those who are sincerely and deeply committed to promoting fiscal responsibility, don’t believe in the necessity of a balanced budget. Small deficits can be sustainable as long as the debt burden that finances them is growing slower than the economy. For this reason, most informed deficit hawks believe the goal should be to stabilize and reduce the debt as a percentage of gross domestic product rather than to balance the budget.

In fact, requiring a balanced budget in every year could be quite harmful if it prevents the government from using temporary borrowing to stabilize the economy during a downturn. The Goodlatte proposal would only allow spending to exceed revenue in a given year if supported by a three-fifths super majority in both the House and the Senate. When economic output falls, this onerous requirements would make it incredibly difficult for the federal government to maintain even pre-recession spending levels, let alone provide the kind of economic stimulus necessary to prevent a recession from turning into a deep depression.

The sole reason House Republicans are pushing this half-baked proposal now is to give themselves a fig leaf to cover their shameful legislative record. When Congress returned to Washington yesterday, the Congressional Budget Office greeted them with updated projections showing federal budget deficits that were trillions of dollars higher than those projected last year. Republicans hope their constituents will ignore the real damage they’ve done to our nation’s finances if they merely affirm their support for balancing the budget in principle.

Democrats and deficit hawks shouldn’t let the GOP off the hook so easily. They should repudiate this meaningless show vote and demand Congressional Republicans either put up or shut up. Making our fiscal policy sustainable requires real solutions; the proposed balanced budget amendment is nothing more than a sham to avoid them.

This post has been updated to reflect that the version of the amendment being voted on is different than the version Rep. Goodlatte posted on his website last week. That version, which can still be found here, would have also required a three-fifths super majority in both chambers to raise additional revenue and an even larger two-thirds super majority to authorize spending more than one fifth of economic output.

How Ecommerce Helps Less-Educated Workers

Ecommerce has been a major job creator for less-educated workers, at a time when many of their traditional positions have been disappearing.

Between 2007 and 2017, overall US employment of workers with at least a high school diploma and less than a bachelor’s degree dropped by almost 1 million jobs. That’s according to our tabulation of the Current Population Survey.

However,  ecommerce leaders such as Amazon, Walmart, and Chewy.com have been bucking that trend by building fulfillment centers that employ large numbers of workers without college degrees. The ecommerce industries–electronic shopping, warehousing, and couriers and messengers–created jobs for  roughly 270,000 less-educated workers between 2007 and 2017. Most of those gains have come in the past three years.

These workers are tech-enabled–they do not have college degrees, but they work closely with robots and other technology. As a result, as we have shown, real wages for production and nonsupervisory workers in the warehousing industry have been rising rapidly. Real hourly earnings for production and nonsupervisory workers in the warehousing industry are up by 6% over the past year

By comparison, brick-and-mortar retail companies have reduced their employment of less-educated workers by roughly 100,000 over the 2007-2017 stretch. That means ecommerce plus brick and mortar retail combined have been a net plus for less educated workers.  (Note that our analysis intentionally omits workers who do not yet have their high school diploma).

Statement on the Passing of Peter G. Peterson

The next generation lost a champion today with the passing of Peter G. “Pete” Peterson. While many leaders proselytize against debt and deficits when it’s politically convenient, Pete was one of the few whose concern for our nation’s fiscal future was truly sincere. For decades, he consistently advocated for using a responsible combination of spending cuts and tax increases to minimize the burden being placed on young Americans by a growing national debt. Pete worked respectfully with both Democrats and Republicans in pursuit of these solutions, making him a paragon of civility and bipartisan pragmatism in an era where such traits seem to be in short supply.

In addition to his advocacy, Pete was well-known for his philanthropy. In 2008, Pete donated half of his fortune to start the Peter G. Peterson Foundation. The foundation has contributed to think tanks across the political spectrum and offered educational and professional opportunities to young Americans of all ideological stripes. Many leaders talk of empowering the next generation but Pete actually did so. Our condolences go out to Pete’s family, his staff, and the broader budget community during this difficult time.

Even After Budget Deal, Discretionary Spending Remains Low

Although February’s bipartisan budget deal significantly increased discretionary spending, the portion of the federal budget appropriated annually by Congress remains near record-low levels. Both defense and non-defense (domestic) discretionary spending are falling relative to the size of the economy – a trend that has serious long-term implications for our nation’s ability to make critical public investments that strengthen the foundation of our economy.

Domestic discretionary spending is the category of federal spending that encompasses virtually all non-defense, non-entitlement programs. These programs include critical public investments such as infrastructure and scientific research that provide long-term benefits to our society. It is also the part of the budget that Congress has the flexibility to use for addressing unexpected crises such as natural disasters and economic downturns. Reducing the resources available for domestic discretionary spending thus risks jeopardizing many core government functions and the future health of our economy.

Unfortunately, that’s exactly what policymakers have been doing in recent years. The Budget Control Act of 2011 capped both categories of discretionary spending as part of a broader effort to reduce future deficits. When Congress failed to reach a bipartisan agreement on taxes and other categories of federal spending, the BCA automatically triggered an even deeper, across-the-board cut to discretionary spending known as sequestration. While the sequester has been lifted several times since it first took effect, discretionary spending consistently remained far below the original BCA caps.

That trend ended with the Bipartisan Budget Act of 2018. This budget deal not only lifted discretionary spending above sequester levels – it also went above and beyond the original BCA caps for two years. Nevertheless, projected domestic discretionary spending for Fiscal Year 2019 is significantly below the historical average as a percentage of gross domestic product. Moreover, even if policymakers extended these policy changes beyond the two years covered by the BBA, we project that domestic discretionary spending could fall to just 3 percent of GDP within the next decade – the lowest level in modern history.

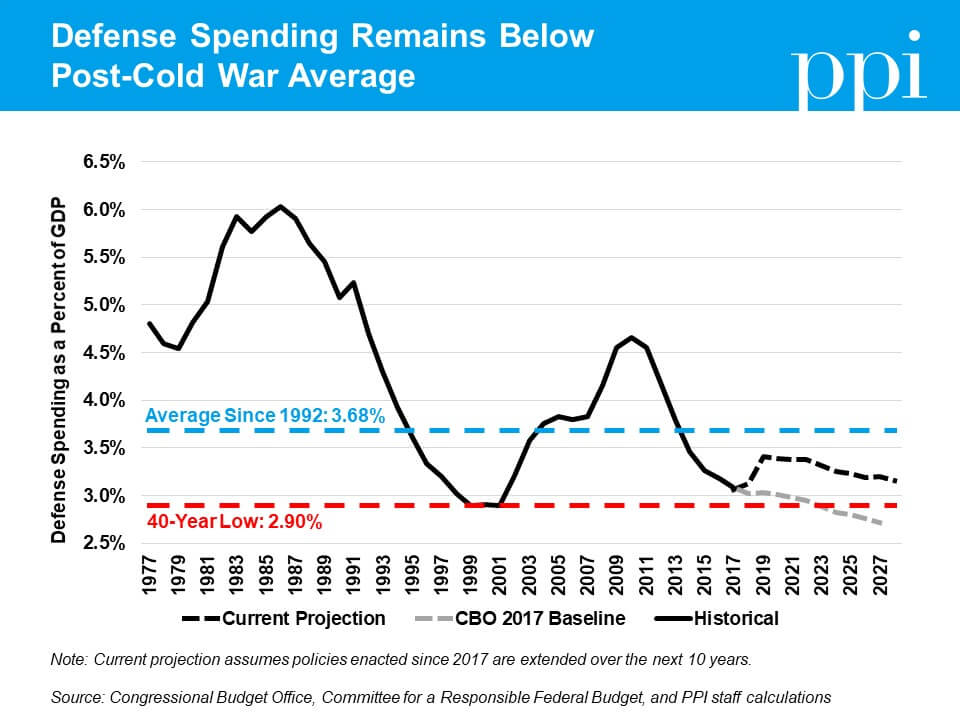
The story is similar for defense spending. Thanks to the pressure put on by the sequester, defense discretionary spending fell to just under 3.1 percent of GDP in FY2017. Under the BBA, defense spending would increase to 3.4 percent of GDP in FY2019 before falling again. Unlike domestic discretionary spending, however, defense would remain above the all-time low it reached before the 2001 terrorist attacks throughout the next decade.

None of this is to say that policymakers should abandon any semblance of fiscal discipline when it comes to discretionary spending. The budget deal set domestic discretionary spending levels above those requested in President Obama’s final budget while also setting defense spending above the levels requested by President Trump. This fact suggests that the immediate spending increase was more than either party really needed to fund its priorities. Sharp spending increases without a clear purpose are more likely to lead to waste as government officials lose the incentive to make tradeoffs and efficiently target taxpayer resources.

Moreover, the budget challenges that led to the original imposition of the Budget Control Act remain serious. PPI criticized the BBA because we believe that any spending increase above the original BCA caps – which were meant to be a down payment on much-needed fiscal discipline – should be offset so as not to further exacerbate the nation’s already ballooning budget deficit. Thanks to both it and other recently enacted legislation, the federal government is now running an annual budget deficit that may never fall below $1 trillion again.

But when policymakers are ultimately forced to confront the nation’s long-term fiscal challenges, they should focus their efforts on the tax code and non-discretionary programs that are growing on auto-pilot faster than the economy. Discretionary spending isn’t the main driver our budget deficits, and most of the savings achieved by cutting internal waste should be redirected towards more beneficial public investments. A great nation invests in its future and cutting those investments too deeply will only hurt us in the long run.

Building Middle Class Wealth with American Development Accounts

U.S. social policy traditionally has emphasized supporting income for low-income families, to the neglect of wealth-building strategies.1 While income supports are essential for covering daily expenses, upward mobility depends on saving and building personal assets, especially completing post-secondary education, purchasing a home, or creating a business.2

Moreover, inequality of wealth in America is worse than income inequality. That’s why it’s time for a new approach to empowering low-income and working Americans. U.S. social policy in the 21st century should stress social investment and wealth creation, not just income transfers to support consumption. This report proposes a new policy – American Development Accounts (ADAs) – intended to help younger workers and blue-collar households rise into the middle class by enabling them to save and accrue assets.

State Drug Price Transparency and Price Gouging Laws: Why They May Raise Health care Costs

In October 2017, Governor Jerry Brown of California signed a “drug price transparency bill,” requiring pharma and biotech companies to give advance notification of significant price increases and provide specific justifications. Brown hailed the bill as a big step toward holding down spending on health care. “Californians have a right to know why their medical costs are out of control,” said Brown.

Many other states are finding the pharma industry to be a tempting target, especially with all the media attention given to a small number of high-profile price hikes. In Maryland, a new “price-gouging” law restricts generic and off-patent medicines from “excessive and not justified” price increases. Nevada has tackled the cost of diabetes medicines such as insulin, requiring drug makers that have raised list prices by a significant amount to release data about the costs of making and marketing the drugs. Other states like New York, New Hampshire, and Maine are considering legislation that would take various approaches to controlling drug pricing as a solution to rising health care costs.

But a new study by the Progressive Policy Institute suggests that state-level drug price laws potentially harm competition and boost drug costs, while doing very little to slow down the overall growth of health care costs. First, we describe the range of state-level drug price laws – both the ones that have been enacted and the ones that are under consideration.

The Ecommerce Counterfactual

I’ve been arguing that the shift to ecommerce has improved the position of workers, by increasing the number of jobs and boosting wage payments. In a nice twitter discussion last week, Jose Azar pointed out that I had not specified a counterfactual, and he was right.

So here I will make up for that omission, at least a bit. Let’s start by laying the groundwork. The direct employment impact of ecommerce primarily shows up in three industries: Retail, couriers and messengers, and warehousing and storage. Most ecommerce fulfillment centers are reported in the warehousing and storage industry, though some are found in the electronic shopping, which is part of retail.  The companies that deliver the packages seem to be mostly reported in the couriers and messenger industry. And of course the brick-and-mortar stores hurt by ecommerce are in the retail industry.

Let’s look at the recent employment history of these three industries (see table below). We will focus on hours worked by production and nonsupervisory workers in what we call the “consumer distribution sector,” the  combination of retail, couriers and messengers, and warehousing and storage.

The Jobs Impact of Ecommerce
Percentage change, aggregate hours worked, production and nonsupervisory workers
2014-2017
Retail 3.8%
Couriers and messengers 19.9%
Warehousing and storage 33.5%
Total (consumer distribution sector) 6.3%
All private sector 5.8%
The consumer distribution sector is defined as including retail, couriers and messengers, and warehousing and storage

Data: BLS CES

According to BLS CES data, aggregate weekly hours of production and nonsupervisory workers in the warehousing and storage industry are up 34% over the past 3 years, reflecting the rapid expansion of ecommerce fulfillment centers.  Aggregate weekly hours of production and nonsupervisory workers in the courier and messenger industry are up 20%, and hours worked in retail are up 4%

Taken together, hours worked in the consumer distribution sector are up 6.3% over the past 3 years. That’s faster than the 5.8% gain in hours worked in the overall private sector of the economy.

How does this gap compare to the historical pattern? We’ll look at the previous two business cycles, 1990-2000 and 2000-2007.

Let’s start with the 1990-2000 business cycle. Even though Amazon was founded in 1994, ecommerce was fairly insignificant for the labor market in this decade. In 2000 Amazon had only 6 fulfillment centers in the United States, and employed a grand total of 9,000 full-time and part-time workers globally. In total, ecommerce amounted to less than 1% of retail sales in 2000.

During this decade, hours worked in the private sector grew at a 2.1% annual pace. By comparison, hours worked in the consumer distribution sector grew at only a 1.6% annual rate.

The next business cycle was terrible for employment. Between 2000 and 2007, private sector hours growth slows to a 0.5% rate,  while consumer distribution sector hours rose at only a 0.2% pace.

However, it’s worth noting that the gap between  hours growth in the private sector and consumer distribution sector narrowed as ecommerce became more important. By 2007, ecommerce amounted to about 3.5% of retail sales.

From 2007 to 2017, the share of ecommerce rose to roughly 9%.  At the same time, hours growth in the consumer distribution sector accelerated to an 0.6% annual pace. The gap with the private sector narrowed even further, to less than 0.1 percentage points.

And when we focus on the last three years–the period of the supposed retail apocalypse–we see that hours growth in the consumer distribution sector is now outpacing private sector hours growth, even as Amazon and other online retailers have opened up ecommerce fulfillment centers all over the country.

How can this be? The short answer is that ecommerce is sucking unpaid hours out of the household sector. In effect, consumers are paying workers do their picking, packing, and driving for them. Ecommerce is hours-creating, rather than hours-destroying.

This analysis is indicative rather than conclusive, of course. But it suggests that ecommerce has had a positive effect on hours growth in the consumer distribution sector, relative to private sector hours overall.


Soaring Real Wages for Ecommerce Workers

There’s a lot of talk about labor monopsony these days.  But at least in ecommerce, the labor market seems to be working the old-fashioned way—booming demand for fulfillment center workers and package delivery workers is leading to sharply rising real wages. Over the past year, employment of production and nonsupervisory workers in the warehousing industry has risen by 5%, while employment of production and nonsupervisory workers in the courier and messenger industry has soared by a striking 8.7% (all figures in this post are 3-month averages).

At the same time, real hourly earnings for production and nonsupervisory workers in the warehousing industry are up by 6% over the past year, while real hourly earnings for production and nonsupervisory workers in the courier and messenger industry are up by 2.6%.   Meanwhile the private sector as a whole showed no real wage gain at all.

Can we expect this to continue? There’s no reason why not.  There’s no great surge of unemployed workers coming out of retail to hold down wages.  Indeed, the number of production and nonsupervisory workers in retail is up 76K in February over a year earlier.

At least for now, ecommerce is the place to be.


Gerwin for The Hill, “‘Go-it-alone’ trade strategies are neither wise nor effective”

On March 1, after weeks of “absolute chaos” within his administration, Trump held a hastily arranged “listening session” with metals executives.

Trump announced — to the surprise of his staff — that he’d be imposing import tariffs of 25 percent on steel and 10 percent on aluminum, and that these tariffs would last “a long period of time.” Trump reportedly chose 25 percent duties because a round number “sounds better.”

Reaction to Trump’s informal announcement was swift, widespread — and harsh. The stock market, which Trump cites as confirmation of his economic genius, plunged 420 points. The Wall Street Journal called the tariffs the “biggest policy blunder” of Trump’s presidency.

Continue reading at The Hill. 

Senate Democrats’ Deficit-Neutral Infrastructure Plan Clarifies the Cost of Tax Cuts

Senate Democrats yesterday unveiled an ambitious $1 trillion infrastructure proposal that would invest in everything from roads and railways to hospitals and high-speed broadband. And in sharp contrast to recent proposals by the Trump administration, this new Democratic proposal includes a plan to fully pay for itself.

The proposal calls for repealing three elements of the recently-enacted Republican tax bill that almost exclusively benefit the wealthiest taxpayers, as well as closing the “carried interest loophole” that allows certain earnings on Wall Street to be taxed at a lower rate than other compensation. It would also raise the top corporate tax rate from 21 percent to 25 percent – the average rate among OECD countries and the level originally proposed by House Ways and Means Chairman David Camp (R-MI) back in 2014.

Spending in the new proposal is broken down into 19 different categories, each with its own budget and parameters for implementation. The package as a whole includes additional guidelines, such as encouraging the adoption of innovative technologies and long-term financing mechanisms, to accompany proposed spending. If fully implemented, the proposal’s authors believe it would create 15 million good-paying jobs.

Compare that to the proposal offered last month by the Trump administration, which claims to increase infrastructure investment by $1.5 trillion even though the administration’s budget provided no additional funding for it. The Trump proposal would also privatize a wide variety of physical assets, such as waterways and interstate highways, that the Democratic proposal would retain for public use.

Another advantage of the Democratic proposal is that it makes clear to voters the true cost of the Republican tax cut enacted last year – something PPI has been urging Democrats to do since before passage of the bill. For less than half the cost of this terrible tax cut, voters could have gotten a robust 21st century infrastructure that would benefit our economy for generations to come. That message could be a powerful one heading into the midterm elections, especially if paired with a credible and comprehensive Democratic framework for “repealing and replacing” the GOP tax bill.

Senate Democrats should be commended for including suggested funding mechanisms in their proposal. Whereas Republicans added over $2 trillion of tax cuts to the national debt, the Democrats’ infrastructure proposal would be fully funded and deficit-neutral. If implemented in a timely and cost-effective way, their proposal might even reduce budget deficits because of the high economic returns on well-targeted infrastructure investment. The stark contrast between these two approaches to fiscal policy is just further evidence that only one of the two political parties in Washington is making any attempt to pay for its proposed policies.

But when they find themselves in a position to implement these policies, Democrats should keep in mind that simply paying for their new proposals isn’t sufficient.

The federal government is now spending $1 trillion more than it raises in revenue every year – a gap that is projected to more than double over the next decade. It will be impossible to sustain social programs as they’re currently structured, let alone fund new ones, without major reforms to both existing spending and the tax code. The government cannot afford to commit every dollar of additional revenue to new promises until it finds a way to pay for the ones we’ve already made.

For these reasons, Democrats would be wise to use yesterday’s proposal as merely the starting point for crafting a complete fiscal policy: one that sustainably finances both public investments and a strong social safety net without placing an undue burden on young Americans. A fiscally responsible public agenda along these lines is what the Democratic Party needs, and it’s what our country deserves.

New Analysis Highlights Dire Fiscal Situation

New projections from the non-partisan Committee for a Responsible Federal Budget show that Donald Trump and the Republican-controlled Congress have plunged the United States back into trillion-dollar deficits at a time when most economists believe we should be whittling them down.

According to CRFB’s estimates, which are based on a methodology similar to the one used by official scorekeepers at the Congressional Budget Office, the policy changes made since last fall will likely result in $6 trillion being added to the national debt over the next decade if they’re allowed to remain in place. This is in addition to $10 trillion of new debt that was already projected to accumulate under the law as it was previously written.

If the government continues on this trajectory, our national debt will be more than double the level it was when Donald Trump took office by the end of the decade. Annual budget deficits will triple. Annual spending on interest payments will quadruple. And economic growth won’t be able to keep up with any of it.

Many of the fiscal challenges facing the United States predate the current administration. But whereas CBO previously projected annual budget deficits to exceed $1 trillion beginning in 2022, CRFB’s analysis warns that we now face trillion-dollar deficits this year. By 2028, the budget deficit will swell to 2.4 trillion, which would be over 8 percent of gross domestic product – a level not seen outside of the Great Recession since World War II.

The primary contributors to this deteriorating fiscal situation are the Republican tax bill (formerly known as the Tax Cuts and Jobs Act) and the February budget deal (the Bipartisan Budget Act of 2018), which together account for over half of the additional borrowing expected over the coming decade. Funding for disaster relief, overseas military engagements, and other “emergencies,” as well as policies that were supposed to expire last year but were nonetheless extended without being offset, were expected to add another trillion dollars to the debt. Finally, Republican efforts to undermine the Affordable Care Act by defunding cost-sharing reductions would further grow government debt by increasing the cost of health care.

The CRFB report notes that when President Obama left office, “paying for new legislation and securing the solvency of various trust funds would have been sufficient to prevent debt from rising rapidly as a share of GDP.” Since then, legislation spearheaded by Republicans has “turned a dismal fiscal situation into a dire one.”

Most of the blame belongs to the GOP, but Democrats are not completely innocent either. Many supported the February budget deal that not only reversed harmful sequestration but also busted through less restrictive spending caps originally intended to be a down payment on fiscal discipline, as well as some of the other policy changes mentioned above that were adopted without offsets. Both parties now have their hands on the shovel being used to dig our fiscal hole deeper and, as this new analysis makes clear, they need to put it down.

Good News: FCC Proposes to Streamline 5G Small-Cell Siting Process

PPI has repeatedly made the economic case that accelerating the deployment of 5G  is essential for boosting growth.   For example, in a 2016 report, we estimated that next generation wireless could add 0.7 percentage points annually to economic growth.* Moreover, as we noted in a January 2018 report, 5G networks can play a key role in reviving manufacturing and other physical industries, and enabling what we call the “Internet of Goods.”**

For these reasons, we strongly support the FCC’s new proposal to streamline the deployment of next generation wireless facilities by reducing the federal regulatory burden for establishing new sites, to be voted on at their March 22 meeting. The FCC says that  their revised approach to small cells “could cut the regulatory costs of deployment by 80 percent, trim months off of deployment timelines, and incentivize thousands of new wireless deployments—thus expanding the reach of 5G and other advanced wireless technologies to more Americans.”

In our view, the FCC is making a significant contribution to economic growth by proposing policies that that encourage the rapid deployment of 5G networks.  The revival of local manufacturing, and other physical industries that are part of the Internet of Goods,  requires high speed mobile broadband to be as pervasive as possible.  Regulations that delay or depress the build-out of these networks are standing in the way of higher living standards for Americans.

*”Long-term U.S. Productivity Growth and Mobile Broadband: The Road Ahead,” March 2016

**”The Internet of Goods and a Revitalized Economy: Upstate New York as a Template“, January 2018