How Should We Think About Pro-Growth, Pro-Job Competition Policy?

We think of the United States as a low-inflation economy, with an overall price increase of 36% since 2000, or less than 2% a year.  But the fact is, the inflation  performance of different industries has varied greatly since 2000.  For example, the price of construction has gone up more than 100% since 2000, as measured by the BEA’s implicit value-added price index. The price of educational services has gone up by 80%, and the price of air travel has gone up by 76%.

By comparison, according to the BEA, the value-added price of broadcasting and telecom services has fallen by 22% since 2000, while the price of computer and electronic products has fallen by 62%.

The high-inflation industries tend to be on the physical side of the economy. As they get more expensive, they eat away at living standards. Think about it. Americans spend only 6% of their consumption dollars on tech/telecom goods and services, as measured by the BEA.  Other areas, such as housing, health, food, and transportation, are far more important for consumer spending.

That’s why we are suggesting a different way of prioritizing where we should focus our competition policy. Take a look at the 2×2 matrix below, where we categorize industries by whether they are high-inflation or low-inflation, and high-innovation or low-innovation.


Competition Policy Matrix

High innovation Low innovation
Rapid price increase


Air travel, construction, education
Slow price increase Tech/telecom


We suggest that progressive competition policy should focus on the upper right-hand quadrant–those industries where prices are increasing rapidly and innovation has been slow. There are two issues in these industries. First, has market power pushed up prices and held back innovation? Second, is government regulation helping support that market power?

Moreover, it also often turns out that high-innovation, low-inflation industries produce more jobs than low-innovation, high-inflation industries. Take a look at the table below, which just focuses on performance since 2007. The value added price index for air travel has risen almost 55% since 2007, according to the BEA. Meanwhile, prices for the tech/telecom sector has fallen more than 6%. And tech/telecom is clearly more innovative than air travel.

Over the same period, jobs have grown three times as fast in the tech/telecom sector as in air travel (including supporting services).


Comparing Performance
change since 2007
Air travel tech/telecom
Price change 54.5% -6.4%
jobs (thousands) 16.5 498.5
jobs (percent) 2.5% 7.6%


We suggesting that tackling market power in high-inflation, low-innovation industries could help boost growth, raise living standards, and create more jobs.

Democrats Take A Wrong Turn

Which one is not like the others?

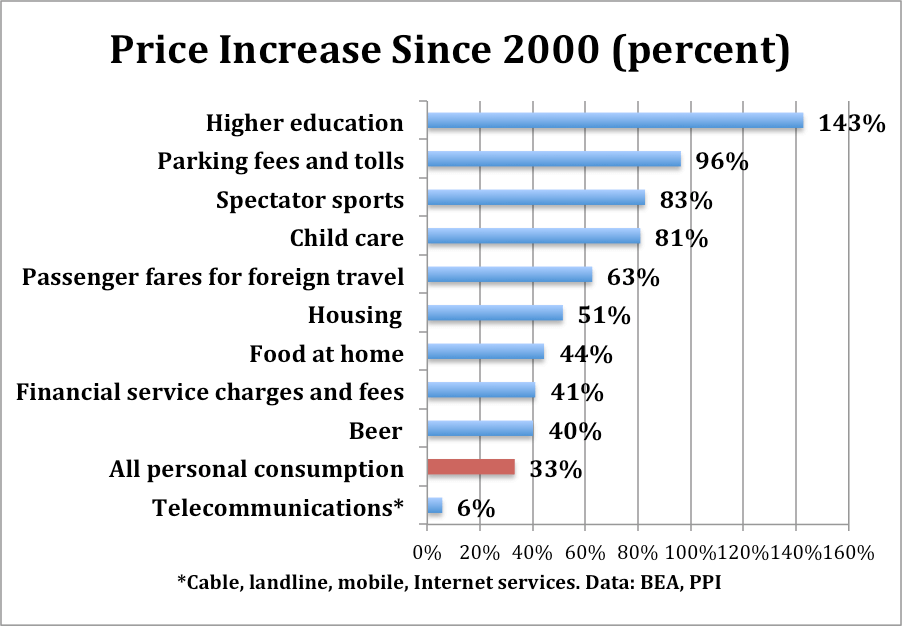
Since 2000, American households have been hit by price increases which far exceed their ability to pay. Necessities like housing and food have skyrocketed in prices. Child care is 81% more expensive, passenger fares for foreign travel are up 63%, financial fees are higher by 41%. Even beer, perhaps a necessity for some, is up 40%.

In an era of low inflation, these price increases are worrisome, and have gone a long way to drag down real incomes. From this perspective, the proposal from Congressional Democrats to stiffen antitrust enforcement–part of the “Better Deal” plan they unveiled today–is a good idea. They identify sectors such as airlines, food, beer, and financial services as ripe for closer antitrust scrutiny. We agree.

But Democrats are unfortunately honing in on one target that makes no sense: The data-driven telecom and tech sector. Let’s start with telecom first, which is specifically mentioned in the Better Deal proposal. According to data from the Bureau of Economic Analysis, the price of personal telecom services—cable, landline and mobile phone, and Internet—has risen only 6% over the past 16 years. That’s far below the 33% average for all consumer goods and services.

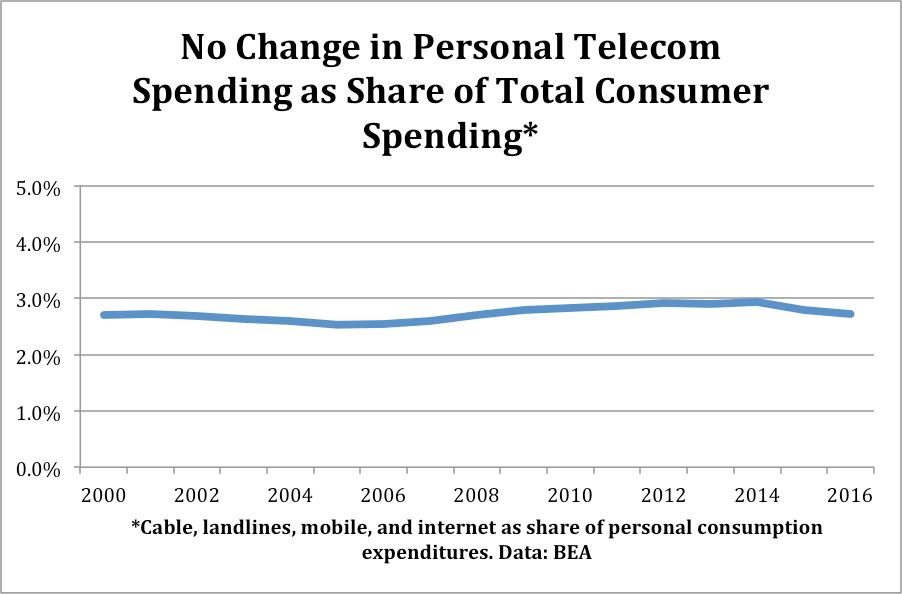
Moreover, the share of personal spending going to personal telecom services is only 2.7%, no higher than it was in 2000. Despite the enormous surge in smartphones and Internet usage, the spending burden of personal telecom services has not risen, according to data from the BEA.

More broadly, the entire tech/telecom/content sector has produced much lower price increases and higher consumer welfare gains than the rest of the economy. In 2016, tech/telecom/content consumer goods and services absorbed 6% of consumer spending, no higher than it was in 2000.*

Moreover, tech and telecom companies have turned into big job producers across the whole country. By our analysis, the tech/telecom sector has produced over 800,000 net new jobs since 2007, including decent-paying ecommerce jobs for high school graduates in states such as Kentucky, Indiana, and Tennessee.

If Democrats are concerned by price increases that hurt consumers and workers, there are plenty of other places to look. For example, the price of parking fees and tolls has gone up 96% since 2000, according to the BEA. The price of spectator sports has gone up 83%, and funeral and burial services are 70% more expensive, driven in part by a surprising 104% increase in the wholesale price of burial caskets.

On a more prosaic level, the price of construction has doubled since 2000, propelled in part by large increases in prices of construction materials like asphalt. Are there local monopolies in these industries that drive up prices? It’s worth looking into.

If we want to use competition policy as a tool for growth, we should primarily focus on low-innovation sectors that have big price increases. These are the sectors that are draining consumer purchasing power and undercutting real income growth. Outside of healthcare, these are also the industries producing fewer jobs.

Conversely, we should place a lower competition policy priority on high innovation sectors and companies. That’s the only way to help all Americans.

*Calculations available on request.


Rotherham for US News, “Challenge Students, Don’t Shield Them”

Tap Tapley, the legendary Outward Bound instructor, is said to have described the crux of the experiential outdoor experiential learning school’s approach as “inducing anxiety and then releasing it in a constructive manner.”

And for a half century, Outward Bound courses have done just that – putting students in challenging and uncomfortable situations with real and immediate consequences. Students find themselves climbing mountains, paddling rivers, exploring remote canyons, traveling in the wilderness in winter conditions or sailing. Students learn skills to survive and thrive in these settings. But more importantly they learn about themselves; compassion and empathy for others; their capabilities; and tenacity and resiliency in pursuit of challenging goals.

But this model is pretty much the exact opposite of the scene at many residential colleges today, especially our most elite ones. Instead of challenge, much of the debate on college campuses today turns on ideas about intellectually “safe” spaces, where students don’t have to encounter ideas that make them uncomfortable or engage with those with whom they disagree.

Just last week, Harvard University, a school regarded as a breadbasket of future American leaders, decided that free association, allowing its students to decide what clubs they want to join, threatened its ideas about inclusivity. (Yes, obviously richly ironic, given what it takes to get into Harvard in the first place.) Meanwhile, the college curriculum has at many schools become basically an a la carte experience, where students can gravitate toward courses that reinforce rather than challenge their worldview.

Read more at US News.

Stangler for Real Clear Markets, “Renewed Optimism As the Start-Up Geography Divide Narrows”

Over the past several years, even as the national fervor over startups has continued unabated, there has been a string of negative findings about the state of American entrepreneurship. The Economic Innovation Group, among others, chronicled a long-term decline in business creation as well as ever-increasing concentration in where businesses are being created. Only five metro areas, they found, accounted for half of the nation’s increase in new businesses between 2010 and 2014. Other researchers have found similar declines across several indicators of economic dynamism—fewer and fewer Americans, for example, work for new and young firms.

Happily, a recent report by Michael Mandel at the Progressive Policy Institute (PPI) highlighted a potential reversal of these trends. (Full disclosure: I have a PPI affiliation.)

Using government data, Mandel charts a “revival of economic dynamism” since 2015 that is fairly widespread: by last year, the “growth gap” between tech hubs in Silicon Valley, New York, Boston, Austin had disappeared.

Read more at Real Clear Markets.

The Economic Impact of Data: Why Data Is Not Like Oil

The saying “data is the new oil” is at times referenced by analysts working to assess whether our increasingly digital and data-driven world generates positive impact for our economy and society. However, this saying is imprecise. Data should not be compared to oil – it is not a scarce commodity, is nonrival, and cannot be monopolized.

With regards to privacy, the analogy further weakens. While regulations for traditional commodities like oil seek to protect individual rights to ownership of resources (an individual’s oil), the same regulations for the data-driven sector can have negative impact on the economy overall. This is because, when it comes to data, economic value creation is driven by the analysis of data in conjunction with other information. Thus, laws that quite rightfully protect individual rights to data can be at odds with innovation and economic growth.

overview: Power-of-Data-One-Pager


Why Retail Productivity is Being Undermeasured, and Why Ecommerce Jobs are Rising

I have consistently argued that ecommerce is boosting employment by creating jobs at fulfillment centers. For example, over the past year, ecommerce jobs have risen by 61,000, while brick-and-mortar retail has fallen by only 7,000. That sounds like a counter-intuitive result, given that ecommerce is supposedly more productive than brick-and-mortar retail.

But the increase in paid jobs is much easier to understand if you realize that shopping for goods is actually the result of two inputs: paid market work by employees and unpaid time by households, in the form of driving to the store, parking, wandering through the aisles, checking out, driving home.

According to the American Time Use Survey from the Bureau of Labor Statistics, in 2015-2016 Americans spent .645 hours per day on average shopping for consumer goods or traveling to shopping, or 4.5 hours per week. Since there are 260 million Americans aged 15 and over, that means Americans spend approximately 1.2 billion hours a week shopping for consumer goods or traveling to shopping (that’s the equivalent of 30 million full-time jobs).

By comparison, in 2006-2007 Americans spent 4.75 hours per week shopping for consumer goods or traveling to shopping, or 0.25 more. That extra quarter hour corresponds to 64 million extra hours per week (260 million x .25). So because of the increase in ecommerce over the past 9 years, American households save 64 million hours per week, or the equivalent of 1.6 million full-time jobs.

Some of these jobs are being moved into the market sector: The fulfillment center workers do the aisle-cruising that shoppers used to do themselves, the truck drivers take the place of the consumers driving back and forth to the mall.

This also implies that retail productivity is being unmeasured, since we’re not counting the reduction of household hours. I don’t have an estimate yet, but the undermeasurement could be substantial.


Evolution, Not Revolution: What Retail Apocalypse?

When I was young, oh so many years ago, my parents would take me shopping at Korvette’s, a chain of discount department stores originally based in New York City. But alas, Korvette’s went bankrupt in 1980, just one of hundreds of names on Wikipedia’s long list of defunct department stores. Then, of course, Wikipedia has an equally long list of defunct retailers of the United States, including such stalwarts as Robert Hall (whose jingle is still stuck in my mind*).

Now, of course, we have apparently entered the era of the “retail apocalypse,” a newly minted calamity which has its own Wikipedia entry. Suddenly all of our shopping malls and big box stores are supposed to disappear, washed away by the ever-rising tide of ecommerce.

But at least so far, the data shows very little signs of an apocalypse. According to the latest BLS employment report, employment at brick-and-mortar retail is down by only 7,000 jobs over the past year, a mere rounding error for an industry that employs over 15 million workers. At the same time, employment in the ecommerce sector has rise by 61,000 over the past year, more than making up for any erosion in brick-and-mortar retail.

Indeed, if we look at three month averages, brick-and-mortar retail looks more or less flat. Job losses in some retail sectors, such as general merchandise and clothing stores, is being partly offset by employment gains in motor vehicles, auto parts, building materials, and health stores. Companies announce store closings, hoping to get a better deal out of landlords–but for the same reason, stores that are doing well don’t announce that they are expanding.

So far this looks like an evolution rather than a revolution: Some retailers are closing, while others (including online sellers) are expanding. The big news is that fulfillment centers pay 30-40% more than brick-and-mortar jobs in the same area. But more about that in another post.


*”Where the values go up, up ,up

And the prices go down, down, down

Robert Hall will show you

The reason they give you

High quality, economy!”

Press Release: New PPI Report finds 113,000 jobs in the growing Australian App Economy

WASHINGTON—The Progressive Policy Institute (PPI) today released a new report, “The Rise of the Australian App Economy,” which estimates 113,000 workers are employed in the Australian App Economy, a growth of at least 11 percent since 2014. It also calculates app Intensity — the number of App Economy jobs in a country as a percentage of total jobs in that country. Australia has an App Intensity of 0.9 percent. By comparison, Europe has an App Intensity of 0.8 percent, while the U.S. App Intensity is 1.1 percent.

The report includes estimates of App Economy jobs by state and as a percentage of all jobs on a state-by-state basis. More than 56,000 workers are employed in the App Economy in New South Wales, 29,000 in Victoria, and 14,500 in Queensland.

“The Australian App Economy is remarkably diverse, both in industry and geography,” writes PPI Chief Economic Strategist Michael Mandel, the author of the report. “A surprisingly broad range of enterprises are searching for workers across the country who have the ability to design, develop, maintain or support mobile applications.”

“Remember that any app is exportable, in the sense that it can be downloaded from an app store by anybody around the world, no matter how far the distance. That means the Australian App Economy can become a basis for continued growth. In addition, apps can improve the efficiency and attractiveness of the Australian economy.”

The report also provides an overall breakdown of App Economy employment by operating system, comparing the number of jobs in the iOS ecosystem with the number of jobs in the Android ecosystem. Finally, it compares the estimate here with a 2014 estimate of Australian App Economy jobs done using a somewhat different methodology.

As the App Economy grows in significance globally, it becomes essential to have a consistent set of App Economy job estimates so that policymakers can compare their country’s performance with that of other countries. The ultimate objective for PPI is to be able to track the growth of the App Economy globally, and to see which countries are benefiting the most. Ideally, PPI should be able to link App Economy growth to policy measures implemented by governments.

###

The Rise of the Australian App Economy

When Apple introduced the iPhone in 2007, that initiated a profound and transformative new economic innovation. While central bankers and national leaders struggled with a deep financial crisis and stagnation, the fervent demand for iPhones and the wave of smartphones that followed was a rare force for growth.

Today, there are more than 4 billion mobile broadband subscriptions—an unprecedented rate of adoption for a new technology. Use of mobile data is rising at 55 percent per year, a stunning number that shows its revolutionary impact.

More than just hardware, the smartphone also inaugurated a new era for software developers around the world. Apple’s opening of the App Store in 2008, followed by Android Market (now Google Play) and other app stores, created a way for iOS and Android developers to write mobile applications that could run on smartphones anywhere.


Amazon, Whole Foods, and the Simple Arithmetic of Household Time

I’ve been writing a lot about ecommerce lately. I would be remiss if I did not address the Amazon offer to buy Whole Foods. I have two thoughts.

First, I’m not an antitrust economist. But it strikes me that under ordinary antitrust logic, Amazon’s purchase of Whole Foods would ring no alarm bells. Despite the name recognition of Whole Foods, the company’s $16 billion in sales last year pales next to Kroger’s $115 billion in sales or Albertson’s roughly $60 billion in sales. If anything, the purchase increases competition in the grocery business.

Second, what is Amazon likely to do with Whole Foods? I’m not privy to Amazon’s strategic thinking, of course. But the main point of ecommerce, when done right, is to reduce the time consumers spend shopping—the drive to the store, the search for parking, the endless trudging through the aisles. In turn, ecommerce companies have been shifting those unpaid hours of household labor into the market sector, creating decent-paid jobs in fulfillment centers and electronic shopping operations.

By my calculations, the shift to ecommerce over the past nine years has saved American households roughly 64 million hours per week in reduced shopping time, or the equivalent of 1.6 million full-time jobs. (yes, that million is right…calculations below).

Some of those hours of unpaid household labor were shifted to the market sector. Over the same period, the number of ecommerce jobs rose by almost 400,000, as fulfillment center workers and drivers took over the tasks that consumers used to do. Brick-and-mortar jobs dropped by 76,000, so that was a net plus for job creation.

If these trends continue, Amazon and other ecommerce companies will try to make shopping for meals easier and less time-consuming for American households, and generate more paid jobs in the process.

****

Calculations

According to the American Time Use Survey from the Bureau of Labor Statistics, in 2015-2016 Americans spent .645 hours per day on average shopping for consumer goods or traveling to shopping, or 4.5 hours per week. Since there are 260 million Americans aged 15 and over, that means Americans spend approximately 1.2 billion hours a week shopping for consumer goods or traveling to shopping (that’s the equivalent of 30 million full-time jobs).

By comparison, in 2006-2007 Americans spent 4.75 hours per week shopping for consumer goods or traveling to shopping, or 0.25 more. That extra quarter hour corresponds to 64 million extra hours per week (260 million x .25). So because of the increase in ecommerce over the past 9 years, American households save 64 million hours per week, or the equivalent of 1.6 million full-time jobs.

Note: I get an almost identical result based on the magnitude of the decline in  brick-and-mortar’s share of retail sales.


Moving Beyond the Balance-Sheet Economy

In 2016 the United States exported to Europe US$598bn worth of goods and services, and imported $698bn of goods and services. Minus some statistical discrepancies, European countries recorded the inverse flow of imports and exports.

For the past century, economists and policymakers have relied on this ‘balancesheet approach to economics to guide their decisions. One country’s exports are reported as another country’s imports. One company’s production shows up elsewhere in the economy as consumption, or investment, or inventories. The output of the world is the sum of the outputs of the individual countries.

The balance-sheet approach to the economy is well-suited to the physical world. Go back 100 years, and the economies of industrialized countries were composed of physical objects that we could easily count: millions of cases of canned American corn; millions of hectolitres of French wine; millions of metric tonnes of German coal; thousands of long tonnes of British steel ingots. These were tangible and real economic outputs.


EU Competition Policy

PPI believes that the tech/telecom space is intensely competitive, not just in the United States but around the world.  We also believe that companies which are innovative and invest in new technologies and capabilities are providing great benefits to consumers and workers, including a fast-growing number of good jobs.

From that perspective, we are strongly against the EU’s punitive $2.7 billion antitrust fine against Google.  We believe the EU’s action will only feed into a global regulatory attack against innovation, and as such, will hurt consumers and workers.

Mandel featured on Financial Times, “Michael Mandel on the case for productivity optimism”

Michael Mandel, chief economic strategist at the Progressive Policy Institute, joined Alphachat to talk about his report, “The Coming Productivity Boom”, co-authored by Bret Swanson of Entropy Economics.

Mandel argues that the decades-long productivity stagnation will end once companies in the “physical” industries — transportation, construction, manufacturing, healthcare, wholesale and retail trade — start investing in information technology the way that companies in the digital industries have.

From the summary of their paper:

The digital industries, which account for around 25% of U.S. private-sector employment and 30% of private-sector GDP, make 70% of all private-sector investments in information technology. The physical industries, which are 75% of private-sector employment and 70% of private-sector GDP, make just 30% of the investments in information technology.…

Information technologies make existing processes more efficient. More importantly, however, creative deployment of IT empowers entirely new business models and processes, new products, services, and platforms. It promotes more competitive differentiation. The digital industries have embraced and benefited from scalable platforms, such as the Web and the smartphone, which sparked additional entrepreneurial explosions of variety and experimentation. The physical industries, by and large, have not. They have deployed comparatively little IT, and where they have done so, it has been focused on efficiency, not innovation and new scalable platforms. That’s about to change.

Mandel tells me why he believes that productivity pessimists such as Robert Gordon are wrong to extrapolate from current trends, why he isn’t worried by the increasing market concentration in the leading companies in many economic sectors, and how public policy can play a role in facilitating this forthcoming productivity boom. And in a speed round, we also discuss the specific ways in which physical industries can be transformed by more IT investment, plus which technologies hold the most promise.

For the full interview, listen here at Financial Times

Do today’s tech/telecom companies employ too few workers?

On June 7,  Axios  journalist Chris Matthews wrote a piece “Big Companies, Fewer Workers”  that said:

The five most valuable companies in the U.S. are all technology firms that employ far fewer workers than their industrial predecessors.

He echoes a common complaint. But is it really true?

I decided to  compare employment at today’s most valuable  tech/telecom companies with employment at the most valuable industrial giants of the past.  My point of reference is 1979, the all-time peak year for manufacturing employment in the United States. At the end of 1979, these were the top 10 industrial companies (ordered by market cap), and their total employment.


Table 1: Top 10 Most Valuable US Industrial Companies, 1979*
  Jobs(thousands)
IBM 337
General Motors 853
General Electric 405
Eastman Kodak 126
DuPont 134
3M 88
Dow Chemical 56
Merck 31
Xerox 116
Johnson & Johnson 72
Total 2218
Data: Siblis Research , corporate annual reports, Progressive Policy Institute

So as of 1979, the ten most valuable U.S. industrial companies had a total employment of 2.2 million.*

By comparison, I took today’s most valuable tech/telecom companies, ordered by market cap as of June 10. Here’s the list, plus their total employment.


Table 2: Top 10 Most Valuable US Tech/Telecom Companies, 6/10/2017
jobs(thousands)
Apple 116
Alphabet 72
Microsoft 114
Amazon.com 341
Facebook 17
AT&T 268
Verizon 161
Comcast 159
Oracle 136
Intel 106
Total 1490
Data: Annual reports, PPI

So the ten most valuable US tech/telecom companies today employ 1.5 million workers, roughly two-thirds as many as the 2.2 million employed by the ten most valuable US industrial companies in 1979.

However, a look at the two lists shows something interesting:  Take General Motors out of the 1979 list, and the size distribution in 1979 doesn’t look that much different than the size distribution in 2017.   Industrial leaders such as Kodak, Dupont and Xerox employed between 100K and 150K workers in 1979, roughly the same workforce as Apple, Microsoft, Verizon, Comcast, Oracle, and Intel today. GE and IBM in 1979 employed roughly the same number of workers as Amazon today. And Merck in 1979 wasn’t that much larger than Facebook today.

Conclusion: In terms of employment, the major difference between the industrial giants of 1979 and the tech/telecom giants of 2017 is one superstar company, General Motors, whose 1979 workforce dwarfed any other company on either the 1979 or the 2017 list.


To be continued…


*My definition of ‘industrial’ includes non-energy manufacturing companies. The 1979 list should include Procter and Gamble, but I could not locate their employment data in their annual report.  There’s no reason to think that substituting P&G for J&J would make a significant difference in the list. Ford Motor’s stock price underwent a steep plunge in 1979 that took it out of the top 10 industrial companies by market cap.


Berg for Washington Monthly, “Trump’s Betrayal of the Hungry Working Class”

With Trump’s proposal to gut federal food assistance by $192 billion — much of which would come out of the shopping carts of the working class — the president is once again proving his willingness to shaft those who supported him most.

Contrary to the racially-tinged stereotype that Americans who rely upon the Supplemental Nutrition Assistance (SNAP) program — formerly known as food stamps — are primarily “inner city,” liberal people of color, the reality is that many SNAP recipients are white, rural and suburban Americans who voted for Trump; the president won eight of the ten states with the highest percentage of SNAP recipients.

Not surprisingly, the parts of the nation with the highest rates of SNAP usage tend to be those with the highest levels of poverty, hunger, and food insecurity. In 2015, 42 million Americans lived in households classified by the federal government as “food insecure,” meaning they could not always afford the food they needed. Of those, more lived in rural areas and suburbs areas than in cities.

Continue reading at Washington Monthly.

Connecticut’s Embarrassing Anti-Innovation Law

Innovation is the foundation of growth. As innovation spreads to the physical industries, the result is higher wages, lower costs, and a more dynamic economy, as we showed in our recent report, The Coming Productivity Boom.

But innovation in physical industries  has proceeded slower than we might have wanted, In part, that’s because promising technologies are being hindered at the state and local  level. Consider the humble eye refraction. Some companies are rolling out technologies that enable ordinary people to do eye refractions remotely, using computers or smartphones. Such a technology has the potential to greatly reduce the cost of updating and renewing contact lens prescriptions, while enabling people to check their eyes more often.

Unfortunately, in Connecticut, the state legislature is now considering a bill that would undercut the use of remote eye refractions. The bill says, in part:

No provider shall issue an initial prescription to or renew an initial prescription for a patient without having performed an in-person evaluation and an eye examination of the patient.

In other words, everyone has to make an expensive and time-consuming in-person trip to an eye doctor to get a prescription renewal for contact lens, even if the remote refraction says no change. This requirement could be especially costly in Connecticut, where optometrists make $192,870 per year on average, the highest in the country, according to the Bureau of Labor Statistics.* Indeed, Connecticut is the only state where optometrists make more than family and general practitioners, based on BLS data.

Remote refraction can and should never replace in-person visits to optometrists and ophthalmologists. But in a world where health care costs are increasingly squeezed, it seems silly and downright embarrassing for a forward-looking state like Connecticut to inhibit a technology that could make people better off at a lower cost.

*These figures are based on the May 2016 Occupational Employment Statistics from the BLS. See this page for a list of top-paying states for optometrists. This data does not cover self-employed workers.