One of the biggest puzzles in democratic societies across the world these days is what to do about regulation. On the one hand, regulation is important for a well-functioning society. On the other hand, too much regulation can hamper innovation and growth.
Moreover, there’s a feeling that democratic governance has broken down. We don’t seem to have a good process for coming to collective decisions.
Case in point: The “open internet” debate. When the FCC issued its Open Internet Order in March 2015, wesaidit was “time for Congress to act.” We believed and still believe that in the importance of an open internet, but the FCC was unilaterally picking the wrong approach. The imposition of Title II rules was unnecessary to keep the Internet open.
Now that the FCC may be backing from the 2015 Open Internet Order under new FCC Chairman Ajit Pai, we say the same thing: It’s time for Congress to act. These big swings back and forth in policy don’t do anyone any good.
Consumers, tech firms, ecommerce and content companies, and telecom providers all need certainty about the rules of the road, and that means legislation that enacts the open internet into law without an excessive and unnecessary regulatory structure. It may not be quick and pretty, but it’s the right way to go.
Ecommerce jobs for production and nonsupervisory workers are paid on average about 25% more than production and nonsupervisory jobs for the private sector as a whole. That’s according to BLS data.
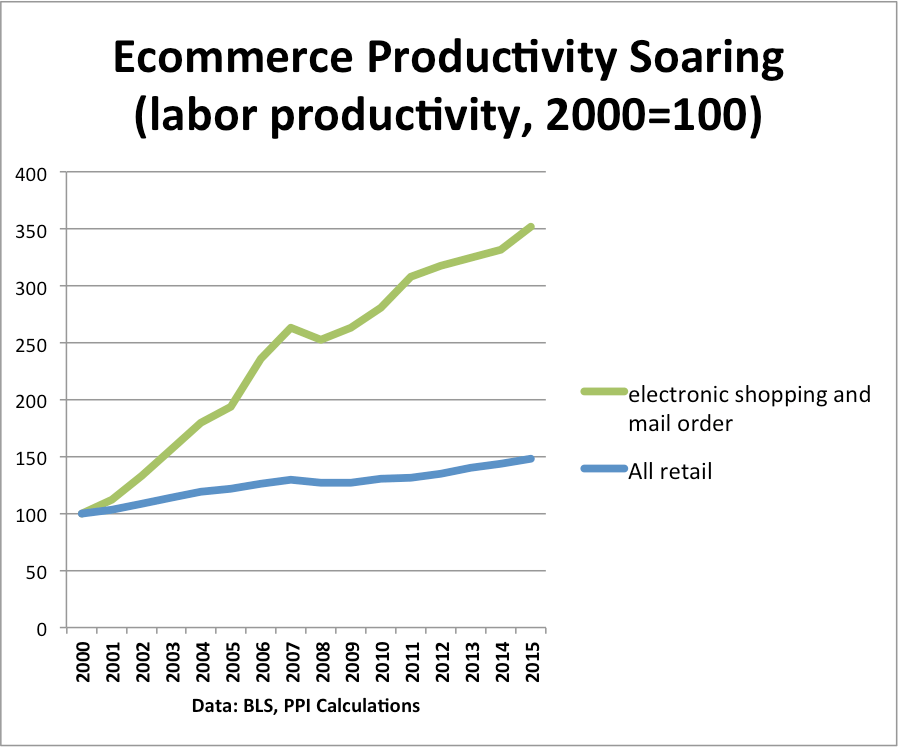
Economic theory suggests that industries with faster productivity growth should have faster real wage growth. That’s exactly what we see in the case of the electronic shopping industry.
The figure below compares labor productivity growth in the “electronic shopping and mail order” industry (NAICS code 45411) with productivity growth in retailing as a whole. We can see an enormous difference. From 2000 to 2015, ecommerce productivity rose at an annual rate of 8.7% annually, compared to 2.6% for retailing as a whole.
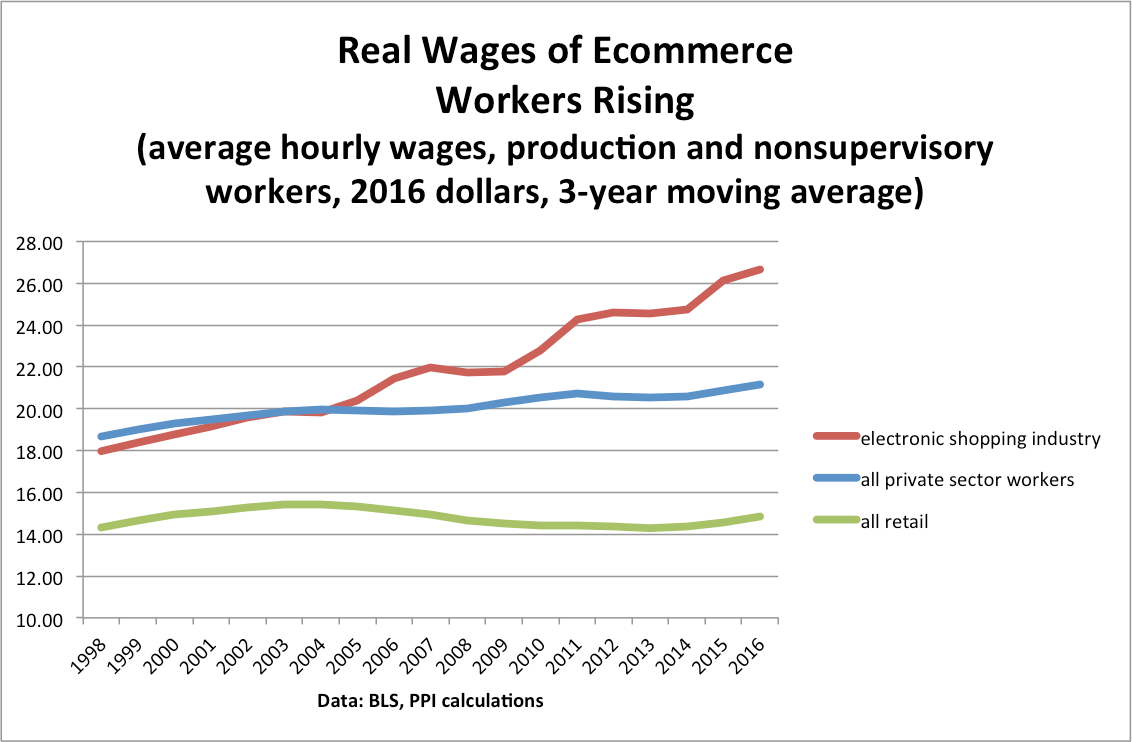
This difference in productivity growth is reflected in the growth of real wages. The figure below compares average hourly wages, in 2016 dollars, for production and nonsupervisory workers in three industries or sector: electronic shopping, all retail trade, and all private sector workers. We see that production and nonsupervisory workers in electronic shopping earned an average wage of $25 per hour. That’s not bad at all–it’s about 25% higher than average hourly wages for all production and nonsupervisory workers, and about 80% higher than average hourly wages for all retail workers.
Depending how we define middle-class, these figures imply that production and nonsupervisory jobs in ecommerce
What about jobs? Since 2007, the number of retail jobs has risen by roughly 420K, while the number of “electronic shopping” jobs has risen by 140K. And that latter number is most likely an underestimate, because it doesn’t include ecommerce jobs that are part of larger retail establishments. So ecommerce is a major driver of good job creation in the retail sector.
The implication is that as more and more retail jobs shift to ecommerce, both wages and productivity will rise.
WASHINGTON— The Progressive Policy Institute (PPI) today released a new study, “A Historical Perspective on Tech Jobs,”authored by PPI Chief Economic Strategist Michael Mandel comparing job creation performance among tech companies in the United States to employment leaders of the past. The study finds that today’s big tech companies are following a similar or better employment trajectory than big job creators of the past, while average hourly wages for many tech and telecom industry jobs fall solidly into the rank of “middle-class” jobs, though the concept of “middle-class” requires greater analysis and examination.
“When we compare today’s tech leaders with the employment leaders of the past at a similar stage of development, it turns out that the job creation performance of the tech sector looks quite good,” writes Mandel. “We remember the giant corporate employers of the post World War II period, but we fail to remember how they had generally been in existence for many decades before they reached that mammoth size. And just like it takes many years for an oak tree to grow from an acorn, it turns out that employment growth simply takes time.”
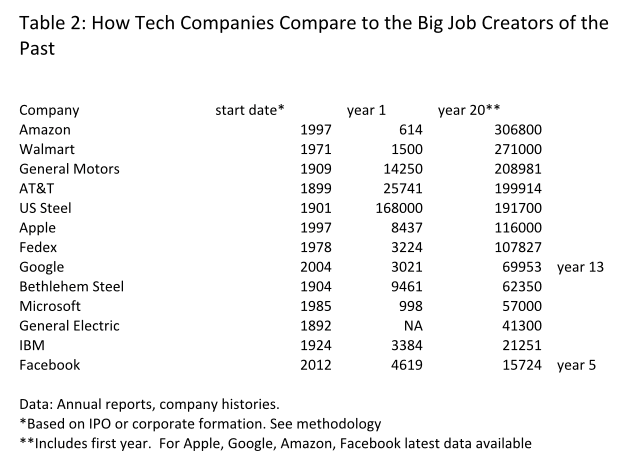
PPI’s study finds that in 2016, Amazon became the fastest American company to reach 300,000 workers, hitting that mark in its twentieth year as a public company. This figure, which does not include contractors or temporary workers, represents an average employment growth rate of roughly 30 percent annually.
By contrast, General Motors reached 300,000 employees in 1941, 32 years after its 1909 founding. American Telephone & Telegraph hit the same milestone in 1926, 27 years after its 1899 absorption of the local Bell systems. And Walmart went over 300,000 associates in its 1991 fiscal year, its twenty-first year as a public company.
According to the study, Amazon is not alone; In fact, tech giants such as Google, Apple, Facebook, and Microsoft are adding jobs as fast or faster than the great job-producing companies of the past, like General Motors, AT&T, Walmart, IBM, General Electric, U.S. Steel, and Bethlehem Steel.
The study includes charts and tables highlighting the historical comparisons, as well as a comparison of average hourly wages for selected tech and telecom industries. This comparison previews an upcoming paper on the quality and wages of tech and telecom jobs, including upstream and downstream jobs.
Amazon just announced that it would add more than 100,000 fulltime jobs in the US over the next 18 months. That’s fantastic.
But even before that announcement, it turns out that Amazon was the fastest US company to reach 300,000 jobs. That’s based on a new paper we are releasing today, called “A Historical Perspective on Tech Job Growth.” Here’s the beginning of the paper.
General Motors reached 300,000 employees in 1941, 32 years after its 1909 founding. American Telephone & Telegraph hit the same milestone in 1926, 27 years after its 1899 absorption of the local Bell systems. And Walmart went over 300,000 associates in its 1991 fiscal year, its 21st year as a public company.
But in 2016, Amazon became the fastest American company to reach 300,000 workers, hitting that mark in its 20th year as a public company. This figure, which does not include contractors or temporary workers, represents an average employment growth rate of roughly 30% per year. That’s an amazing growth rate.
But Amazon is not alone. In fact, tech giants such as Google, Apple, Facebook and Microsoft are adding jobs as fast or faster than the great job-producing companies of the past, like GM, AT&T, Walmart, IBM, GE, US Steel, and Bethlehem Steel.
Consider this: Twenty years after its 1892 founding, General Electric had 41,000 employees. Google beat that mark in 2012, only 8 years after its 2004 initial public offering.
En los Estados Unidos hemos estado, con mucha razón, obsesionados con el resultado de las elecciones presidenciales. Pero el mundo sigue girando. Por ejemplo, la semana pasada Colombia ratificó untratado de pazhistórico entre el gobierno y el movimiento rebelde. PPI tuvo el privilegio de estar en Bogotá este octubre, donde realizamos unevento sobre la Economía App, el cual fue muy difundido, y describió cómo la Economía App de Colombia ha generado más de 80.000 puestos de trabajo.
Hay que felicitar al presidente de Colombia, Juan Manuel Santos por su éxito. Al mismo tiempo, él ha presentado una importante reforma tributaria que simplifica el sistema de impuestos corporativos mientras que recauda nuevos fondos. No es sorpresa que la medida de reforma tributaria sea controversial. Por ejemplo, lasfranquiciasde la cadena de sandwiches Subway reclaman que el incremento en los impuestos puede terminar con el negocio.
De mayor impacto, la reforma tributaria de Santos afecta directamente al sector digital de Colombia y en particular a la Economía App. Incrementaría el IVA en dispositivos (teléfonos, tablets y computadoras) del 16 al 19% – solo las tablets y las computadoras menos costosas estarían exentas del IVA. La reforma ialzaría el IVA sobre los servicios móviles de datos del 16 al 19% y agregaría un 4% adicional de impuestos al consumo (un total de 23%). Finalmente, la reforma tributaria impondría un IVA sobre todo el contenido y servicios digitales que sean provistos por proveedores de origen extranjero.
Estas medidas tributarias podrían potencialmente restringir la continuación del crecimiento de la Economía App de Colombia, la cual depende de dispositivos asequibles y el banda ancha móvil, y del acceso a apps provenientes de cualquier parte del mundo. Más aún, esto podría afectar negativamente la competitividad en el resto de la economía, ya que la Economía App es mucho más que solo entretenimiento y aplicaciones de juegos. De hecho, se desarrollan y usan aplicaciones por grandes multinacionales, bancos, compañías de medios audiovisuales, tiendas minoristas, y gobiernos.
Uno de los cambios más grandes que se aproximan es el Internet de las Cosas, el cual es el uso de Internet para ayudar a controlar objetos físicos y nuestro entorno físico. Los agricultores usarán cada vez más aplicaciones que ayuden a su producción agricultural, los enfermeros y doctores usarán aplicaciones para administrar el cuidado de los pacientes, y los productores usarán aplicaciones para controlar sus fábricas.
A nivel global, los países exitosos digitalmente como Vietnam y China aplican tasas de IVA relativamente bajas a los datos y servicios móviles para estimular el uso (Vea esteinformereciente sobre la inclusión digital y los impuestos sobre el sector móvil).
Finalmente, como hemos mencionado en nuestra publicación de octubre de 2016:
Si los legisladores son serios con respecto a fomentar un ecosistema dinámico para nuevas empresas y la Economía App, entonces continuar con las políticas que apoyen la Economía App será lo que ayudará a Colombia a participar en la revolución móvil global como productor más que como consumidor. Aplicar demasiadas restricciones costosas sobre la Economía App de Colombia podría desviar el crecimiento hacia otro lugares. (énfasis añadido)
We in the US have been understandably obsessed with the outcome of the presidential election. But the rest of the world keeps moving forward. For example, last week Colombia ratified a historicpeace treatybetween the government and the rebel movement. PPI was privileged to be in Bogota just this October, where we held a widely publicizedApp Economy event, describing how Colombia’s App Economy has generated over 80,000 jobs.
Colombia’s President Juan Manuel Santos should be congratulated for his success. At the same time, he has introduced an important tax reform measure that simplifies the corporate tax system, while raising new funds. Not surprisingly, the tax reform measure is controversial. For example,franchisesof the Subway sandwich chain are complaining that higher taxes will drive them out of business.
More consequentially, the Santos tax reform takes direct aim at Colombia’s digital sector and App Economy in particular. It would raise the VAT on devices (phones, tablets and computers) from 16 to 19% – only the least expensive tablets and computers would be exempt from the VAT. The tax reform would raise VAT on mobile data services from 16 to 19% and add an additional 4% consumption tax (total of 23%). Finally, the tax reform would charge VAT on all digital content and services provided by suppliers based overseas.
These tax measures could potentially restrict continued growth of Colombia’s App Economy, which depends on affordable devices and mobile broadband, and access to apps from all over the world. Moreover, this could hamper competitiveness in the rest of the economy, since the App Economy is far more than just entertainment and game apps. In fact, apps are developed and used by major multinationals, banks, media companies, retailers, and governments.
One of the biggest changes coming is the Internet of Things, which is the use of the Internet to help control physical devices and our physical environment. Farmers will increasingly use apps to aid their agricultural production, nurses and doctors will use apps to manage patient care, and manufacturers will use apps to control their factories.
Globally, digitally-successful countries such as Vietnam and China apply relatively lower VAT rates to mobile data and services to boost uptake (See this recentreporton digital inclusion and mobile sector taxation).
Finally, as we note in our October 2016 paper:
If policymakers are serious about fostering a dynamic startup ecosystem and App Economy, then continuing with the types of policies that facilitate App Economy growth will allow Colombia to participate in the global mobile revolution as a producer rather than a consumer. Putting too many costly restrictions on Colombia’s App Economy could divert the growth elsewhere. (emphasis added)
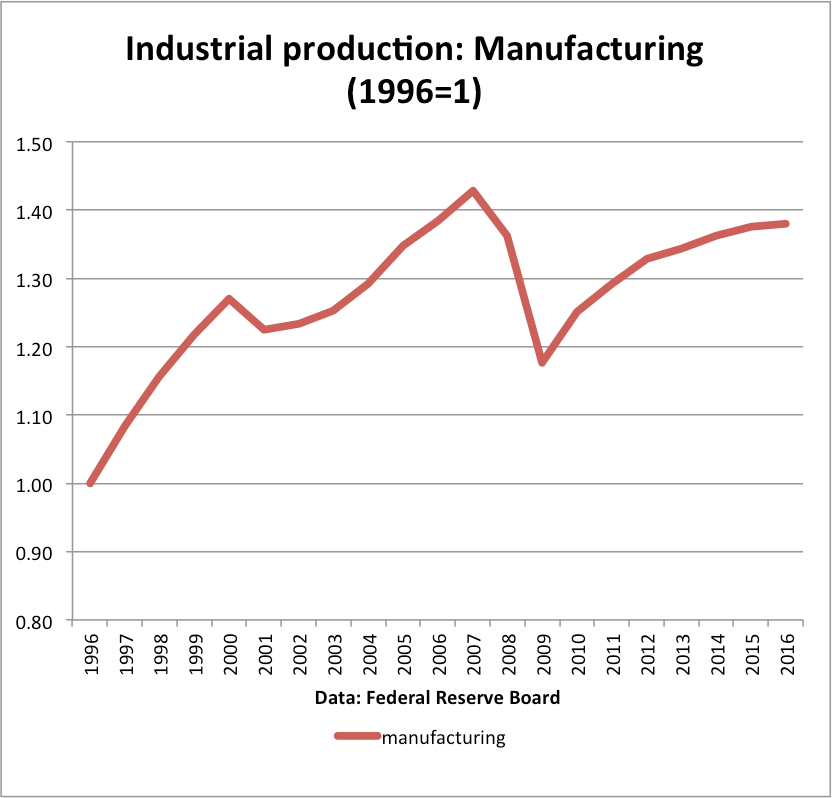
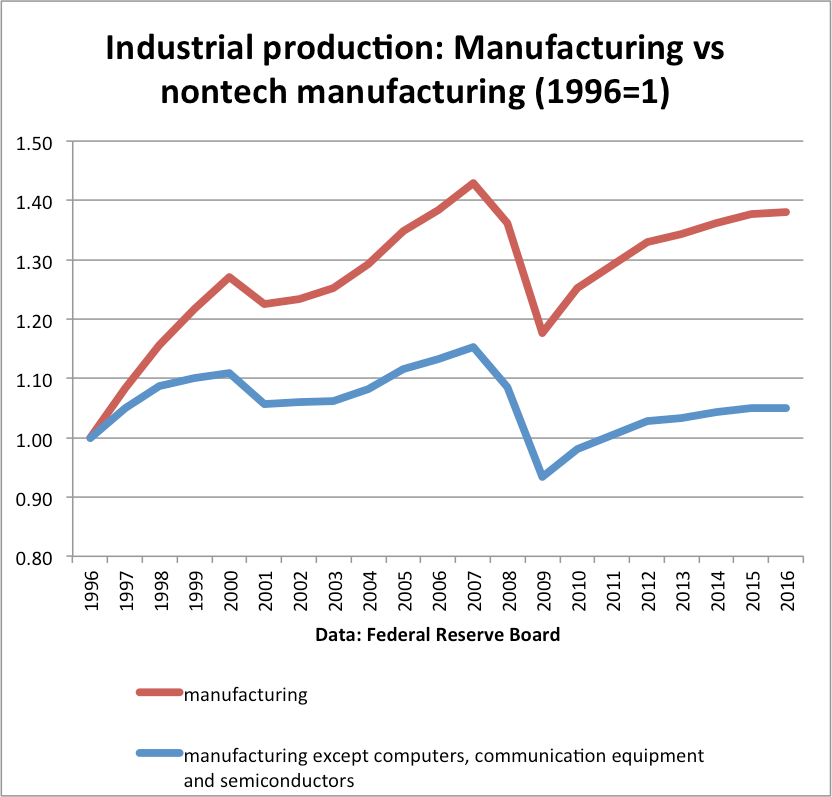
Everyone has seen this chart, or something similar, recently. It tracks the production of the manufacturing sector over the past twenty years. Looks pretty good, doesn’t it? Since 1996 manufacturing industrial production has risen almost 40%, despite intense global competition.
But now let’s add another line to the chart–this time, manufacturing industrial production after we remove tech manufacturing. That’s the blue line in the chart below.
What’s changed? It turns out that once we have taken out tech manufacturing–computers, communication equipment, and semiconductors–the output of the rest of manufacturing has only risen by 5% over the past 20 years, and is well below its 2007 peak.
Over the same period, the output of tech manufacturing has risen by a factor of 20, or 2000%, as least according to Federal Reserve Board estimates (and they have some of the best economists around).
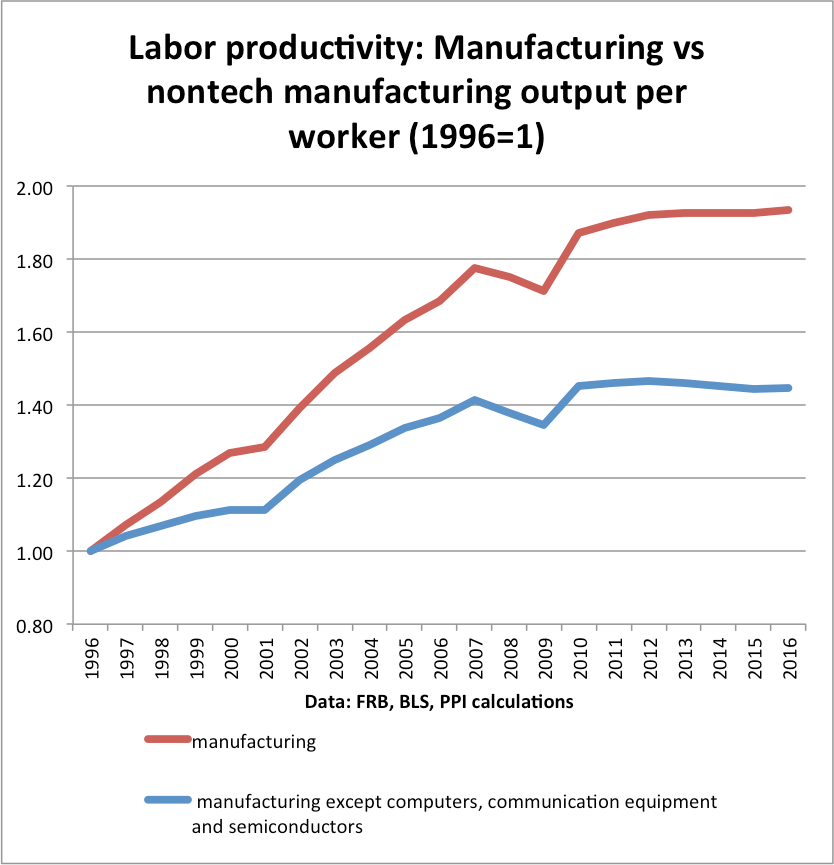
The same divergence shows up in productivity growth. I do a simple calculation, dividing manufacturing industrial production by the number of fulltime equivalent workers in manufacturing, and then I do the same for non-tech manufacturing. Over this twenty year period, it looks like this:
The top line–the manufacturing industrial production per worker–shows that productivity in manufacturing has almost doubled over the past twenty years. But roughly half of that gain is due to the tech sector. Once we remove tech production from manufacturing, the 20-year productivity gain falls from 93% to 45%. And while that 45% gain in productivity is nothing to sneeze at, it amounts to only 1.9% annually.
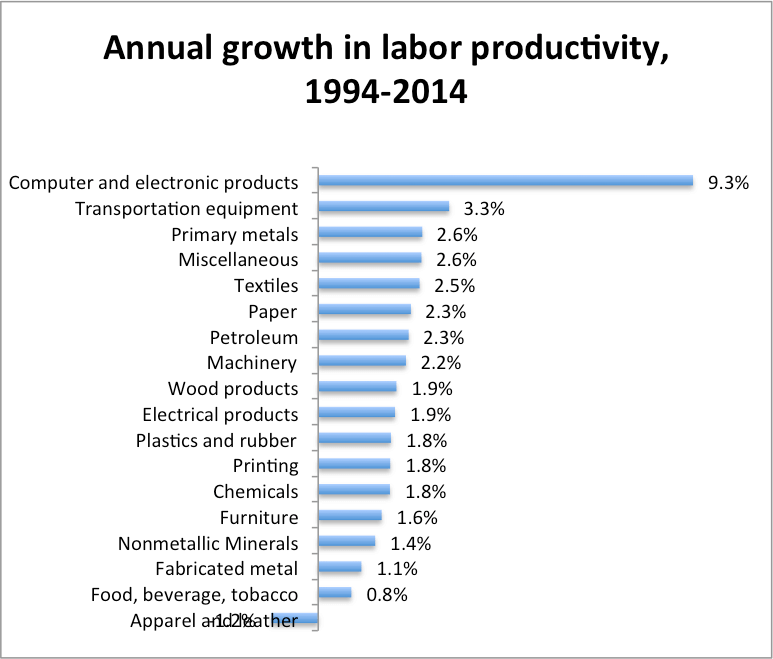
Let’s break down manufacturing labor productivity growth by industry. These figures come from the BLS.
We see that computer and electronic products are far and away the best performing manufacturing industry, in terms of productivity growth. Then it falls off quickly to transportation equipment (motor vehicles and aircraft), which is the main user of robots. Then productivity growth across the rest of manufacturing ranges from mediocre to downright uninspiring.
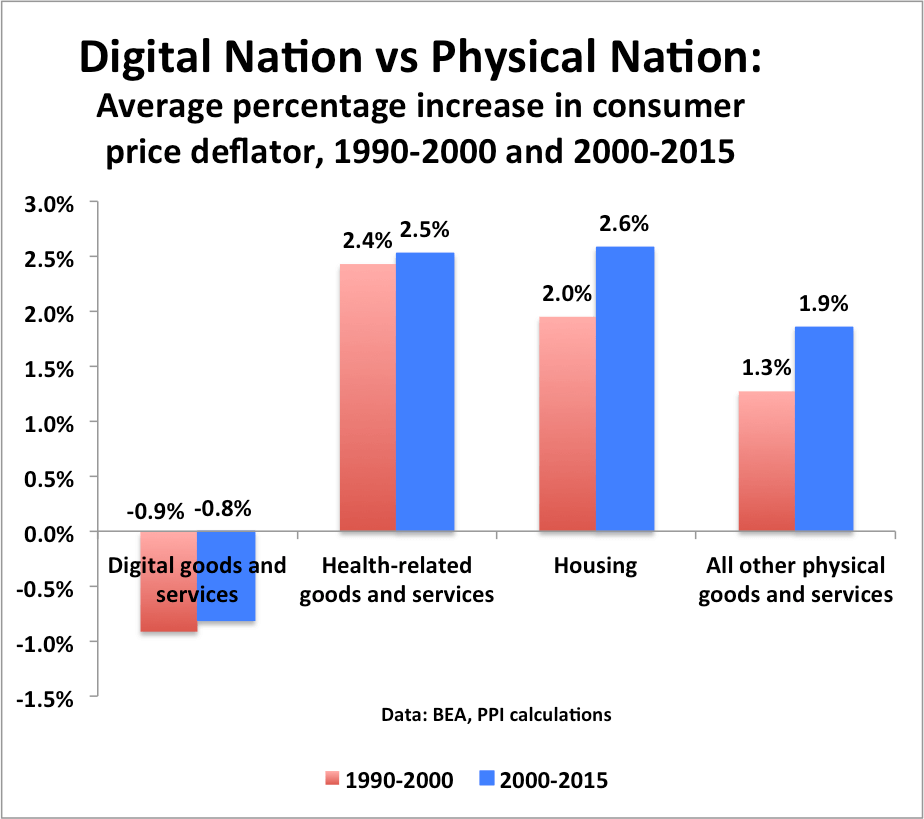
In a post-election post we showed how American workers are being failed by the physical industries, which had dramatically underperformed the digital industries across a wide range of metrics, including productivity, compensation, and job growth. This sharp and growing economic gap between the Digital Nation and the Physical Nation had profound political consequences, since the Physical Nation is still triple the size of the Digital Nation.
In this post we look at the economy from the consumer side.
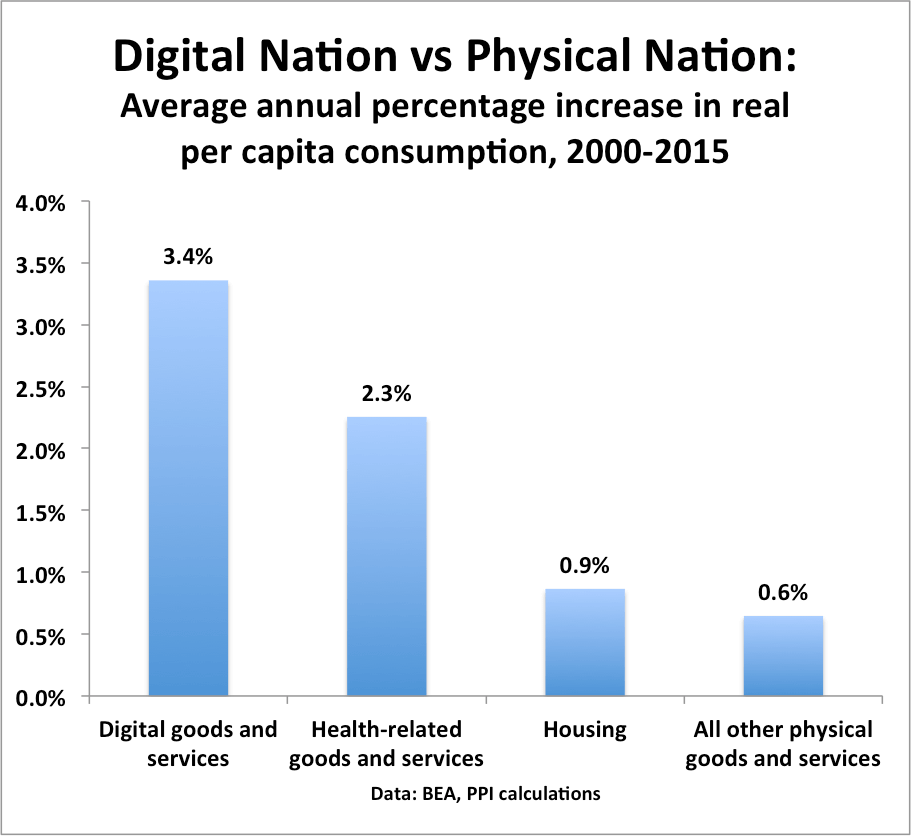
1. Per capita real consumption of physical goods and services, outside of housing and health care, has grown by only 10% since 2000, or an average of 0.6% annually. By comparison, per capita real consumption of digital goods and services has skyrocketed, growing by 64%, or 3.4% annually.
2. In other words, to the extent that consumer living standards have been rising, the gains have been mainly driven by digital goods and services. For example, per capita real consumption of communication services–including internet, wireless, and cable–is up by 60% since 2000. This calculation is based only on government data, without taking into effect possible unmeasured gains in consumer surplus.
3.. By contrast, in the physical sector per capita real purchases of motor vehicles and parts has risen by only 6% since 2000, or only 0.4% per year. Similarly, per capita real purchases of food and beverages for home use has risen by only 4%, or 0.3% annually. It should be noted that food processing is a manufacturing industry which has shown no labor productivity growth in the past ten years, .
4. The Digital Nation is mainly characterized by falling or flat consumer prices, while the Physical Nation is mainly characterized by rising consumer prices. In the digital sector, consumers spend less to get more, while in the physical sector, consumers spend more to get less. The price of communication services is basically flat since 2000, allowing even low and middle-income households to participate in the App Economy.
5.On the other hand, low- and middle-class households have battled with the rising price of food, housing, healthcare, and transportation. The nominal incomes of middle class households (middle quintile) have risen 34% since 2000. But food prices have risen 41%; the price of housing, fuels and utilities (except phone and cable) is up 50%; and the price of food services and accommodations is up 50%. And while the price of new motor vehicles has been relatively flat since 2000, the price of gasoline is up 65%; the price of auto maintenance and repair is up 53%, and the price of taxicabs is up a stunning 74%.
6. The rate of inflation has actually accelerated in the Physical Nation. As the chart above shows, the price of physical goods and services, outside of health and housing, rose at a 1.9% rate in the period 2000-2015, compared to a 1.3% rate in the 1990s.
7. The digital sector has performed extremely well for consumers over the past 15 years. From the policy and political perspective, our focus should be on why prices rose so fast in the physical sector since 2000 compared to the previous decade. The price increases for physical goods and services helps explain why low- and middle-class households have been struggling, and why they are so angry.
Japan has the potential to play a key role in the next global economic boom, which will be based around the application of new mobile networks to physical industries such as manufacturing and transportation to boost consumer welfare, and increase productivity, real wages and job growth.
Indeed, Prime Minister Shinzo Abe’s emphasis on structural reform as the “third arrow” of
Abenomics can help lead the way to such a transformation. However, the government’s increased willingness to intervene in the mobile sector—such as issuing guidelines on how carriers should price handsets–runs the risk of going against the spirit of Abenomics and structural reform.
In this paper we lay out the reasons why increased Japanese government intervention in the mobile sector will likely hurt consumers in the long run, rather than help them, and slow down the innovation and investment needed to be a global technology leader.
The introduction of Apple’s iPhone in 2007 initiated a profound and transformative new economic innovation. Today, less than a decade later, there are 4 billion smartphone subscriptions globally, an unprecedented rate of adoption for a new technology. Mobile data usage is rising at 55% per year, a stunning number that shows its revolutionary impact.
More than just hardware, the smartphone also inaugurated up a new era for software developers around the world. Apple’s launch of the App Store in 2008, followed by Android Market (now Google Play) and other app stores, created a way for iOS and Android developers to write mobile applications from anywhere in the world, with the ability to sell and distribute them globally.
This paper examines the economic impact of the App Economy in Japan. We estimate that App Economy employment in Japan totaled 579,000 as of April 2016.
Here are some bullet points on the economics of the election:
America is divided between the Digital Nation and the Physical Nation. The Digital Nation includes tech, entertainment, publishing, telecom, finance, and professional services such as management consulting, accounting, computer programming, design. The Physical Nation includes manufacturing, mining, construction, retail, transportation, health care, and the rest of the economy The Digital Nation makes up about 25% of private sector employment, the Physical Nation 75% (we first laid out this division of the economy in a March 2016 report).
While there are many factors going into Trump’s election, on the economic side, there was one reality: The members of the Physical Nation finally got tired of suffering while the Digital Nation soared. And since the Physical Nation outnumbers the Digital Nation 3-1, that’s the election.
For the past fifteen years, the Digital Nation enjoyed strong productivity growth, stable prices, high investment in IT, rising employment, and higher (and rising) incomes. By contrast, the Physical Nation has suffered from weak productivity growth, rising prices, weak investment in IT, weak employment growth (outside of healthcare), and lower (and barely rising) incomes.
Digital Nation vs Physical Nation
Digital Nation
Physical Nation
Productivity growth rate (2000-2015)
2.7%
0.7%
Real compensation per worker, growth rate (2000-2015)
1.3%
0.8%
Employment growth rate (2000-2015)
1.3%
1.4%
0.1% (without healthcare)
Share of private sector employment (2015)
25%
75%
Share of private sector compensation (2015)
35%
65%
Share of IT investment (2015)
75%
25%
Annual price change
0.8%
2.4%
Data: BEA, BLS, author calculations
The split between the digital and the physical sector was first described in Mandel (2016). Numbers may differ slightly from earlier calculations.
4. The Digital Nation is concentrated in blue states. States that voted for Clinton in this election averaged 35% digital, while states that voted for Trump are 23% digital on average. Here are the top states, measured by share of private sector GDP coming from the digital sector.
Top Digital States
Share of private economy that is digital
DC
49.9%
Delaware
47.8%
New York
43.8%
Massachusetts
37.7%
Oregon
37.4%
Connecticut
34.3%
Virginia
33.5%
California
33.5%
Colorado
32.5%
Rhode Island
31.5%
Maryland
31.1%
Georgia
30.8%
NH
30.4%
Illinois
30.1%
New Jersey
29.8%
Minnesota
29.8%
Washington
29.4%
Missouri
28.0%
North Carolina
27.7%
Utah
27.6%
Pennsylvania
27.2%
Arizona
26.8%
Florida
26.5%
South Dakota
26.3%
Ohio
25.8%
Nebraska
23.5%
Kansas
23.3%
Michigan
23.3%
Wisconsin
23.2%
Data: BEA, author calculations
Next: How trade and productivity growth have affected the Physical Nation
BRUSSELS—According to research by the Progressive Policy Institute (PPI), the Android mobile operating system has helped create 1.2 million App Economy jobs in Europe. The figure comes from a PPI policy memo, “The App Economy in Europe: Leading Countries and Cities,” which covers the 28 EU countries plus Norway and Switzerland. Android-related App Economy jobs are found in every European country, led by the United Kingdom and Germany. Indeed, Europe has more Android-related App Economy jobs than the United States.
“App Economy jobs have been growing at a rapid pace, even as the overall European labor market is still weak,” says Dr. Michael Mandel, PPI’s Chief Economic Strategist, who wrote the report and developed the research methodology. “These App Economy jobs didn’t exist 8 years ago.”
“Most European policymakers and regulators don’t have a good grasp of the importance of App Economy employment,” says Michael Quigley, director of PPI’s European office in Brussels. “The latest election results tell us that voters don’t want more regulation–they want a chance to participate in New Economy growth.”
App Economy employment includes jobs involved with building, maintaining, and supporting mobile apps, plus a conservative estimate of spillover jobs. These jobs are estimated using a methodology based on analyzing the universe of online jobs postings.
PPI recently announced the opening of an office in Brussels to serve as its European base, a sign of its commitment to strengthening the transatlantic dialogue between the U.S. and our European partners on data-driven innovation, competition policy, trade, taxation and other issues at the center of the transatlantic relationship.
Google’s decision to pause its roll-out of Google Fiber to new cities is an important data point in our understanding of both the economics of telecom and the economics of innovation. The announcement said that:
In terms of our existing footprint, in the cities where we’ve launched or are under construction, our work will continue. For most of our “potential Fiber cities” — those where we’ve been in exploratory discussions — we’re going to pause our operations and offices while we refine our approaches.
Google should be applauded for its willingness to take a chance on laying fiber to the home—such big bets are the only way that innovation happens. Too many companies around the world choose to play it safe and avoid putting money into “moonshots.”
However, Google’s move emphasizes that telecom infrastructure investments cost big money and are risky. A company with one of the deepest pockets in the world—and a long-established willingness to innovate—has been forced to reassess its strategy. Advocates such as Susan Crawford have claimed in the past that the roll-out of Google Fiber proves that it is “cost-effective to install and sell fiber connectivity.” But by the same token, Google’s pause confirms that gigabit networks to the home are expensive, as incumbent providers have been saying, and not yet a winning proposition for most consumers.
Regulators need to remember that telecom infrastructure investments are not only large, but carry significant technological and business risk. Major telecom providers such as AT&T, Verizon, and Comcast have been at or near the top of our “Investment Heroes” list year after year precisely because they are willing to take those risks. And the risks will only get larger. No one is sure yet the best way to connect fiber backbones to homes and businesses, and what the business model will look like. For example, will fixed 5G networks be the best way to bridge the “last mile” to the home? It’s tough to say, given that the technical standards have not yet been set. A wrong bet could lead to billions of dollars in losses.
But there’s a broader point as well about size and innovation. Economists have long debated whether large companies or small companies contribute more to innovation. As a general rule, the answer is “it depends.” As we wrote in our policy memo, “Scale and Innovation in Today’s Economy”:
the current U.S. economy is dealing with a particular set of conditions that will make scale a positive influence on innovation. First, economic and job growth today are increasingly driven by large-scale innovation ecosystems, ….These ecosystems require management by a core company or companies with the resources and scale to provide leadership and technological direction. This task typically cannot be handled by a small company or startup.
Second, globalization puts more of a premium on size than ever before. A company that looks large in the context of the domestic economy may be relatively small in the context of the global economy. In order to capture the fruits of innovation, U.S. companies have to have the resources to stand against foreign competition, much of which may be state supported.
Finally, the U.S. faces a set of enormous challenges in reforming large-scale integrated systems such as health, energy, and education. Conventional venture-backed startups don’t have the resources to tackle these mammoth problems. Only large firms have the staying power and the scale to potentially implement systemic innovations in these industries.
These considerations raise certain questions about how regulators—in the US, Europe, and Japan—should think about the role of scale. Scale by itself should not be viewed an impediment to innovation. Small firms are essential to innovation, but big firms have an essential role to play as well.
Opponents of trade and trade agreements like the Trans-Pacific Partnership (TPP) often frame the trade debate as a battle between “the elites” and average Americans, especially American workers.
Trade skeptics charge that America’s pursuit of rules-based, open trade is essentially an exercise that’s by and for big multinationals and the Wall Street one percent, while leaving everyday American workers holding the bag. Critics like Donald Trump and Bernie Sanders claim that Americans would be better served by upending trade pacts like NAFTA, scrapping proposed deals like the TPP, and jacking up tariffs—including Trump’s proposed duties of 45 percent on Chinese imports and 35 percent on goods from Mexico. These tactics, they argue, would pressure trade partners and U.S. multinationals and “bring back” American jobs
But would a shift toward protectionism really help the 99 percent? Would such policies support more and better jobs for middle class workers? Guarantee a more prosperous and inclusive economic future for everyday Americans? If not, what policies would?
All around the world we are seeing the rise of the App Economy— jobs, companies, and economic growth created by the production and distribution of mobile applications (“apps”) that run on smartphones. Since the introduction of the iPhone in 2007, the App Economy has grown from nothing to a powerful economic force that rivals existing industries.1
In this paper we examine the production and distribution of mobile apps as a source of growth and job creation for Colombia. We find that Colombia had over 83,100 App Economy jobs as of September 2016, including a conservative estimate of spillover jobs. What’s more, Colombia’s connectivity with the global economy, particularly the United States, gives the country the potential to add many more App Economy jobs in the near future.
Going forward, Colombia has several important advantages in positioning itself as a hub for domestic and export app development. Colombia benefits from a growing economy in a time of economic volatility in the region. For 2015, Colombia showed annual growth of 3.1 percent, while the overall Latin American economy contracted. This is a slowdown compared to the growth Colombia experienced in years 2010-2014, due in large part to external factors: the decrease in global demand, particularly from China; and falling oil prices, with petroleum accounting to nearly half of the country’s total exports.3 Growth is expected to slow further in 2016, with economic and political uncertainty, including the ongoing peace process and tax reform.
Suppose you were counselling your college-age child about what fields to consider. Where would you tell them to start?
The short answer: Tech and health. Just look at the numbers: Since 2007, when the current tech boom started, employment in computer and mathematical occupations–including software developers and network administrators–has grown by more than 900,000 jobs. Employment in healthcare occupations–including physicians, nurses, skilled medical technicians, and support occupations–has risen by almost 1.9 million jobs. Everything else: Zilch.
The technology revolution has delivered Google searches, Facebook friends, iPhone apps, Twitter rants and shopping for almost anything on Amazon, all in the past decade and a half.
What it hasn’t delivered are many jobs.
Here’s my problem with their conclusion: The authors restricted themselves to looking at employment at tech companies, and tech industries as defined by the BLS. That makes sense if we think about tech like it was a manufacturing industry, where the jobs are concentrated in factories that can be easily tracked by government statisticians.
However, a large number of jobs created by the tech boom are outside the tech industry, and indeed, outside the conventional tech hubs. Instead, many people working in IT are in mining, transportation, government, finance, education, media, healthcare, and retail. The tech boom has spread across the entire economy, lifting employment far from Silicon Valley.
Some of these computer and mathematical occupation jobs are related to the App Economy, which we have discussed elsewhere. Indeed, creating and maintaining mobile apps has become a significant source of employment for the US and other countries. This includes ensuring the cyber security of mobile apps, which is increasingly important for banks and other companies that are worried about being hacked. These jobs are only going to grow.
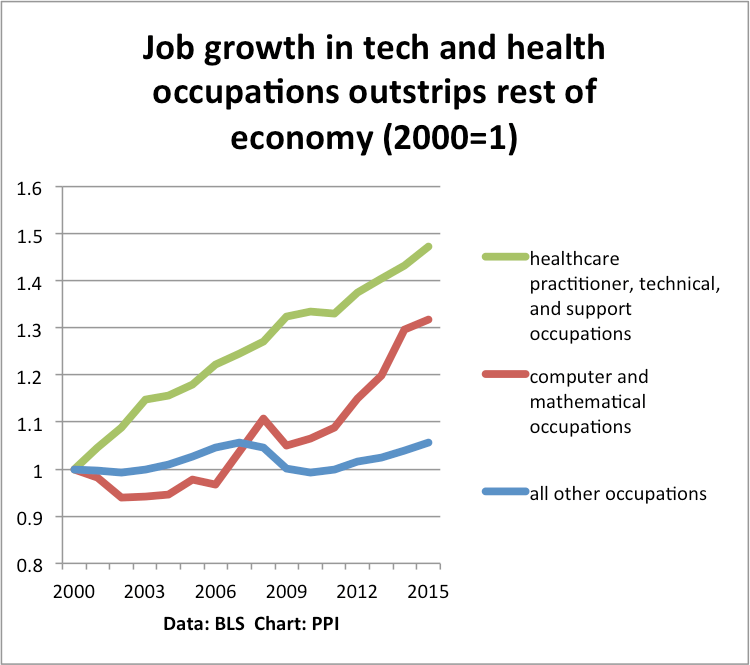
Here’s a chart that puts job growth into three buckets: computer and mathematical occupations; healthcare practitioner, technical, and support occupations; and all other occupations. We see that since 2000, computer and mathematical occupations are up 32%, and healthcare occupations are up 47%. Everything else? Only a 5% gain.
What if we start from 2007, when the current tech boom really took off, propelled by Apple’s introduction of the iPhone and the mobile revolution? Since 2007, employment computer and mathematical occupations is up 27%, and jobs in healthcare occupations is up 18%. Meanwhile, the rest of the economy has produced no net new jobs at all.
So, of course that number is heavily influenced by the job losses in maufacturing production workers. What if we just focus on managers? Even there, the growth has been much faster in tech and health. Since 2007, the number of computer and information systems managers is up 40%. The number of medical and health services managers is up 19%. For all other types of managers, the growth is only 8%, or only 1% per year.
Now, there are all sorts of reasons to worry if these trends will continue. The tech boom could come to an end, pressures on health care costs could slow job growth. But at least for now, if your kid is looking for growth sectors, tech and health are the name of the game.