FACT: 32 of the world’s 100 tallest buildings to open by the end of 2028.
THE NUMBERS: World’s tallest building by date* –-
| 2028? | 3,281 feet (Jeddah Tower, Saudi Arabia) |
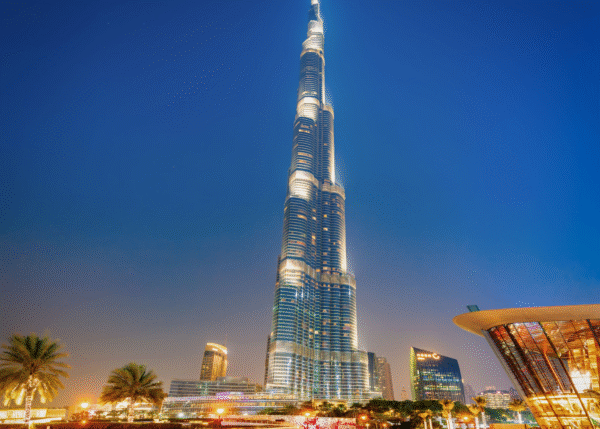
| 2010 | 2,716 feet (Burj Khalifa, UAE) |
| 2004 | 1,666 feet (Taipei 101, Taipei) |
| 1998 | 1,482 feet (Petronas Towers, Kuala Lumpur) |
| 1974 | 1,450 feet (Sears Tower, Chicago; now “Willis Tower”) |
| 1972 | 1,368 feet (World Trade Center, New York) |
| 1931 | 1,250 feet (Empire State Building, New York) |
| 1930 | 1,046 feet (Chrysler Building, New York) |
| 1913 | 792 feet (Woolworth Building, New York) |
| 1908 | 612 feet (Singer Building, New York) |
| 1901 | 548 feet (City Hall, Philadelphia) |
| 1311 | 525 feet** (Lincoln Cathedral, U.K.) |
| ~2550 BC: | 481 feet (Great Pyramid, Egypt) |
* Council on Tall Buildings and Urban Habitat. Their list doesn’t count free-standing towers like the 555-foot Washington Monument (1884), the 986-foot Eiffel Tower (1889), or the Great Pyramid. The Lincoln Cathedral’s height is a modern best guess, as the original spire fell down in 1548.
WHAT THEY MEAN:
Having topped 100 floors last month, the Jeddah Tower on the Arabian coast will add 67 more by its mid-2028 opening date. At exactly a thousand meters (3281 feet), it will overtop the world’s current tallest building (Burj Khalifa on the other side of the peninsula in Dubai, which has held the “tallest building” title for 16 years) by 172 meters. For context, the Mt. Everest peak is about 3600 meters above the Tibetan plateau. A rundown on giant buildings:
(1) 53 in mainland China, 3 in Hong Kong. In 1980, mainland China’s tallest building was the Shanghai Exhibition Center, at a meager 361 feet or 115 meters. Now China is home to 46 of the world’s 100 tallest buildings, and five of the top ten. At the very top, the Shanghai Tower (2015, 2073 feet) joins Merdeka 118 in Kuala Lumpur, Burj Khalifa, and the Makkah Royal Clock Tower among the four officially recognized “mega skyscrapers” (i.e., buildings above 1,968 feet). Hong Kong currently has another five, though two will drop off the bottom of the list by 2028.
(2) 13 in the United Arab Emirates, including the top-ranked Burj Khalifa. If you count by cities rather than countries, Dubai will be the world leader with 15, followed by Shenzhen’s 12, New York’s 9, and Shanghai’s 7.
(3) 10 in the United States. The Council’s lists go back to 1890, just before America’s urban skyscraper boom. That year’s top 100 featured 20 American buildings, topped by the Illinois State Capitol at #23. Thus, the current U.S. share looks like the lowest since the mid-19th century. As of 2028, all 10 of the U.S. top-100 entries will be in New York and Chicago; One World Trade Center will rank 8th at 1,776 feet. The American skyline’s rise and (relative) eclipse:
Year U.S. Top-100 Building Count
2028 10
2024 14
2020 14
2010 29
2000 47
1990 87
1950 91
1930 89
1900 38
1890 20
If it’s a consolation, though the American skyline may no longer tower over its rivals, the U.S.’s intellectual role in skyscraper design and construction remains large. Chicago-based Adrian Smith & Gordon Gill handled architectural design for both the Jeddah Tower and Burj Khalifa. (They seem cost-effective: the J.T. is supposed to cost $1.2 billion, only twice the $600 million estimate for the Trump administration’s “ballroom.”) New York-based Leslie E. Robertson Associates has the world’s most ambitious concept piece, though it seems unlikely to get built: a 5,700-foot “Sky Mile Tower” in Tokyo, nearly twice as high as Jeddah Tower and burying every conceivable competitor.
FURTHER READING
PPI’s four principles for response to tariffs and economic isolationism:
- Defend the Constitution and oppose rule by decree;
- Connect tariff policy to growth, work, prices and family budgets, and living standards;
- Stand by America’s neighbors and allies;
- Offer a positive alternative.
New York’s Council on Tall Building and Urban Habitat lists the world’s 100 tallest buildings from 2026 back to 1890.
Now:
The Jeddah Tower.
Burj Khalifa, record-holder since 2010, has 160 floors, a spiral shape to minimize upper-story wind torque, and specialized glass and heat-resistant glazed aluminum/stainless steel cladding on the outer walls.
Malaysia’s Merdeka 118 ranks second.
New York’s One World Trade Center (2014) is currently the world’s 7th-highest building at 1776 feet, and likely 8th in 2030.
And the ‘vision’ outline of the imaginary Tokyo Sky Mile Tower. On a clear day, a viewer on the top floor could see Mt. Fuji 62 miles away.
Then:
A brief survey of tall-building record-holders and techniques —
1. Pyramids & Ziggurats: The 481-foot Great Pyramid outside Cairo held the world’s tallest record for 3,800 years. Not just a lame pile of rocks, it is a “smart pyramid” with a complex interior network of chambers, tunnels, and ventilation shafts meant for ceremonial, religious, and astronomical purposes. All point to sophisticated, though unrecorded, ancient Egyptian architectural drafting and engineering capacity. Since the Council limits its top-100 lists to some sort of occupancy beyond “single corpse,” neither pyramids nor free-standing towers like the Eiffel make the cut. But if they did, the G.P. would have held the record for nearly 3,000 years, and remained in the top 10 as late as 1900. The slightly younger ziggurats in neighboring Sumer and Akkad were made of brick, a squishier material, and topped out at around 170 feet.
2. Cathedrals: Designed without printing presses, standardized weights and measures, or mathematics beyond flat-plane geometry, cathedrals got started in the 11th century and overtook pyramids by 1310. Contemporary comment:
“It was as though the world had shaken herself and cast off her old age, and clothed herself everywhere in a white garment of churches…”
Except for Philadelphia’s City Hall (548 feet, 1901) and Turin’s Mole Antonelliana (originally meant as a synagogue, but opened as a Risorgimento civic building in 1890), cathedrals remain the world’s tallest stone on stone buildings. The Ulm Munster (1890) is the tallest existing one.
3. Skyscrapers: As noted above, stone buildings can’t get much above 500 feet, since the weight of the upper tiers will crack the load-bearing pillars and walls beneath. Steel-skeleton buildings with curtain walls designed in Chicago and New York — blueprints, slide rules, etc. — solved the height problem, while the Otis hydraulic elevator system settled the 50-story-climb-to-the-top challenge. The Empire State Building, looking ahead to its 2031 centennial, has a retrospective.
ABOUT ED
Ed Gresser is Vice President and Director for Trade and Global Markets at PPI.
Ed returns to PPI after working for the think tank from 2001-2011. He most recently served as the Assistant U.S. Trade Representative for Trade Policy and Economics at the Office of the United States Trade Representative (USTR). In this position, he led USTR’s economic research unit from 2015-2021, and chaired the 21-agency Trade Policy Staff Committee.
Ed began his career on Capitol Hill before serving USTR as Policy Advisor to USTR Charlene Barshefsky from 1998 to 2001. He then led PPI’s Trade and Global Markets Project from 2001 to 2011. After PPI, he co-founded and directed the independent think tank ProgressiveEconomy until rejoining USTR in 2015. In 2013, the Washington International Trade Association presented him with its Lighthouse Award, awarded annually to an individual or group for significant contributions to trade policy.
Ed is the author of Freedom from Want: American Liberalism and the Global Economy (2007). He has published in a variety of journals and newspapers, and his research has been cited by leading academics and international organizations including the WTO, World Bank, and International Monetary Fund. He is a graduate of Stanford University and holds a Master’s Degree in International Affairs from Columbia Universities and a certificate from the Averell Harriman Institute for Advanced Study of the Soviet Union.