FACT: The Port of Baltimore handles 10% of U.S. vehicle trade and 94% of Ethiopian birdseed imports.
THE NUMBERS: Arrivals of Ethiopian “noug” imports, 2023 –
| Port of Baltimore: | 7,095 tons |
| Port of New York: | 429 tons |
| All other: | 6 tons |
WHAT THEY MEAN:
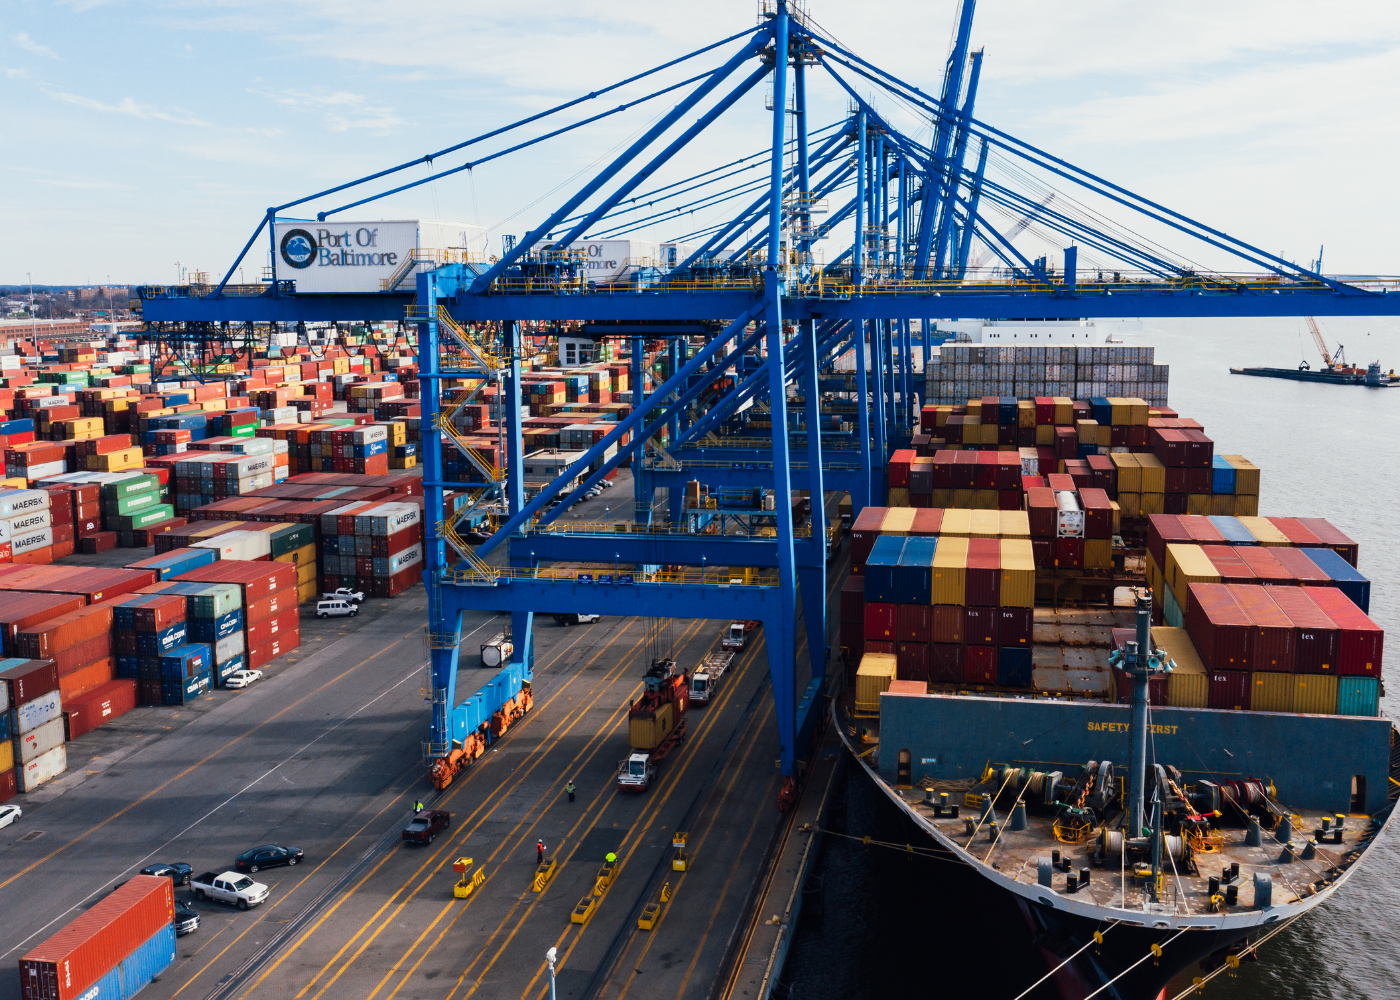
Last week’s destruction of the Key Bridge over the Patapsco River, after the 300-meter container ship Dali lost power and collapsed the main pier, closes the Port of Baltimore except for a temporary channel allowing barges and tugboats to enter and leave. The accident’s direct impact on the city’s economy will pretty certainly be its most important economic effect, and the loss of six construction workers’ lives its central human impact. The event also, though, is a bit of a stress test for American “supply chain resilience,” given Baltimore’s place as a large and especially versatile seaport. Some data, and a small-scale illustration of the way these events can touch people close to home and very far away:
America’s annual maritime commerce flows total, per NOAA, 2.3 billion tons of cargo and a symmetrical $2.3 trillion worth of trade. These big numbers, equivalent to about 8% of GDP and 43% of all U.S. trade flows, are distributed across 208 American ports handling over 250,000 tons of cargo a year. (With some left over for another 100 or so smaller border-crossings.) Baltimore’s 308-year-old port ranks in the top 25 on three different metrics — total cargo flow, dry bulk, and container transits — and handles about 2500 ship calls a year, with 50 million tons of cargo valued at $80 billion. Its particular specialization is automotive trade, with 750,000 annual incoming and outbound vehicles, but like other big ports it manages a very wide spectrum of consumer goods, natural resources, farm products, and more. As the wrecked Dali continues to block most ship transits, groups accordingly reworking their logistical arrangements range from manufacturers of half the 10,000 tractors Americans sell to Australian farmers and miners each year; to executives in electronics and automotive plants using the port for half of the U.S.’ 10,300 tons of matte cobalt arriving from Norway, Japan, and Madagascar annually; and on to garden-shop operators buying seed for nesting bluebirds and goldfinches this spring. A bit more on this last:
The relevant seed — known as Guizotia abyssinica to botanists, “noug” to Ethiopian farmers, and “niger seed” or the trademarked “Nyjer” for garden supply stores — is a small, thin black seed produced by a bright yellow flowering plant. Native like coffee to upland Ethiopia, noug has been harvested on the plateau for millennia as a source of cooking oil, with “a nutty flavor and pleasant odour and outraking sesame as Ethiopia’s most widely cultivated oilseed. About 800,000 upland farmers in Amhara and Oromia grow and harvest 300,000 tons each year. Biologically, its small size and high oil content make it attractive to popular and brightly colored U.S. songbirds such as the goldfinches and indigo bunting (reasonably but not precisely considered a bluebird*), millions of which will fly in from their winter homes in Mexico and the Caribbean for nesting this week. Hoping to attract them to backyard feeders, American bird enthusiasts purchase about 15,000 tons of noug from garden-shop operators for the past two decades. An Addis Ababa correspondent explains:
“Ethiopia uses the Niger seed for oil extraction for human consumption/cooking oil. A few years back some traders from Singapore, USA and Europe discovered the availability of this product and started to buy from Ethiopian exporters and ship it to the USA buyers. These USA buyers are major traders, by number not more than eleven. They have become the target for whomever wants to sell the Niger seed… We hear that Niger seed goes to the USA market for bird feed, which really amazes us because we know the product as for human consumption only.”
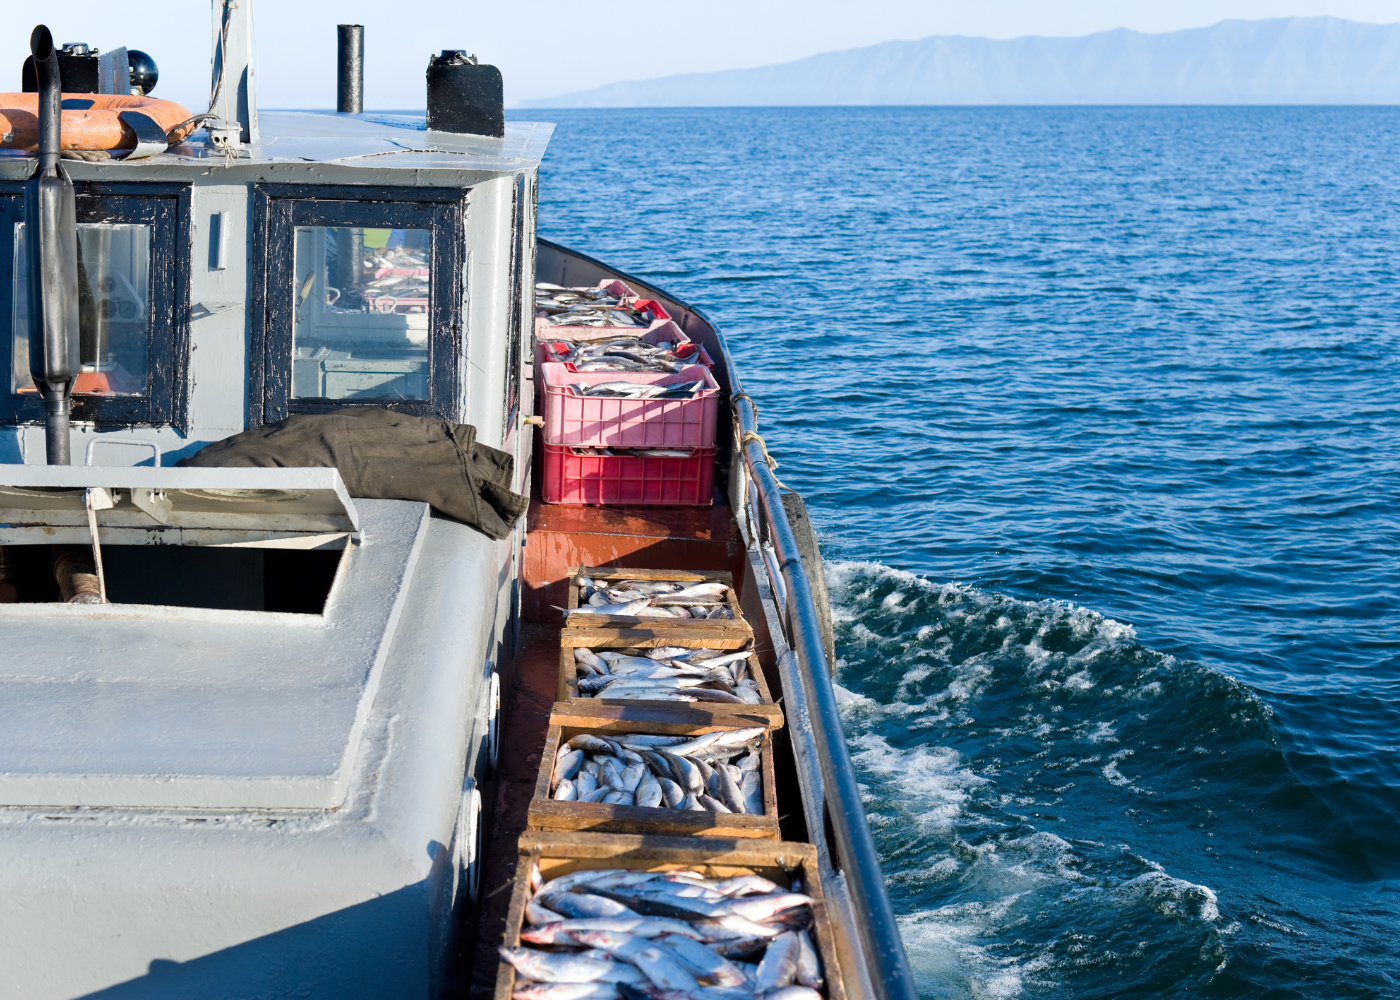
Exporting firms in Addis Ababa buy it from farmers in the field, sterilize and bag the seeds in 50-kilo sacks, and carry the sacks by truck or (since 2018) by rail to the Djibouti port — Baltimore’s partner in noug trade and the busiest Horn of Africa port. Last year’s exports earned Ethiopia $9.4 million. About 40% of each year’s annual shipments arrive in April and May, and about 94% of it — 7,095 of 7,530 tons last year — crosses Baltimore’s dry bulk dock. Shippers and garden shops are presumably looking hard for new paths, with their success — like that of their counterparts in autos, electronics industries, coal, metals, and more — one small test of the American economy’s flexibility and “resilience,” as well as something important in its own right for the livelihoods of East African farmers and this spring’s bluebird nesting.
* Ornithologically, the eastern U.S. is home to two bright-blue birds, the indigo bunting and the “bluebird” per se. Male buntings are blue all over and females a more modest brown; among bluebirds, both males and females are blue (though females are more grayish-blue), with a brownish breast. Current population counts estimate about 75 million buntings and 23 million bluebirds.
FURTHER READING
Ports:
The Port of Baltimore.
… Mayor Scott updates Baltimoreans.
NOAA summarizes U.S. port stats.
The Department of Transportation looks at 2024 U.S. port performance.
… focuses in on Port of Baltimore.
… and outlines what’s next in Bipartisan Infrastructure Act port investment.
Wreck:
Ship tracker “Vesselfinder” has basics – size, deadweight tonnage, previous port calls – on the Dali.
Auto industry execs predict that they can manage the port closure without too much trouble.
Noug and Buntings:
The Ethiopian Pulses, Oilseeds, and Spices Processors Exporters Association pitches Ethiopian specialty produce exports.
USDA on the Ethiopian oilseed economy.
Oregon State University explains Ethiopia’s status as one of the world’s eight “Vavilov Centers”, with especially diverse crops.
NIH evaluates noug and its nutritional benefit.
The Audubon Society explains its appeal to birds.
… and updates you on the relatively healthy indigo bunting population.
And the Port Authority of Djibouti, including a look at the 2018 opening of a rail link to Addis financed by the Djibouti and Ethiopian governments and the Chinese Ex-Im Bank.
ABOUT ED
Ed Gresser is Vice President and Director for Trade and Global Markets at PPI.
Ed returns to PPI after working for the think tank from 2001-2011. He most recently served as the Assistant U.S. Trade Representative for Trade Policy and Economics at the Office of the United States Trade Representative (USTR). In this position, he led USTR’s economic research unit from 2015-2021, and chaired the 21-agency Trade Policy Staff Committee.
Ed began his career on Capitol Hill before serving USTR as Policy Advisor to USTR Charlene Barshefsky from 1998 to 2001. He then led PPI’s Trade and Global Markets Project from 2001 to 2011. After PPI, he co-founded and directed the independent think tank ProgressiveEconomy until rejoining USTR in 2015. In 2013, the Washington International Trade Association presented him with its Lighthouse Award, awarded annually to an individual or group for significant contributions to trade policy.
Ed is the author of Freedom from Want: American Liberalism and the Global Economy (2007). He has published in a variety of journals and newspapers, and his research has been cited by leading academics and international organizations including the WTO, World Bank, and International Monetary Fund. He is a graduate of Stanford University and holds a Master’s Degree in International Affairs from Columbia Universities and a certificate from the Averell Harriman Institute for Advanced Study of the Soviet Union.