2021: 69 garments, 7.4 pairs of shoes; 2.6% of family budgets
2000: 66 garments, 6.6 pairs of shoes; 4.9% of family budgets
1991: 40 garments, 5.4 pairs of shoes; 5.9% of family
1972/3: 28 garments, shoes n/a (3 to 4 pairs?); 7.8% of family budgets
* Purchasing totals from American Apparel & Footwear Association; budget share from BLS Consumer Expenditure Survey. As noted below, the 1972/3 survey (like other pre-1991 Consumer Expenditure surveys) was a two-year composite.
A look at affluence through a couple of shopping stats:
(1) According to the American Apparel & Footwear Association, American families bought 69 garments and 7.4 pairs of shoes in 2021. And
(2) the Bureau of Labor Statistics “Consumer Expenditure Survey” (“CEX”), which has tracked spending on these items for 121 years, reports that in that year the average family spent $1,754 on this wardrobe upgrade, which was about 2.6% of their year’s total $66,928 budget.
To scroll back through a half-century of CEX archives* is to see, as time passes, these life necessities taking up steadily smaller shares of family spending as the vanished exotic world of the early 1970s (black-and-white TV, AM radio, phone booths, energy crises, smoky air) evolved into 2020s America. Changes in logistics, retail practices, and trade policy (computer networks, on-line shopping, and big-box stores; goods carried in slow and small break-bulk shipping rather than large-scale container lines; emergence of large light-manufacturing industries in Asia, Latin America, and Africa; elimination of a complex clothing import-quota system and some tariff-cutting mainly in luxury goods) mean that annual clothing and shoe spending in dollar terms has barely changed even as incomes rose, inflation nibbled at dollar value, and mall trawls and on-line shopping binges returned larger and larger sacks of shirts, shoes, socks, brassieres, etc. The figures look like this:
2021: 2.6% of family budget ($1,754 of $66,298)
2011: 3.5% of family budget ($1,740 of $49,705)
2006: 3.9% of family budget ($1,835 of $48,398)
2001: 4.4% of family budget ($1,743 of $39,518)
1991: 5.9% of family budget ($1,735 of $29,614)
1984/5: 6.0% of family budget ($1,319 of $21,975)
1972/3: 6.8% of family budget ($565 of $8,270)
* The 1972/1973 and 1984/1985 editions are two-year surveys. Regular annual CEX’s begin in the late 1980s.
Thus Americans (a) buy about twice as many garments and pairs of shoes as their grandparents did 50 years ago but (b) have cut their budgets for these products by almost two thirds. This is the equivalent of shifting about 4.2% of family spending in 2021 –$2,800, the equivalent of two weeks’ worth of income — away from necessities and toward savings, education, entertainment, and so on. On a shorter scale since 2001, the shift is about 1.8% of spending, or about $1,200.
The families most in need of help — single parents — see slightly larger benefits from this evolution than wealthier households. The CEX reports show that in 2021 the 9 million single-parent families spent an average of $49,811 to spend, with $2,254 or 4.5% of the family budget** used for shoes and clothes. These figures don’t go back quite as far as whole-family reports, but the comparable single-parent figure was $1,763, or 8.1% of a $21,653 budget, on shoes and clothes; thus single parents have been able to re-purpose about 3.6% of their budget.
Note: PPI staff thanks the AAFA for providing the figures on shoe and apparel purchasing, and BLS Consumer Expenditure Survey staff for quick and efficient help in sending archived CEX surveys.
Data:
The homepage for the Bureau of Labor Statistics’ Consumer Expenditure survey.
Trade policy summary:
To what extent does “trade policy,” in the sense of negotiations and agreements, deserve credit for these falling costs? Two background points:
(1) Shoe and clothing tariffs have changed little over time, having been excluded from tariff reductions in the GATT agreements of 1969 (“Kennedy Round”), 1974 (“Tokyo Round”) and 1993 (“Uruguay Round”). The main change is that a “quota system” regulating in extraordinary detail the number of sweaters, socks, towels, etc. countries could send to the U.S., introduced by the Nixon administration in 1974, came to an end in 2004.
(2) Since 1983, Congress along with the Reagan, Bush, and Clinton administrations developed a series of “preference” programs for clothing and passed a set of Free Trade Agreements, which together removed tariffs from $17 billion of the U.S.’ $102 billion in clothing imports in 2021, and a very modest $0.9 billion of $27.2 billion in shoe imports.
The end of the quota system likely had a large price effect; those of the FTAs and preferences were smaller, but not zero. Tariffs on lower-priced clothes and shoes continue to be the big sources of tariff money, accounting for about half of the permanent tariff system but a lower share of overall tariff revenue since the Trump administration. PPI’s Ed Gresser on the tariff system’s regressive nature, and its ineffectiveness as a job or production protector.
The really big picture:
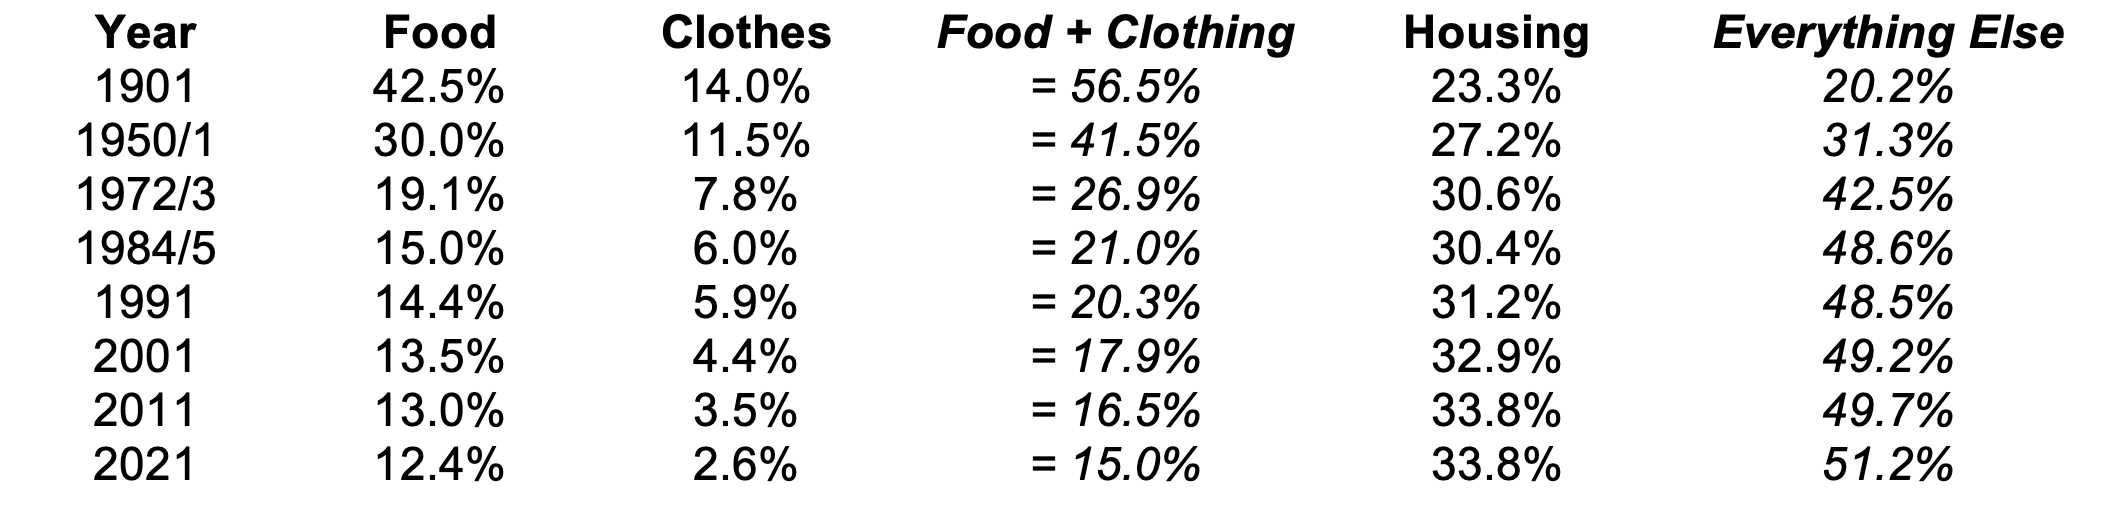
The Consumer Expenditure Survey is one of the world’s oldest continuous social-science surveys, launched in 1888 by the otherwise unmemorable administration of Benjamin Harrison. In 2006, the BLS reprinted the core data from the surveys of 1901, 1936, 1950, 1960, 1972/73 and 1984/1985. Their long look back finds that in times remembered as opulent, sunny and calm — the Gilded Age, the post-war boom, the New Frontier, etc. — Americans lived pretty close to the bone. The three big necessities — food, shelter, and clothes — ate up four-fifths of family income a hundred years ago, and over two-thirds in the 1950s.
Food costs, a gigantic share of family budgets a century ago, fell by half from 1900 to 1970, and by another third since. Clothing costs have drifted steadily down with postwar trade opening and logistical innovation, halving from 1950 to 1980, and then halving again since. Spending on housing, meanwhile, has steadily risen* – 23.3% in 1901, 30.6% in 1972, 32.9% in 2001, 33.8% in 2021 — eating away some of the benefits of lower food and clothing costs. Only until quite recently, however, have the three big life necessities — food, shelter, and clothing — fallen below half of a typical family’s budget. A summary of budget shares for all households over 121 years:
BLS’ long look back at a century of consumer spending.
* The CEX includes home furnishings, utilities, repairs, and laundry services in its “housing” category, so this goes beyond rent and mortgage payments. The available services before 1984 also include these payments, but unlike the post-1991 series does not separate them out. So the table above uses the larger category, which includes some discretionary spending going beyond the ‘roof over the head’ necessity.
Ed Gresser is Vice President and Director for Trade and Global Markets at PPI.
Ed returns to PPI after working for the think tank from 2001-2011. He most recently served as the Assistant U.S. Trade Representative for Trade Policy and Economics at the Office of the United States Trade Representative (USTR). In this position, he led USTR’s economic research unit from 2015-2021, and chaired the 21-agency Trade Policy Staff Committee.
Ed began his career on Capitol Hill before serving USTR as Policy Advisor to USTR Charlene Barshefsky from 1998 to 2001. He then led PPI’s Trade and Global Markets Project from 2001 to 2011. After PPI, he co-founded and directed the independent think tank Progressive Economy until rejoining USTR in 2015. In 2013, the Washington International Trade Association presented him with its Lighthouse Award, awarded annually to an individual or group for significant contributions to trade policy.
Ed is the author of Freedom from Want: American Liberalism and the Global Economy (2007). He has published in a variety of journals and newspapers, and his research has been cited by leading academics and international organizations including the WTO, World Bank, and International Monetary Fund. He is a graduate of Stanford University and holds a Master’s Degree in International Affairs from Columbia Universities and a certificate from the Averell Harriman Institute for Advanced Study of the Soviet Union.
Read the full email and sign up for the Trade Fact of the Week

