PPI’s Ben Ritz, Director of the Center for Funding America’s Future, released the following statement about the omnibus spending package:
Once again, Congress has waited until the last minute to carry out its most basic responsibility: funding the federal government’s normal operations. Thanks to a combination of brinkmanship and procrastination by leaders on both sides of the aisle, lawmakers will soon be forced to choose between voting for roughly $1.7 trillion of spending with little time to review legislative text or shutting down the government. This is no way to run a country.
The omnibus appropriations bill increases federal discretionary spending next year at a rate faster than overall economic growth. Boosting fiscal stimulus is exactly what lawmakers should not be doing with inflation still running at over 7%. Instead, Congress should be pursuing a fiscal policy that supports the Federal Reserve’s efforts to rein in rising prices.
It’s disappointing that, despite the increase in overall spending levels, it appears appropriators have failed to fund federal R&D efforts at the targets authorized by the CHIPS and Science Act passed earlier this year. The omission of much-needed permitting reforms also will reduce the efficacy of infrastructure investments Congress passed earlier this session. Together, these decisions represent a setback for the restoration of bold public investment that this Congress had been on track to accomplish.
But the package could have been worse. With the exception of some retirement provisions that are offset by gimmicks, the omnibus is mostly free of deficit-financed tax cuts that usually ride on end-of-the-year packages such as this. Although it would have been best for negotiators to agree on a fiscally responsible compromise to restore the pre-2022 tax treatment of R&D expenses and some expansion of the Child Tax Credit, their decision to omit these policies rather than to further fuel inflation by borrowing to pay for them was the right one.
It’s also good news that the omnibus will strengthen democracy at home and abroad through improvements to the Electoral Count Act and additional military assistance to help the Ukrainian people stand up to Russia’s brutal war of conquest.
Perhaps the next Congress could notch another win for democracy by following a rational and transparent budget process next time around. That shouldn’t be too much to ask of America’s elected representatives.
President Biden began the year calling on Congress to pass stronger digital privacy protections for minors. Now, with just two weeks left in 2022, there is talk that the Senate is looking to fulfill that request by adding two major children’s online privacy and safety bills to the potential omnibus spending package.
Protecting young people online is a challenging task. Both digital privacy and content moderation have proven challenging in a legislative, constitutional, and technical context. Adding these bills to the omnibus spending package does not give the topics the due process and consideration they deserve. A better focus for Congress would be to pass universal privacy protections and then augment those protections with youth privacy and online safety rules.
Though the bills have different sponsors and come from different committees, together they address the two most important areas of online safety for children: privacy and child-appropriate content. One, the Children and Teens’ Online Privacy Protection Act, would protect the online privacy of anyone under 16 years old. The second bill, the Kids Online Safety Act (KOSA), is a youth content moderation bill that seeks to prevent young people from seeing harmful content on the websites they access.
The Children and Teens’ Online Privacy Protection Act is an update to the current children’s privacy regulation, the 1998 Children’s Online Privacy and Protection Act (COPPA). The current regulation is straightforward. It applies to companies knowingly handling data of youth under 13 years old. To comply with COPPA, firms must gain consent from parents before collecting children’s data and “implement reasonable procedures to protect the security” of that data. The Children and Teens’ Online Privacy Protection Act updates the current rules, taking into account the changes in the digital landscape in the last 25 years.
First, the new bill would increase the age requirement for parental consent to 16. Next, it limits the use of children’s personal data and adds privacy and security requirements for children’s data. The bill makes it illegal to show targeted ads to youth, adds a digital marketing bill of rights to limit data collection of minors, and requires platforms to create privacy dashboards for parents to see how sites use youth data.
As PPI has previously written, in its current form, COPPA has always been difficult to enforce because there is no easy way to check if a website user is under 13 years old. The new legislation, while providing pragmatic and relevant updates to the original text, risks not only reproducing that challenge, but increasing it because the Children and Teens’ Online Privacy and Protection Act applies to more young people. Instead, we advocate for universal privacy protections for all Americans that can be updated, as needed, for children.
The other bill under consideration is the Kids Online Safety Act. This bill follows California and the United Kingdom, both of which have passed youth content moderation protections. It applies to any online software with child users and can be broken down into three areas. First, a blanket duty of care for platforms to act in the best interest of minors using the site by demoting content that could be harmful to them. The bill defines harmful content as promoting eating disorders, self-harm, bullying, sexual exploitation of youth, or alcohol or addiction content. Next, it requires safeguards, or “parental controls,” on youth accounts. The controls would provide extra privacy, data, and content ranking settings. Finally, it requires audits from companies on their online safety risks and practices, gives the Federal Trade Commission enforcement powers, and establishes a Kids Online Safety Council to advise and implement the Act.
This bill gets a few things right. First, it defines a set of harmful content, making it easier for companies to know what is and isn’t covered. The requirement to add additional settings for parental control on individual online accounts is also valuable. It creates an easy opt-in tool for parents to better manage their children’s accounts.
The challenge is in the duty of care mandate. In theory, as long as platforms can demonstrate in their audits that they are taking appropriate steps to prevent youth from accessing harmful content, they will be safe from lawsuits. However, addressing content moderation is challenging. The First Amendment protects the right to freedom of speech with minimal exceptions, giving private companies a broad mandate to define what content is shown on their platforms. And many companies already go above and beyond in shielding all users from the content defined in KOSA.
Harmful content violates the terms and conditions of most platforms and is already moderated. Companies do their best to demote and remove videos included in the “harmful content” definition, but it is currently technically impossible to do this work with 100% accuracy. Content that is bullying or harassing can happen in real-time, like in chat rooms on video games. If a video game has users under 16, which many do, the company could censor certain words in the chat, but online language is constantly evolving and uses new abbreviations and emoji combinations to get around censorship.
It’s unclear what additional steps firms will need to take to comply with KOSA’s broad mandate. There are currently no enforceable age restrictions on the internet, meaning KOSA elicits the same enforcement challenges as COPPA. Some sites might choose to be more heavy-handed, such as restricting users under 16 from making accounts (as many sites now do for kids under 13 due to COPPA requirements), requesting proof of age when signing up, or moderating content, including user-generated content that depicts legal products for adults like alcohol and cigarettes, for everyone to protect youth.
There is little doubt that young people need protection from harmful internet content. The proposed bills are broad in scope, applying to any website, social media, video game, or app that connects to the internet. Without universal privacy protections for all Americans and with the First Amendment, as well as other challenges with internet content moderation, these bills may be difficult to enforce and face legal scrutiny. While they likely won’t alter the internet as we know it, more time is needed to see how these bills will impact platforms and content across the internet.
The stunning protests by average Chinese citizens against Xi Jinping’s disastrous Covid lockdowns may open the door not just to less restrictive Covid approaches, but to global outrage over an even more cataclysmic threat—China’s out of control greenhouse gas emissions that are destabilizing the global climate.
The latest protests in China are reminiscent not just of Tiananmen Square demonstrations in 1989, but also of the public outcry from 2013-2017 against China’s crippling air pollution. Those protests proved politically powerful enough to force at least some improvements in Beijing’s air quality, prompting new investments in clean energy and slight changes to China’s intensely polluting industrial economy.
Yet these mostly cosmetic actions have done little to slow planet-endangering greenhouse gas growth presided over by Xi. China’s yearly emissions are now more than 31% of the global total. That’s more than all emissions from the U.S. and every other developed country on earth combined. And unlike the U.S., EU and our allies who are spending hundreds of billions of dollars to deeply cut our greenhouse gases, China’s emissions are still rising.
New initiative will push investments for 21st century job training and upward mobility
Today, the Progressive Policy Institute (PPI)announced the launch of the New Skills for a New Economy Project, which seeks to promote bold and pragmatic workforce development policies that level the playing field for degree and non-degree workers and ensure greater upward mobility for all working Americans. The project will be led by Taylor Maag, Director of Workforce Development Policy at PPI.
“The New Skills for a New Economy Project comes at a critical time for workers in America – we face unprecedented workforce challenges and more and more working Americans, especially those without degrees, are feeling left behind. This project will develop innovative policy solutions to address these challenges and ensure workers excel in today and tomorrow’s economy.” said Taylor Maag, Director of Workforce Development Policy at PPI.
The New Skills for a New Economy Project will help shape policy discussions at the federal and state levels around investments in a robust workforce development system that is fully-funded, modern, industry-responsive, and equips current and future workers with the skills they need to get ahead. The project will promote policy solutions that address the current challenges facing workers’ success and help the U.S. remain competitive by lifting up new ideas and best practices happening across the country.
Learn more about the project by visiting the project’s website, and read more about the project’s goals here.
Taylor Maag is the Director of Workforce Development Policy at PPI. Prior to joining PPI, Taylor worked at Jobs for the Future (JFF) where she assisted in the development and implementation of JFF’s federal and state policy agenda, focusing on workforce reform and innovation, access and affordability in postsecondary education and federal poverty alleviation policy. Additionally, Taylor led JFF’s congressional and workforce-related practitioner networks to ensure federal policymakers were staying connected with leaders implementing innovative and successful strategies on the ground.
The Progressive Policy Institute (PPI) is a catalyst for policy innovation and political reform based in Washington, D.C. Its mission is to create radically pragmatic ideas for moving America beyond ideological and partisan deadlock. Learn more about PPI by visiting progressivepolicy.org.
On this week’s episode of the Mosaic Moment, Program Director, Jasmine Stoughton, sits down with Mosaic alum, Dr. Liz Wilke, to explore her new report, “Supporting Contractors’ Career Development in the Future of Work.” They discuss holes in the social safety net for both contractors and employees, the complexities of filing taxes as an independent worker, and how upskilling and career training could be the key to navigating our modern economy.
Today, the Progressive Policy Institute’s Innovation Frontier Project released a new report exploring the critical role contract workers play in this post-pandemic workforce, and the policies that will help provide support to this important workforce. The report is titled “Supporting Contractors’ Career Development in the Future of Work,” and is authored by Dr. Liz Wilke, Principal Economist at Gusto and cohort member of PPI’s Mosaic Project.
“Supporting contractors to continually invest in their skills, confidently and expertly manage their professional affairs, and ensure that they benefit from basic workplace protections available to employees can support this important segment of the workforce, ensure their long-term success, and enhance the benefits they bring to American businesses,” writes report author Liz Wilke.
Reliance on contract workers is expected to increase as 90% of companies expect to use them more in the future. The report looks at the rise of contract and gig workers in recent years and identifies some of the resources needed to sustain America’s growing workforce.
In addition to releasing the paper, Dr. Wilke and the Director of PPI’s Mosaic Project, Jasmine Stoughton, sat down to examine Dr. Wilke’s findings in a new “Mosaic Moment” podcast, a series on PPI’s Radically Pragmatic podcast. They discussed gaps in the social safety net for both contractors and employees, the complexities of filing taxes as an independent worker, and how upskilling and career training could be the key to navigating our modern economy.
Liz Wilke, PhD, is a Principal Economist at Gusto, researching the state of work and business in the modern economy. She is a veteran of both the technology and government sectors, where she directed research programs and public spending that supports dynamic, resilient companies and workers across the globe. Liz currently lives in Washington, D.C.
Based in Washington, D.C., and housed in the Progressive Policy Institute, the Innovation Frontier Project explores the role of public policy in science, technology and innovation. The project is managed by Jordan Shapiro. Learn more by visiting innovationfrontier.org.
The Progressive Policy Institute (PPI) is a catalyst for policy innovation and political reform based in Washington, D.C. Its mission is to create radically pragmatic ideas for moving America beyond ideological and partisan deadlock. Learn more about PPI by visiting progressivepolicy.org.
FACT: High-seas pirate attacks are at their lowest in 30 years.
THE NUMBERS:
High-seas pirate attacks –
2022:
120?
2012:
197
2002:
383
2000:
471
WHAT THEY MEAN:
From the International Maritime Bureau’s Piracy Reporting Centre, a three-party encounter two weeks ago a few miles off Cote d’Ivoire, with an unarmed South Korean oil tanker, a gang of pirates, and the Italian naval frigate Comandante Borsini:
“Owners [of an oil tanker] reported that they had lost communication. The International Maritime Bureau Piracy Reporting Centre broadcast a missing vessel message to all ships in the region to look out for the missing tanker. On November 25, 2022, the Master [i.e. captain of the tanker] contacted the owners and reported that eight armed pirates had boarded the vessel and destroyed all navigation and communication systems. The crew managed to retreat into the citadel. [A secure compartment of the ship, heavily armored.] An Italian navy warship later intercepted and rendered assistance to the vessel until a tow was arranged. All crew reported safe.”
And another one, a week ago Saturday, near Singapore:
“Six robbers armed with knives boarded a bulk carrier underway and entered the engine room. The robbers were spotted by the duty watchman, who immediately informed the bridge. Alarm raised and crew mustered. Seeing the crew alertness, the robbers escaped empty handed. Singapore Coast Guard boarded the vessel to investigate.”
The IMB has tracked pirate attacks like these since the early 1990s. Its 2021 report tallied 132 attacks and attempts, fewer than in any year since 1994. The 2022 figures are down again, to 90 over the year’s first nine months, suggesting a full-year total of about 120. The two events above are typical of the current reports: small groups of pirates, poorly armed in the Singapore Strait event, and quick responses by local or international naval patrols. A quick history and explanation of this unheralded success story:
The early 21st-century pirate boom began with the collapse of the Somali state in the 1990s. The aftermath of this event brought sequential waves of violent gangs, Islamic fundamentalist militias, international interventions, and more violent gangs, culminating in the creation of a large-scale organized pirate industry with little if any modern precedent. Absent a central authority capable of imposing laws, pirates converted a set of fishing trawlers into a kind of pirate fleet, each able to carry a handful of small speed boats from the coast into the nearby shipping lanes.
These are quite busy: the Red Sea, the Gulf of Aden, and the 16-mile-wide ‘Bab-el-Mandeb’ strait separating Somalia from Yemen are the principal commercial and energy link between Asia and Europe, with 50 ship transits and 3.4 million barrels of oil daily. And a big commercial tanker or bulk carrier is not a floating fortress — the typically unarmed crews numbered about 20 — and piracy became for a while lucrative. The speedboats, each carrying a small crew armed with automatic weapons and sometimes grenade launchers, would then attempt to board and capture a targeted commercial ship. At their peak in 2011, pirates captured 49 ships and held over 1,100 crew members for ransoms averaging $5 million. Economists at the time guessed at a global-economy damage figure of about $12 billion per year.
A decade later, international naval patrols have essentially eliminated the threat off Somalia, and greatly reduced the global incidence of piracy. The 29-country Red Sea naval patrol known as CTF-151 (“Combined Task Force 151”) began protecting ships in transit in 2009; the last two successful attacks on vessels off Somalia, both in 2017, are now five years in the past. Smaller similar patrols drawing on this experience, like the Comandante Borsini’s interception of the pirate group off Cote d’Ivoire last month, have also sharply cut back the less organized piracy industries in the Gulf of Guinea. (Though in that case, the pirates succeeded at least in holding up the crew for money.) The most frequent area for pirate attacks is now maritime Southeast Asia, the site of 48 of the 90 events reported in IMB’s 2022 tally.
FURTHER READINGS:
Some lowlights from the International Maritime Bureau’s report on pirate attacks this year:
Places:31 attacks in the Singapore Strait, 17 elsewhere in Malaysia and Indonesia, 12 in the Gulf of Guinea, 10 in the Caribbean, 8 off Peru, and 8 in the Bay of Bengal, and one apiece off South Africa, Liberia, Congo, and Angola.
Nature: 37 attacks against high-seas shipping, with one successful hijacking (also off Cote d’Ivoire) and four failed attempts, along with 48 attacks on ships in port, for a total of 85 boardings.
The International Maritime Bureau, noting the lowest piracy rate in a generation, hopes shipping companies and governments keep up the pressure.
Maritime Southeast Asia is this year’s highest-piracy region. The Singapore-based Information Sharing Center for the Regional Cooperation Agreement on Combating Piracy (RECAAP) reports incidents and oversees anti-piracy operations.
Naval links:
Command Task Force 151, led last year by Pakistan and this year by Brazil, patrols Somali waters.
Brookings Institution background on the origins of the Somali pirate industry.
A 2010 Transportation Department report reviews pirate threats to shipping and economies.
The U.S. Navy explains its (in retrospect, successful) plan.
And “Eye for Transport” estimates annual piracy costs for the world economy at $12 billion a decade ago, summing up ransom payments, higher insurance costs, the $2 billion in naval patrol budgets, and higher shipping costs as some companies route around Africa rather than risking the Bab el Mandeb transit, with Egypt losing most ($642 million) via falling Suez Canal revenues.
And a long look back:
The standard dates for the “Golden Age of Piracy” – Edward “Blackbeard” Teach, the unlucky Captain Kidd, the famous female pirates Anne Bonny and Mary Reade, master of the game Henry Avery – are 1650-1720 and spanned much of the world. Kidd’s very well-documented pirate voyage took him from Boston to London, then Madagascar and the Indian Ocean (where he unwisely targeted one of Emperor Aurangzeb’s ships), to the Caribbean. The Royal Maritime Museum in Greenwich has lots of good material.
For the big picture on pirate life, David Cordingly’s Under the Black Flag: The Romance and Reality of Life Among the Pirates.
And for a close-in, Robert Ritchie’s Captain Kidd and the War Against the Pirates zooms in on the life of William Kidd, with Indian Ocean and Caribbean misadventures, murky political associations in the Whig Party, and allegedly lost treasure.
ABOUT ED
Ed Gresser is Vice President and Director for Trade and Global Markets at PPI.
Ed returns to PPI after working for the think tank from 2001-2011. He most recently served as the Assistant U.S. Trade Representative for Trade Policy and Economics at the Office of the United States Trade Representative (USTR). In this position, he led USTR’s economic research unit from 2015-2021, and chaired the 21-agency Trade Policy Staff Committee.
Ed began his career on Capitol Hill before serving USTR as Policy Advisor to USTR Charlene Barshefsky from 1998 to 2001. He then led PPI’s Trade and Global Markets Project from 2001 to 2011. After PPI, he co-founded and directed the independent think tank Progressive Economy until rejoining USTR in 2015. In 2013, the Washington International Trade Association presented him with its Lighthouse Award, awarded annually to an individual or group for significant contributions to trade policy.
Ed is the author of Freedom from Want: American Liberalism and the Global Economy (2007). He has published in a variety of journals and newspapers, and his research has been cited by leading academics and international organizations including the WTO, World Bank, and International Monetary Fund. He is a graduate of Stanford University and holds a Master’s Degree in International Affairs from Columbia Universities and a certificate from the Averell Harriman Institute for Advanced Study of the Soviet Union.
The current Democratic trifecta is coming to a close, and Republicans will be taking back power in the House this January. The lame-duck Congress looks to be productive, but one item that fell shortmay come back to haunt Democrats.
Permitting reform — a push by Sen. Joe Manchin (D-WV) to change the way big infrastructure projects that involve federal dollars are approved — was a notably divisive proposal that supporters had hoped would pass in the lame duck. On December 15, the Senate, in a 47-47 vote, rejected a bid to add the measure as an amendment to a must-pass defense bill. It was a personal loss for Manchin but a potentially bigger one for a key Democratic priority: building out a clean energy infrastructure, and fast.
Will Marshall, President of the Progressive Policy Institute, released the following statement following the news that Kyrsten Sinema is registering as an independent:
“After ceaseless attacks by left-wing ideologues, it’s no surprise that Kyrsten Sinema has become the U.S. Senate’s third independent. Rather than follow Republicans down the rabbit-hole of extremism and ideological conformism, the Democratic Party should be a welcoming place for elected leaders who think for themselves. To build solid majorities and break the stalemate in American politics, Democrats need to expand their coalition, not shrink it.”
The Progressive Policy Institute (PPI) is a catalyst for policy innovation and political reform based in Washington, D.C. Its mission is to create radically pragmatic ideas for moving America beyond ideological and partisan deadlock. Learn more about PPI by visiting progressivepolicy.org.
Malena Dailey, PPI’s Technology Policy Analyst, released the following statement in reaction to recent reports that the Open App Markets Act has been attached to the Senate’s proposed omnibus funding bill:
“As the House and Senate deliberate this year’s omnibus bill, PPI urges Congress to exclude the Open App Markets Act from the legislation. The Open App Markets Act attempts to encourage competition for app developers, but does so at the expense of consumers, compromising both the security of the devices we use everyday and the ability for customers to choose the type of software that best fits their needs.
“From mobile phones to more general smart devices, unique app stores have become a standard for consumer tech products. While some operating systems allow for downloads from third-party app stores or the internet, others prioritize security in their products by only allowing users to go through a designated, secure payment system for pre-approved apps. By mandating every operating system to follow the same business model, Congress takes this choice away from consumers, potentially exposing users to unnecessary security risks. We urge Congress to put consumer choice first and exclude the bill in the Senate omnibus package.”
Read Malena Dailey’s February 2022 analysis on the harms of the Open App Markets Act here.
The Progressive Policy Institute (PPI) is a catalyst for policy innovation and political reform based in Washington, D.C. Its mission is to create radically pragmatic ideas for moving America beyond ideological and partisan deadlock. Learn more about PPI by visiting progressivepolicy.org.
It was inspiring to watch a scrappy U.S. men’s soccer team battle mighty England to a 0-0 draw in the World Cup’s first round. But let’s face it: Americans have little use for moral victories — we want to score and win.
It’s time we applied that principle to our national politics. Since 2000, the competition between Democrats and Republicans for governing power has been stuck in a virtual tie. Tenuous control of the White House and Congress keeps oscillating back and forth because U.S. voters are reluctant to entrust either party with a big or lasting majority.
When neither party can win a popular mandate for change, it’s hard for our country to make sustained progress in any direction. American democracy seems trapped in a political doom loop of intensifying polarization, identity-fueled tribalism and parity between two minority parties.
As the parties migrate toward their respective ideological poles, they vacate the pragmatic center and get smaller. Amplified by social media, dogmatic and extremist voices drown out temperate ones and drive out independents, who now constitute roughly a third of the electorate.
FACT: U.S. manufacturing employment has risen in 11 of the last 12 years.
THE NUMBERS: Annual manufacturing job growth* in U.S. –
Employment:
Average 1998-2010:
-508,000
Average 2010-2022*:
+95,000
2022 only**:
+420,000?
* Using BLS’ annual averages
** Gain from November 2021 to 2022 is +420,000; final full-year 2022 figure will likely differ slightly.
WHAT THEY MEAN:
First reaction to the U.S. International Trade Commission’s “Distributional Effects of Trade and Trade Policy on U.S. Workers” report, out November 14: Seems a bit mis-titled. The report is much more an in-depth survey of economic literature on, and summaries of testimony relating to, “import shocks” and manufacturing job loss in the United States than a 360-degree survey of the full set of questions inherent in the title, which include import competition but also the role of exports in rural and agricultural communities, the effect of tariff systems and trade remedy laws on consumers and ‘downstream’ industries and their communities, or services trade and the digital world.
Second reaction: Looking at the focus on import shocks and manufacturing job loss, should academia start asking some new questions?
As the ITC conducted its hearings, read up on the lit., and drafted its chapters over the past year, the U.S. was adding a net of about 1,150 manufacturing jobs every day — in total, 420,000 from November 2021 through November 2022, almost certainly making 2022 the largest upward annual jump since 1984. A random sampling of states finds 14,400 net new manufacturing jobs in Arizona, 39,200 in California, 1,300 in Delaware, 6,200 in Colorado, 15,600 in Michigan, 4,900 in Nevada, 8,500 in New York, 12,700 in North Carolina, and so on. And though the 420K annual total is exceptionally high, it isn’t simply an overheating-economy anomaly. Apart from COVID-stricken 2020, in fact, the U.S. has added net manufacturing jobs every year since 2010, marking the longest period of expansion since the 1960s.
A brief history of the national manufacturing-job trajectory, then some possible new-era questions:
1. Peak: Manufacturing employment in the U.S. peaked as a share of the workforce in the mid-1950s at about 30% of all jobs. In 1952, in the era of Eisenhower, Sloan, King, Reuther, and Dulles, 15.3 million of America’s 50.3 million workers went off to factory jobs each morning.
2. Transition:The Bureau of Labor Statistics’ total counts of manufacturing jobs continued to rise for another generation, peaking at 19.6 million in 1979. On the other hand, employment in other industries grew faster and manufacturing employment steadily fell as a share of employment, to 22% of 1979’s 90.1 million jobs. Following that came a long decline to 16.8 million by 1992; then a modest rebound to 17.6 million in 1998 (14% of 126 million workers) as the 1990s boom approached its crest.
3. Drop: In the next 12 years, actual production continued to grow — the BEA reports $1.48 trillion in “real manufacturing value-added” GDP as of 1998, and $1.94 trillion in 2010. But employment dropped fast, falling for 12 consecutive years to a low of 11.5 million (9% of 130 million jobs) in early 2010, with about 60% of net job loss coming in the 2001/2 recession and the 2008/9 financial crisis.
This experience sparked intense debate in the academic and policy worlds, on Chinese competition, import shocks, automation and robotics, and the experience of manufacturing-reliant communities. As the ITC’s report suggests, the debate continues today. But as it goes on, manufacturing employment trends have reversed, and by now have probably risen for long enough to justify a new phase and some new questions:
4. Rebound?: Since the 2010 nadir, manufacturers have added jobs in 11 of the last 12 years* — the only exception, again, being 2020 during the COVID pandemic – and total employment has grown to 12.9 million. (8.4% of 154 million jobs). In both length and net totals, this rebound has surpassed that of the 1990s; by length alone, as of 2019 it matched the 1960-69 period** as the longest continuous period of manufacturing job growth in BLS’ records***. Some industry samples, from 2010 through 2022: automotive industries +370,000 (though from a dire financial-crisis low), food manufacturing +265,000, fabricated-metal products +197,000, machinery +130,000, chemicals +127,000, wood products +92,000, electrical equipment +55,000, rubber +22,000, furniture +20,000. Or, alternatively by state (from 2010, rather than the single-year growth reported above): Nevada +29,000, Georgia +72,000, Pennsylvania +11.000, California +70,000, Texas +115,000, Michigan +155,000. Most states remain below their 1998 counts, but one region — the Great Plains and Rocky Mountain West — has gotten all the way back.
Here is a new topic for academia, then: What explains rebounds and resilience? Some starting points:
* Policy? Seems at first glance unlikely, as job growth has continued through the quite different approaches of the Obama, Trump, and Biden administrations, but perhaps some Obama-era innovations worked and had lasting effects?
* Some internal change and successful adaptation to competition within American industry and labor?
* A change in the external environment? Perhaps the China boom ran its natural course, or got submarined and lost competitiveness as Zhu Rongji-era liberalization lost out to Xi Jingping-period dirigisme and central planning?
* Or something else that hasn’t yet occurred to us here?
Ideas and speculation welcome.
* Or 10 of the last 12 counting December-to-December totals instead of using the BLS annual averages. ** Using BLS’ annual averages; counting December-to-December, 2016 had a very slight decline, so the uninterrupted-growth period would be six years, equaling the six-year expansion of the 1990s. *** Consistent data on manufacturing jobs go back to 1939.
FURTHER READINGS:
The ITC’s “Distributional Effects of Trade and Trade Policy on American Workers” report.
.., and Vice President Ed Gresser’s testimony (a bit against the grain), focusing on the U.S. tariff system, its very limited power as a job protector, and its tax-policy impact on single moms and low-income families.
Gresser and Workforce Development Policy Director Taylor Maag on replacing the Trade Adjustment Assistance program with a universal benefit for dislocated workers.
Data:
The Bureau of Labor Statistics’ databases. Try Employment, Hours, and Earnings for total employment, manufacturing, retail, transport, science, etc., going back to 1939 in major categories and to 1990 in very detailed form.
… and BLS’ most recent monthly Employment Situation report, out last Friday.
States:
Colorado’s Department of Labor and Employment, overseeing a 23% jump in manufacturing jobs since 2010.
… Nevada, up from 38,000 to 67,000, has the country’s fastest 2010-2022 growth.
… and Michigan’s 155,000 growth since 2010 is the largest in total numbers.
ABOUT ED
Ed Gresser is Vice President and Director for Trade and Global Markets at PPI.
Ed returns to PPI after working for the think tank from 2001-2011. He most recently served as the Assistant U.S. Trade Representative for Trade Policy and Economics at the Office of the United States Trade Representative (USTR). In this position, he led USTR’s economic research unit from 2015-2021, and chaired the 21-agency Trade Policy Staff Committee.
Ed began his career on Capitol Hill before serving USTR as Policy Advisor to USTR Charlene Barshefsky from 1998 to 2001. He then led PPI’s Trade and Global Markets Project from 2001 to 2011. After PPI, he co-founded and directed the independent think tank Progressive Economy until rejoining USTR in 2015. In 2013, the Washington International Trade Association presented him with its Lighthouse Award, awarded annually to an individual or group for significant contributions to trade policy.
Ed is the author of Freedom from Want: American Liberalism and the Global Economy (2007). He has published in a variety of journals and newspapers, and his research has been cited by leading academics and international organizations including the WTO, World Bank, and International Monetary Fund. He is a graduate of Stanford University and holds a Master’s Degree in International Affairs from Columbia Universities and a certificate from the Averell Harriman Institute for Advanced Study of the Soviet Union.
President Biden and lawmakers in both parties have prioritized slashing Americans’ out-of-pocket spending on insulin. And they recently made significant strides by including a $35-a-month co-pay cap for insulin for Medicare beneficiaries in the Inflation Reduction Act.
But as promising as these cost-reduction measures are, they raise a key question: Why limit the co-pay price caps to just insulin? Nearly eight million Pennsylvanians live with at least one chronic condition and three million are living with two or more. For seniors on Medicare, chronic disease prevalence is even higher and, for millions with fixed incomes, out-of-pocket costs are increasingly problematic.
If a $35-a-month co-pay cap makes sense for insulin — and it does — why not implement the same policies for medicines that treat asthma, hypertension, and other common chronic conditions and focus on Medicare where chronic diseases are so prevalent?
Today, the Progressive Policy Institute (PPI) released a new policy brief examining Europe’s energy supplies before and after Russia’s invasion of Ukraine, and the role the U.S. has played in expanding exports to the EU in the wake of the war. The policy brief is titled “Russian Shutoffs and American Exports: Explaining the European Natural Gas Shortage,” and is authored by Elan Sykes, Energy Policy Analyst at the Progressive Policy Institute.
“The United States is uniquely positioned to help our allies in Europe whether the energy crisis caused by Putin’s war, and one tool we have is ramping up exports of LNG during the EU’s time of great need. We can’t stand idle as Europe considers burning more coal to get through the winter,” said policy brief author Elan Sykes.
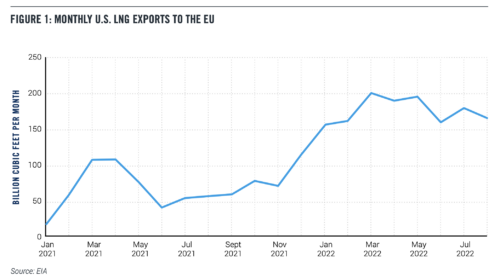
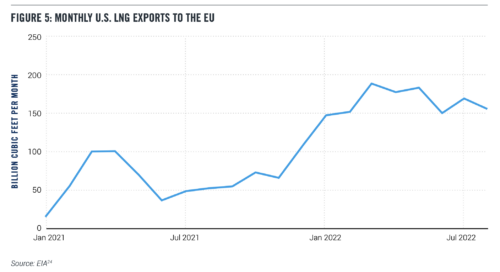
As outlined in the brief, U.S. Liquefied Natural Gas (LNG) exports increased by nearly three times from January to August in 2022, compared to the same period in 2021. Policy brief author Elan Sykes argues the U.S. should continue to boost exports of LNG to Europe to avoid a forced transition to dirtier energy sources like coal — or even more painful energy shortages, factory shutdowns, and skyrocketing household energy costs. He also urges the U.S., the EU, and other allies with ambitious climate agendas to seize on the crisis as an opportunity to expand and speed up deployment of clean energy and energy efficiency technologies to the greatest extent possible.
The Progressive Policy Institute (PPI) is a catalyst for policy innovation and political reform based in Washington, D.C. Its mission is to create radically pragmatic ideas for moving America beyond ideological and partisan deadlock. Learn more about PPI by visiting progressivepolicy.org.
Russia invaded Ukraine in February 2022, placing the European Union in a bind and forcing a choice between supporting Ukraine with aid, arms sales, and sanctions on Russia on the one hand, or withholding support to maintain Russian natural gas supplies. Before the invasion, Russia served as the largest supplier of natural gas to the EU through multiple pipeline systems and as Liquified Natural Gas (LNG). Europe chose support for Ukraine, and two key pipelines were shut off following the invasion.
The EU has sought to increase LNG imports from around the world to make up the gap as best as possible, and global gas prices skyrocketed as a consequence. The U.S. has stepped in as a key LNG supplier, sending nearly triple the quantity of LNG to the EU through August 2022 compared to the first eight months of 2021. The U.S., EU, and other allies with ambitious climate agendas should also seize on the crisis as an opportunity to expand and speed up deployment of clean energy and efficiency technologies to the greatest extent possible.
American exports are limited by the available capacity of liquefaction terminals, so the increase in shipments to Europe has come at the expense of other global customers for U.S. natural gas. The EU has spent the past several months purchasing as much LNG as possible to hit storage targets, along with a raft of policies aimed at expanding alternative sources of energy, encouraging conservation, and supporting households with subsidies.
The squeeze on supplies has loosened since September, as storage tanks across Europe have reached their capacity, and warm fall weather lessened seasonal demand. Through a combination of luck with the weather, curtailed industrial output, and expensive inventory buildup through LNG import growth, the European Union has made it nearly to the end of 2022 without a disaster. But the limits of LNG import and storage capacity, the vagaries of winter weather, and success in deploying clean energy and efficiency technologies will each continue to affect the EU, its energy markets, and its climate ambitions for the foreseeable future.
EU ENERGY SUPPLIES BEFORE AND AFTER RUSSIA’S INVASION
In terms of overall supply, the EU imported 58% of its energy in 2020, down slightly from the pre-pandemic figure of 60% in 2019. Natural gas makes up 24% of all the primary energy consumed in the EU, with import dependency and share of natural gas in overall energy supply varying by country.
In 2019, a “normal” pre-pandemic year, the EU’s total energy supply added up to 16.5 Petawatthours, of which 24% or 3.9 PWh came from natural gas. In that year, the EU imported a total of 440 bcm of natural gas, of which 38% came from Russia through the Nord Stream, Yamal, Turkstream, and Ukrainian pipeline systems and via LNG tanker. The remaining share was supplied by Norwegian, North African, and Turkish-Azerbaijani pipelines and by LNG tankers from around the world. After Russia, the largest exporters of LNG in 2019 were Qatar, Nigeria, and the United States (which supplied 3% of EU gas imports in 2019).
This picture of Europe’s pre-war energy reliance underscores the importance of Russia’s decision to weaponize its energy resources since its invasion of Ukraine. The Yamal Pipeline, running through Belarus to Poland, has been shut off since July. Now, the Nord Stream pipeline in the Baltic, which was running below capacity for several months while Gazprom claimed maintenance issues but is now offline due to suspected sabotage, is permanently out of commission as well. Prior to the invasion and shutoffs, these pipelines would be supplying roughly 800 mcm and 1,200 mcm respectively per week around this time of year.
The set of pipelines running through Ukraine supplied more variable quantities of natural gas in pre-invasion years, but has been supplying between 260-280 mcm of natural gas per week, or roughly 10-20% below prewar maximums ranging from 1550-2250 mcm per week. Unlike the other three main pipeline systems sending Russian gas to the EU, the Turkstream pipeline has not been severely curtailed, but it supplies smaller, variable amounts with a range this year of 34 to 323 mcm per week.
Cumulative Russian gas exports through midOctober to the EU and the U.K., as measured by Bruegel and ENTSOG, dropped by 74.5 bcm compared to the average for the same length of time for the years 2015-2020. That leaves a huge hole in Europe’s energy supply, equivalent to 4.8% of total energy supply for the EU in 2019. If Russian exports continue at 500 mcm per week, roughly continuing the trend since August, the total loss will reach 6.8%.
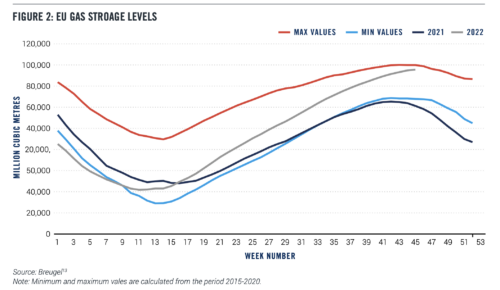
Imports and storage have helped make up part of this gap, but due to their relatively fixed capacity can only contribute as much as the EU’s present energy infrastructure allows. Data from the EU’s gas transmission system shared by Breugel show that European storage has filled to nearly the all-time maximum as importers rushed to replace cut off Russian supplies even after prices spiked:
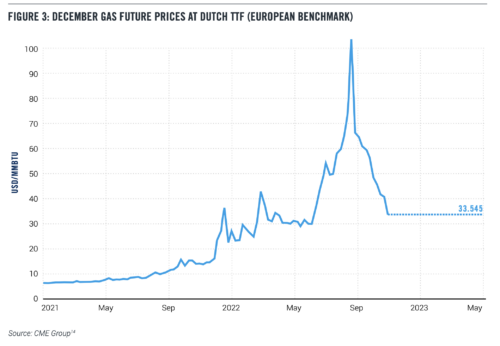
While the Breugel data for 2021 and for previous years show that gas stocks usually started drawing down at this time of year, that’s happening more slowly this year as Europe attempts to store the absolute most it can for the winter. But since storage is nearly full and LNG imports do not necessarily have a place to go in the EU, LNG future prices have dropped back to a point comparable to post-invasion, preshutoff levels:
Looking ahead, future markets expect prices to stay elevated for the coming year at least and major uncertainties remain. In the meantime, painful tradeoffs are being made. The EU agreed to union-wide targets for storage, which they have since exceeded, and for reductions in gas demand of 15% through this coming March.
While good weather so far this fall kept building heat demand for gas low, the elevated price of natural gas has still hit consumers in heating, electricity, and especially industry. Industrial gas consumption dropped by 25% in the third quarter of this year, and continued high costs have come to threaten the viability of European plants in energy-intensive industries like chemicals, basic metals, and mineral producers. High gas costs also are passed through electricity prices to other energy-intensive industries that do not consume significant quantities of gas directly, and to households.
In France, where a nuclear-heavy grid might have been expected to lessen the blow to the power system, a set of prolonged maintenance issues have kept reactors from providing a crucial backstop. The EU and its member states are exploring and adopting various policy tools to subsidize households, diversify supplies of gas, and speed deployment of efficiency upgrades, renewables, and electrified end-use technologies like heat pumps that can help replace gas combustion where possible.
Many of these initiatives will take time to bear fruit, and in the meantime nobody in the financial markets or elsewhere can fully predict the most important immediate factor in Europe’s energy shortage: the weather this winter. A cold winter means higher demand for heating and electricity, and fixed import and storage capacity might not be able to keep up without painful tradeoffs for the EU.
AMERICAN LNG TO THE RESCUE
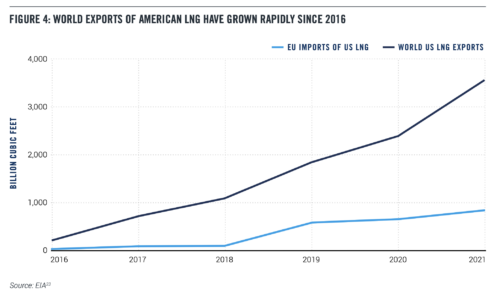
Into the Russia-sized hole in European energy budgets step the United States, Qatar, and Nigeria. A major global producer and now exporter of oil and natural gas, America is host to the largest LNG export capacity of any country in the world, with seven liquefaction terminals together averaging 11.1 bcf in exports per day in the first half of this year.
U.S. exports to the EU were already growing for years before the invasion, as the graph above shows. But U.S. firms have stepped up shipments to the EU massively since Russia’s invasion:
U.S. LNG exports to Europe increased by 2.8 times in the first eight months of 2022 compared to the same period in 2021, up from 512 bcf to 1,413 bcf. EU neighbors Turkey and the U.K. also roughly doubled their imports of American LNG over these periods, up by 67 bcf and 123 bcf, respectively. Global US LNG exports increased slightly in that time, to 2.6 trillion cubic feet through August of this year from 2.3 tcf in the first eight months of 2021, but capacity is fixed in the short run (absent maintenance problems like the May 2022 fire at the Freeport terminal, which is expected to resume exports soon).
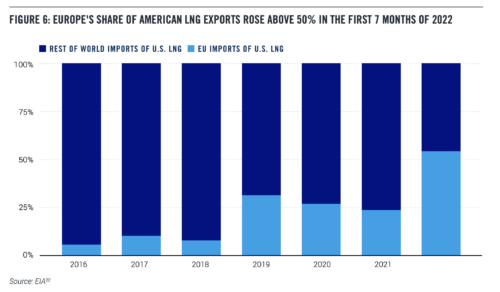
While the “size of the pie” of overall U.S. gas exports grew ever so slightly, the main way that gas shipments to the EU have increased is by taking a larger slice of it from other would-be importers of U.S. LNG around the world, from 23% last year to 54% through August of this year.
For example, big customers of U.S. LNG in South America and Asia have seen sharp drops in American imports in 2022 so far. Brazil, Argentina, and Chile together imported 213 bcf less in 2022 than the same period in 2021. In East Asia, a slight increase in shipments to Taiwan was dwarfed by the huge drop in aggregate imports of China, India, Japan, and South Korea for a net decrease of 541 bcf. Smaller importers around the globe lost out too, as these decreases among big importers outside of Europe did not entirely offset the ravenous EU. As noted above, the share of overall American LNG exports going to Europe shot up from 23% last year to 54% so far this year.
Diverting shipments to the EU has the benefit of easing Russia-induced shortages across the Atlantic, but this strategy creates tradeoffs. Trading a concentrated, acute shortage in Europe for a diffuse shortage around the world means that the losers of a natural gas bidding war must contend with higher prices and foregone economic activity. Some will take the option of burning more coal instead, releasing more carbon dioxide and air pollution into the atmosphere.
CONCLUSION
Since the Nord Stream pipeline has now been not only shut off but damaged in a probable sabotage, global LNG suppliers have shipped nearly as much gas as storage can hold. Meanwhile, the war shows no signs of abating as Ukraine continues to claw back territories supposedly “annexed” by Russia. Europe thus could face a prolonged energy shortage and will continue importing significant volumes of LNG for the foreseeable future.
The United States must continue to boost exports of its relatively cleaner natural gas to Europe and the world. Otherwise, EU countries and other would-be gas importers could be forced to burn more coal to keep the lights on, or endure painful energy shortages.
Entering winter with nearly full storage capacity in the EU, global prices are higher than preinvasion benchmarks but dropping from their end-of-summer/fall peak. With futures prices high for the coming years, planned expansions to U.S. export capacity will help as they come online, but will take years. Expansions underway at three more liquefaction facilities are not expected to increase peak capacity from 13.9 bcf per day to 19.6 bcf per day until the end of 2025. With demand dependent on the uncontrollable factor of winter weather and short-run capacity for U.S. exports fixed, there remains much to do outside of direct increases in U.S. exports.
In Europe, supply-side policies to boost alternatives to natural gas such as expanding renewables generation and keeping older nuclear plants online will help keep the kilowatts flowing, emissions down, and energy costs from spiraling. Support on the demand side for electrified appliances to replace gas heaters and stoves and efficiency upgrades like insulation will ease the pressure on limited gas inventories and household finances.
These recommendations apply in equal measure to the U.S., where electrification and climate tech deployment can help add to the suite of available options for American consumers increasingly exposed to fickle international gas markets.
Planned expansions of LNG export capacity, and the pipeline systems required to feed them, should be acknowledged as a means to reduce global power-system emissions wherever they replace marginal coal combustion or natural gas produced in countries with higher leakage rates. As the methane mitigation policies in the Inflation Reduction Act and other potential policies like the new U.S. pledge at COP27 help reduce the impact of U.S. gas extraction upstream, the carbon advantage and climate benefits of globally abundant American LNG will grow.
Finally, as PPI has noted elsewhere, if American natural gas is to help Europe meet its carbon reduction targets, reducing upstream leaks and providing support to complementary energy technologies that speed decarbonization need to be part of the policy package.
PPI’s Center for Funding America’s Future today called on Congressional Leaders to prioritize the fight against inflation above all else as both Chambers race to complete the legislative priorities of the 117th Congress.
In their memo to leadership, Ben Ritz and Nick Buffie argue that Congress should not cut taxes or increase spending over the next year or in future years without concurrently offsetting the costs over the same time period. Doing so would double down on a borrowing binge that has worsened inflation and raised costs for hardworking Americans.
PPI’s Center for Funding America’s Future’s outlines key priorities for lawmakers to address in a fiscally responsible way that supports our economy and helps the Federal Reserve bring down inflation:
Providing adequate appropriations for normal government operations and new public investments
Supporting the fight for democracy in Ukraine
Restoring some expansion of the child tax credit
Restoring immediate expensing for R&D investments
Improving retirement security without costly budget gimmicks, and
Passing energy permitting reform to boost energy supply and combat climate change
The Progressive Policy Institute (PPI) is a catalyst for policy innovation and political reform based in Washington, D.C. Its mission is to create radically pragmatic ideas for moving America beyond ideological and partisan deadlock. Learn more about PPI by visiting progressivepolicy.org.