WEBINAR: Advancing the Gains Made by Black and Brown Students in the Next Administration

The Progressive Policy Institute hosted a conversation on how members of the Democratic Party can better protect recent gains made by Black and Brown students while advancing these gains after the 2020 Presidential Election. The conversation surrounded gains made by Black and Brown students, how these gains were made, and more importantly how Democrats can ensure the gains continue under the next Administration.

Speakers:
– U.S. Senator Michael Bennet, (D) Colorado
– David Osborne, Progressive Policy Institute
– Honorable Antonio Villaraigosa, Former Mayor, City of Los Angeles
– Keri Rodrigues, National Parents Union
– Dr. Howard Fuller, Freedom Coalition for Charter Schools

Moderator: Curtis Valentine, Deputy Director of Reinventing America’s Schools Project.

Watch on YouTube here. On the go? Listen to the conversation where you find your podcasts:

Anchor.FM – https://anchor.fm/ppi4/episodes/Advancing-the-Gains-Made-by-Black-and-Brown-Students-in-the-next-Administration-ejpin4/a-a1pvt2
Spotify – https://open.spotify.com/show/3t3TmdJgAtgIahj7ck2LE4
Google Podcasts – https://www.google.com/podcasts?feed=aHR0cHM6Ly9hbmNob3IuZm0vcy8yNjBlMGRhMC9wb2RjYXN0L3Jzcw==
Overcast – https://overcast.fm/itunes1519327729/progressive-policy-institute
Breaker – https://www.breaker.audio/progressive-policy-institute
Pocketcasts – https://pca.st/mkyyayqv
Radio Public – https://radiopublic.com/progressive-policy-institute-6vwjYQ

The Third Wave: How 5G Will Drive Job Growth Over the Next Fifteen Years

5G, because of its low latency and high throughput, won’t just be an evolution in technology, but a revolution. It will open the door to incredible innovation in both the private sector and the government – including augmented and virtual reality, precision agriculture, smart ports, transportation and logistics, autonomous vehicles, connected construction and so much more.

In the United States, it is critically important to understand how this fundamental shift in technology will impact the broader economy, especially at a moment when COVID-19 has caused significant economic disruption and massive job losses nearing Great Depression levels. Key questions include:

How many jobs will be created by the 5G Economy? Will they be focused around traditional technology centers like San Francisco, New York, and Boston, or create new opportunities across the nation? What kinds of jobs will be created?

And for policymakers, what does the U.S. need to do to support efficient allocation of radio spectrum to support this technology development? And should we provide job training to ensure that workers in America can meet the opportunity?

Already the 5G job revolution has begun. Large mobile providers such as AT&T and Verizon are building out new networks across the country. Network companies such as Cisco, CommScope, Mavenir, and L3Harris are hiring 5G system architects, Radio Access Network (RAN) engineers, 5G solution architects, and technical managers in the 5G space.

Technicians and tower climbers are putting up 5G small cells at a rapid pace. This is not the first time that fundamental shifts in networking technologies have created sudden shifts in the economy and job opportunities.

This paper identifies and outlines three waves of wireless-driven job growth (Summary Table 1) in the U.S., and answers major questions about how many jobs will be created, which industries will be affected, where they will be located, and what we can do as a nation to accelerate efforts to meet this challenge.

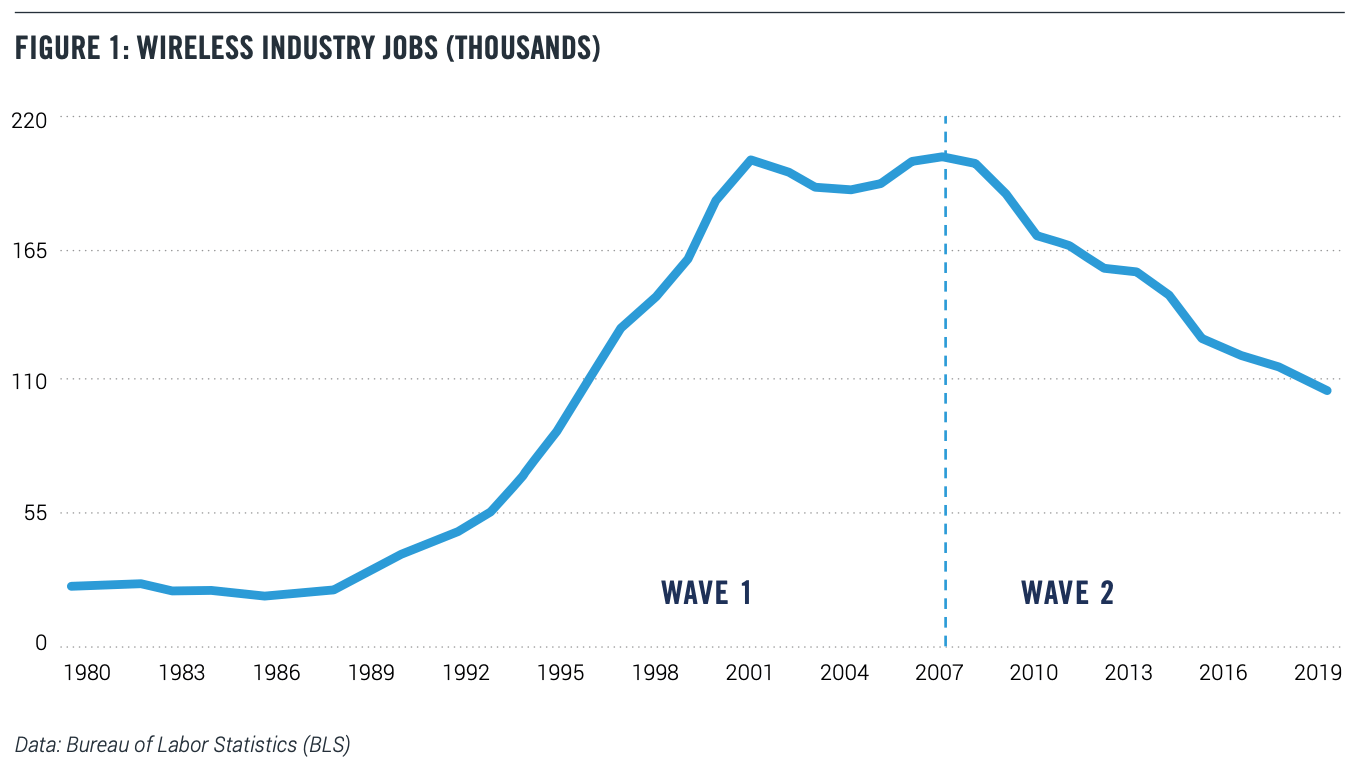
Wave 1, The Rise of Wireless, covers the period from 1990-2007, as mobile carriers were building out the original wireless networks and cell phones went from a rarity to a necessity. Wave 1 generated roughly 200,000 jobs in the wireless industry.
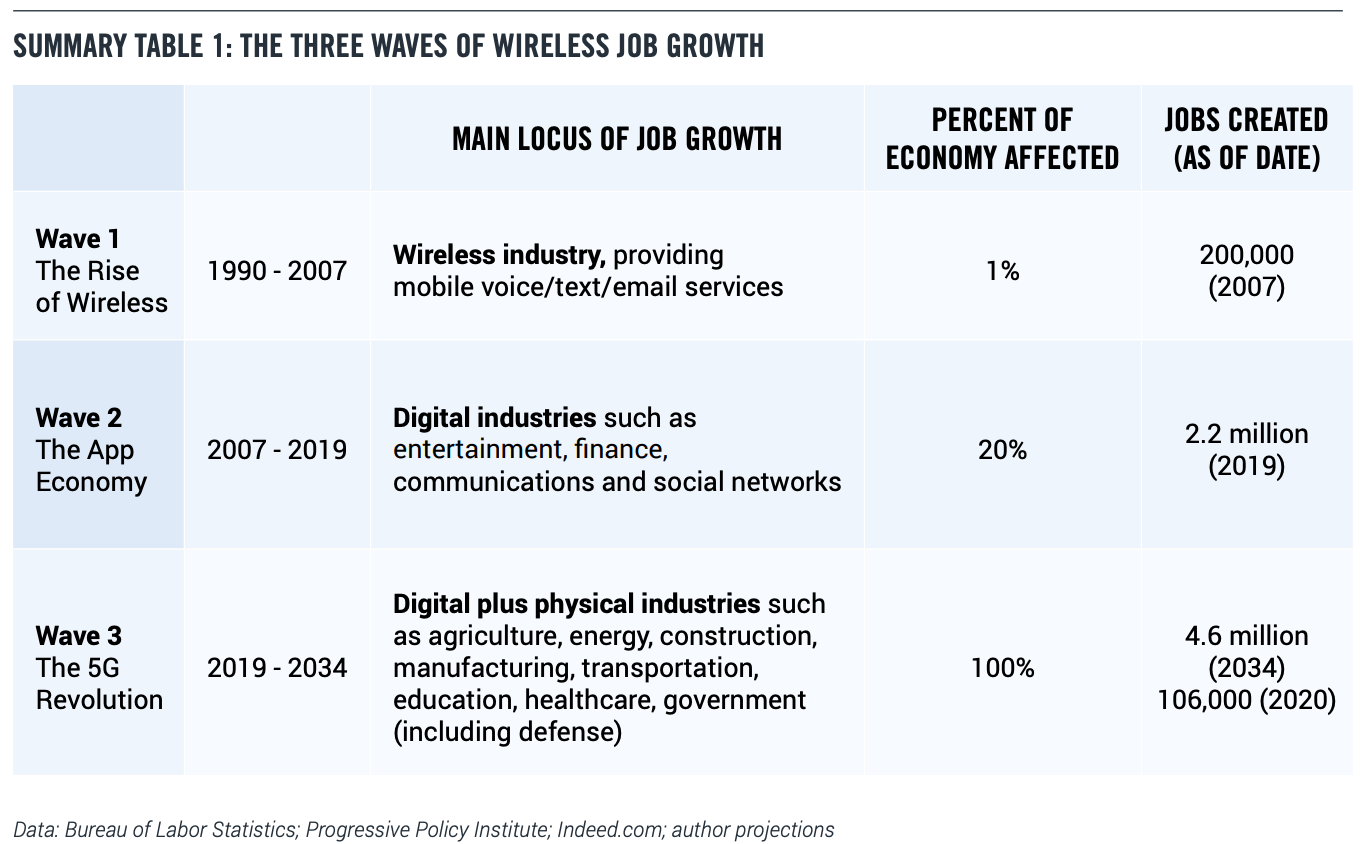
Wave 2, “The App Economy,” covers the period from 2007 to 2019, which was rooted in the application of wireless to mobile apps via smartphones, rather than in the wireless industry.

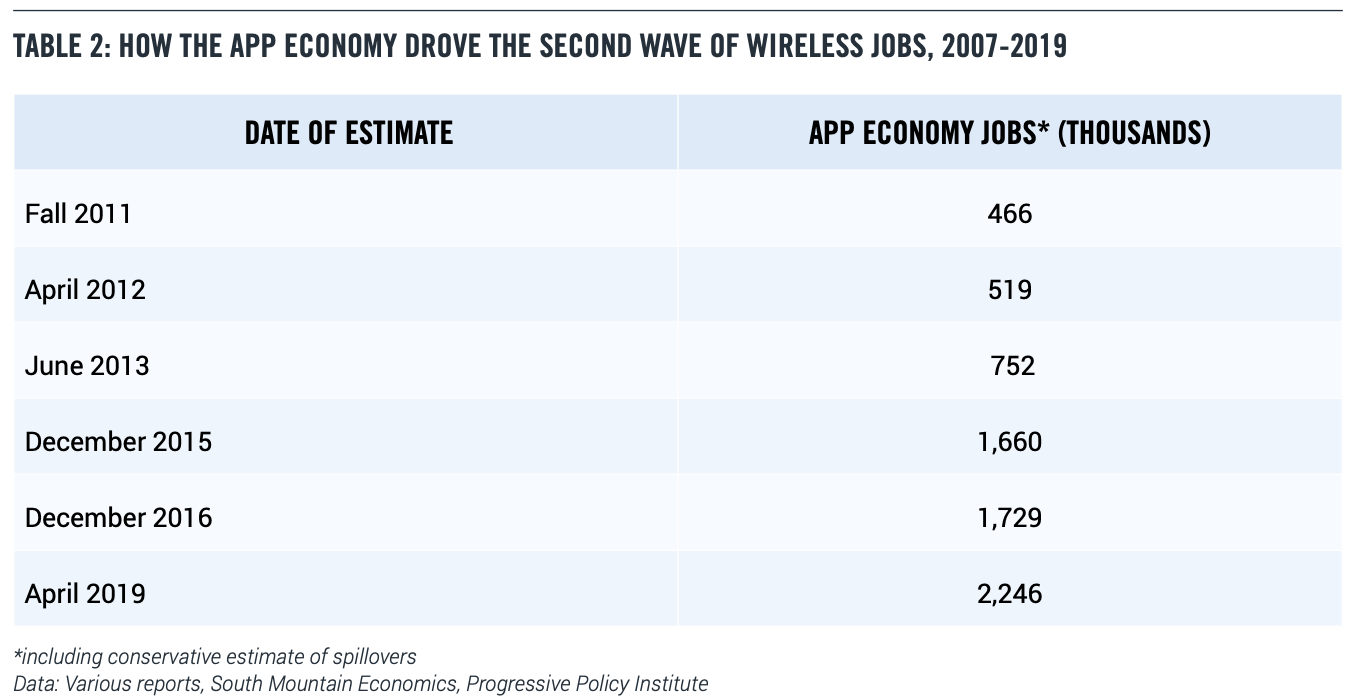
Conventional BLS statistics contained no categories for app developers. But a widely cited study by this report’s author, released in early 2012, analyzed detailed data on job postings and estimated that the U.S. App Economy included 466,000 jobs, including workers developing and maintaining mobile apps and the workers supporting them. (1) Follow-up studies showed continued growth in the U.S. App Economy, with the latest figures from September 2019 reporting more than 2.2 million App Economy jobs. (2) This reflects an average growth rate of more than 20 percent annually. The main locus of Wave 2 job growth has been in industries such as entertainment, finance, communications and social networks, whose output can be easily delivered in a digital form (hence “digital industries”).

Wave 3, “The 5G Revolution,” began in 2019 as mobile carriers expanded their initial 5G networks. Wave 3 is generated by the applications of wireless to challenges in physical industries, such as agriculture, energy, construction, manufacturing, transportation, education, healthcare, and government including defense.

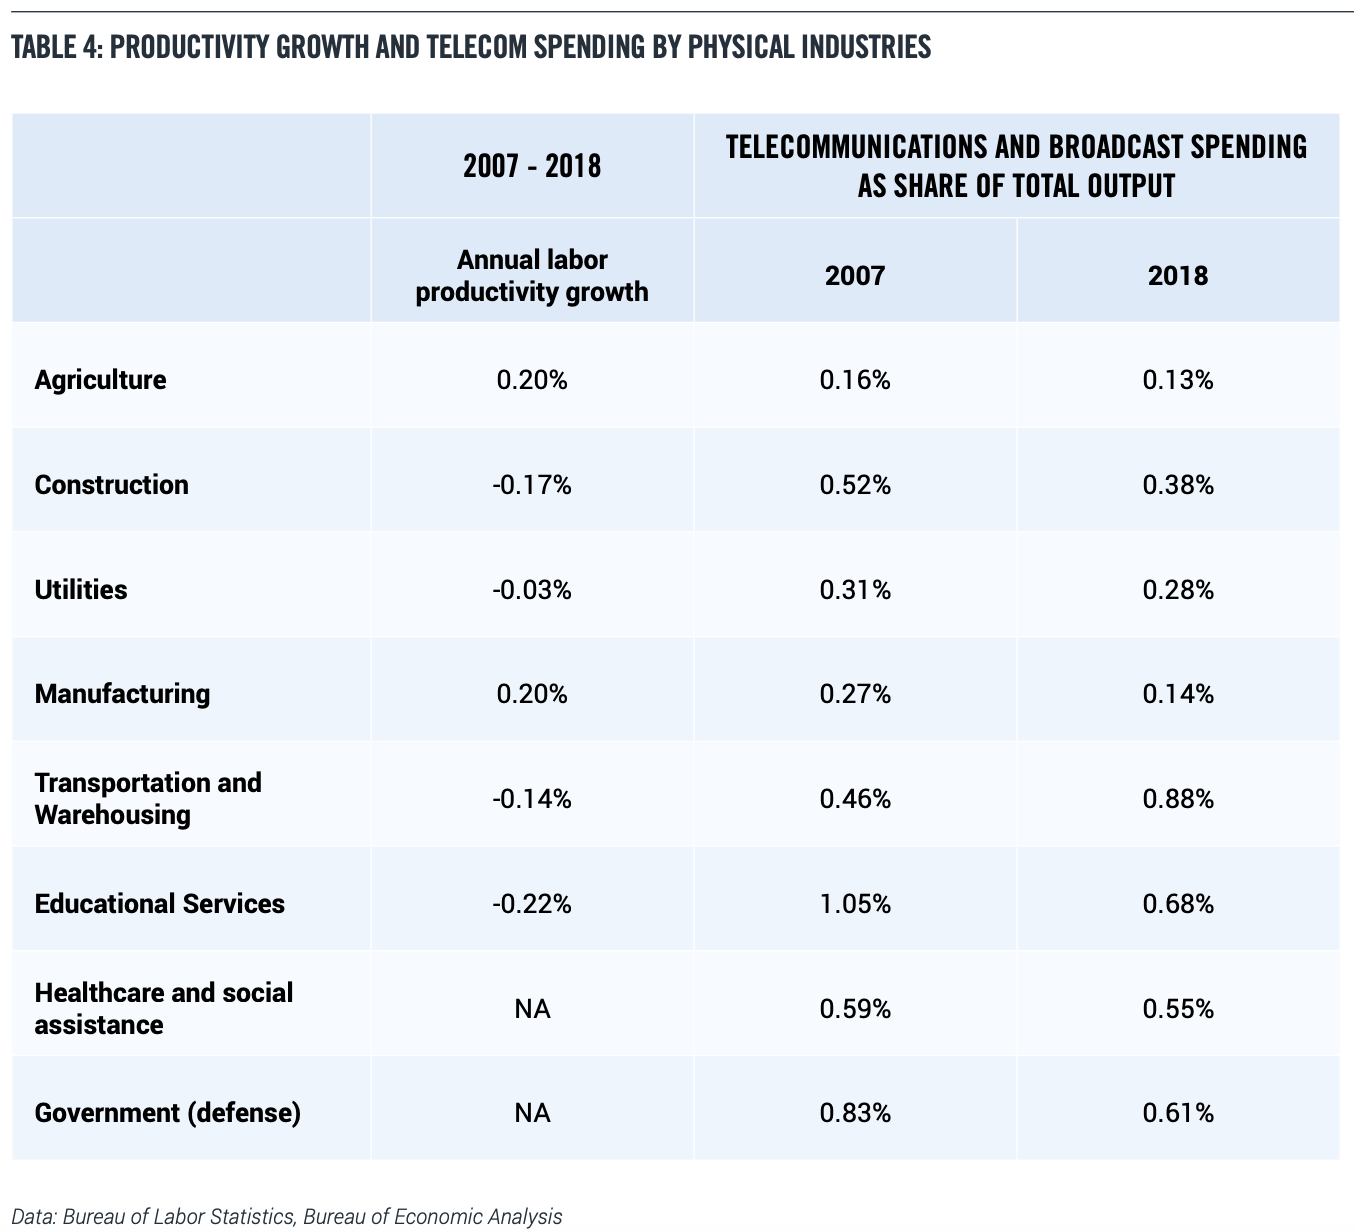
In recent years, most of these physical industries have experienced low or negative productivity growth, as well as low spending on telecommunications services.

5G is reversing both of these trends. Faster, more versatile wireless communications are an essential factor in driving productivity gains and creating jobs. Research shows that industries like manufacturing, construction, and healthcare have lagged in digitization, helping explain why productivity growth has been so slow. To increase productivity, physical industries need the ability to gather information from widely dispersed sensors and to use that data to control activities in real time. That’s not possible without faster and more versatile wireless commnications supplied by 5G. And the COVID-19 pandemic is accelerating the shift to many of these use cases.

How many jobs in the US will The 5G Revolution generate?

Unlike Wave 2, which mostly generated “cognitive” tech jobs which required a college education, Wave 3 is rooted in the physical world.

As a result, Wave 3 will also create mixed ‘cognitive-physical” skilled jobs, many of which fall into the category of installers and maintainers. So while App Economy jobs were focused on software development, Wave 3 jobs will drive job growth in dozens of sectors, across the economy in what we would traditionally consider both white collar and blue collar positions. Simply put, the third wave will benefit a wider set of Americans and regions than the second wave did.

For example, healthcare providers already monitor medical equipment like pacemakers remotely. But with 5G, the set of possible athome diagnostics or even interventions will expand greatly, and telehealth installers and maintainers will be a highly valued occupation. Similarly, precision agriculture will require “field sensor technicians,” autonomous vehicles will need a cadre of mechanics, and ecommerce will need people skilled in robotics maintenance.

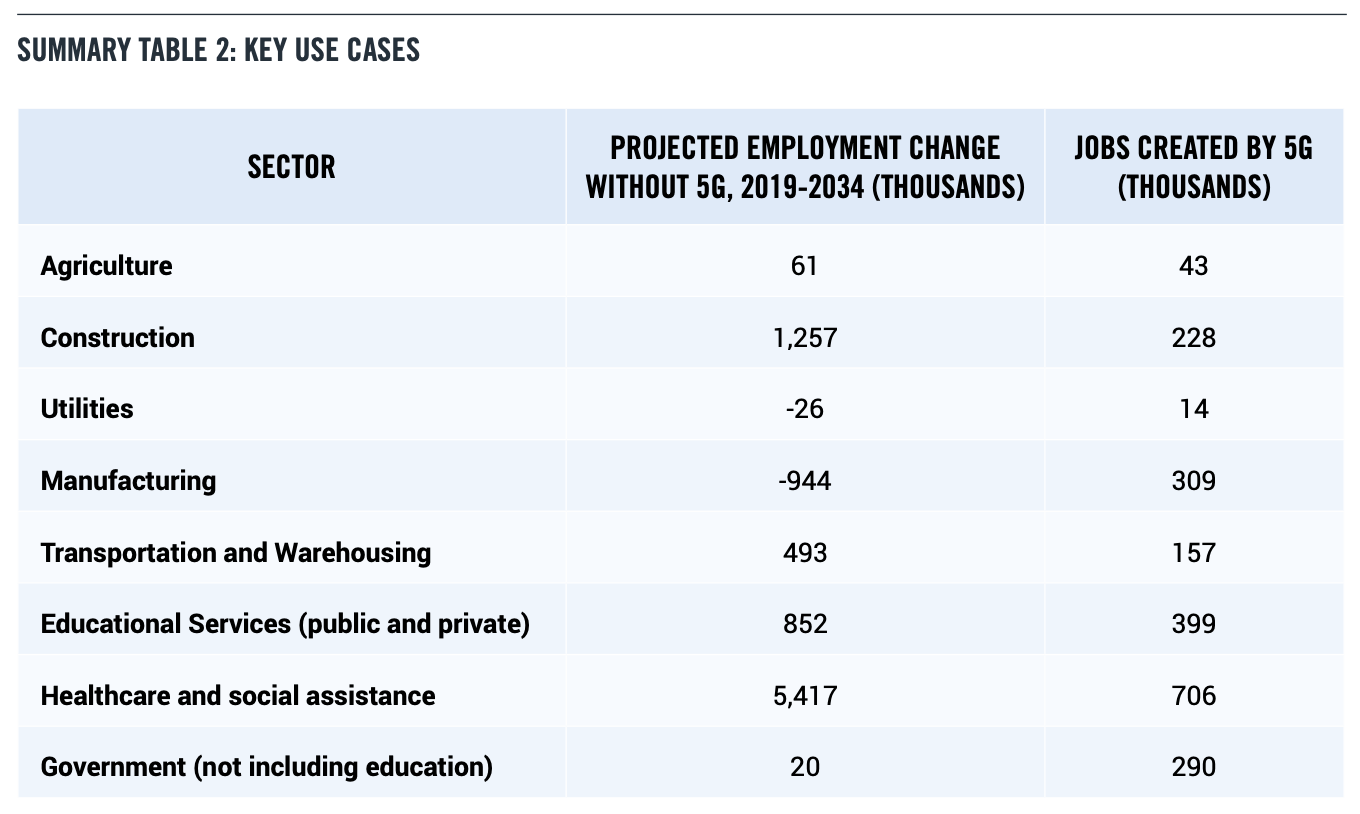
Using the latest BLS projections as a baseline jumping off point, we estimate that 5G and related technologies will create 4.6 million jobs relative to the baseline in 2034, 15 years after the introduction of 5G in 2019 (which is also, not coincidentally, the peak of the most recent business cycle). These are higher paying jobs that will replace jobs that are lost in a wide range of industries and use cases (Summary Table 2).

In an important sense, 5G job creation is a countervailing force to job destruction from automation and globalization, and critically important in the post-COVID world.
During these tough economic times, we also need to be concerned about the short-term job impact and opportunities that 5G is creating as well. This paper also shows that current 5G build-out and engineering activities are creating 106,000 jobs as of April/May 2020. We estimate the location of these jobs by state. To get this estimate, we use a combination of data from real-time job postings and BLS figures.

What Do Policymakers Need to Do?

Finally, this paper identifies four areas where policymakers should focus to harness the full potential of 5G.

First, more spectrum – mmWave, sub-6, and unlicensed – will be needed for broadband and related applications. The U.S. would benefit greatly from a long-range spectrum plan. While the Trump Administration has directed the Department of Commerce to create a National Spectrum Strategy, it has not yet been released.

A long-range spectrum plan would ensure the resource is allocated wisely, provide certainty to 5G stakeholders, and encourage long-term investment in networks for 5G and beyond.

In addition to spectrum, the U.S. also needs a plan for the adoption of 5G across the government, both defense and civilian. The public sector should be a leader, not a follower.

Third, Congress should be willing to invest heavily in the development of 5G and successor technologies. That’s essential if the U.S. is to keep up with global competition.

And finally, the U.S. should make a significant investment in job training. The U.S. needs to double down on traditional STEM fields and encourage more people in America to go into engineering and math. Beyond that, we need a national skills initiative and mentoring programs to ensure that this new generation of workers will have the training needed to support the cognitive-physical jobs that the 5G Revolution is already beginning to create.

I. THE FIRST TWO WAVES OF WIRELESS JOB CREATION

Wireless technologies are generally divided into generations, each one corresponding to higher speed and increased capabilities. 5G is the current technology being rolled out, with 6G on the horizon, promising even faster speeds and satellite-terrestrial integration.

However, for the purposes of this paper we use a different taxonomy, based on the labor market impact of wireless technologies.

Wave 1: The Rise of Wireless

Commercial mobile radio telephony—what is sometimes called “0G”—was available as a niche service since the late 1940s. (3) It had very little economic impact. The first true commercial portable cellphone, the Motorola DynaTAC 8000X, was introduced in 1983, but there were only 5 million cellphone subscribers as of 1990.

But the use of cellular wireless technology rapidly gathered speed after 1990, giving rise to 109 million subscribers as of 2000 and 233 million subscribers as of 2006. Not surprisingly, the need to build out networks, and handle a soaring customer base generated a large number of jobs. The number of people working in the wireless industry went from 36,000 in 1990 to 200,000 in 2000. (4) Wireless employment remained at roughly that level until 2007 (Fig 1).

The first wave of wireless job growth encompasses 2G in the 1990s and 3G and 3G+ in the first half of the 2000s. With 2G data speeds measured in the kilobits, only low-bandwidth applications such as voice, text messages, and email were viable. Running other applications on top of a slow network was almost impossible.

Mobile internet became possible with 3G and 3G+, but it was still not fast enough to make a significant difference.

Wave 1, The Rise of Wireless, was not anticipated in any of the long-run employment projections issued by the BLS in the late 1980s and early 1990s. That’s important, because the BLS projections, issued regularly since the 1960s, are the most widely quoted comprehensive long-run occupational and industry forecasts available. The BLS also maintains the most detailed occupation industry matrix available for the United States.

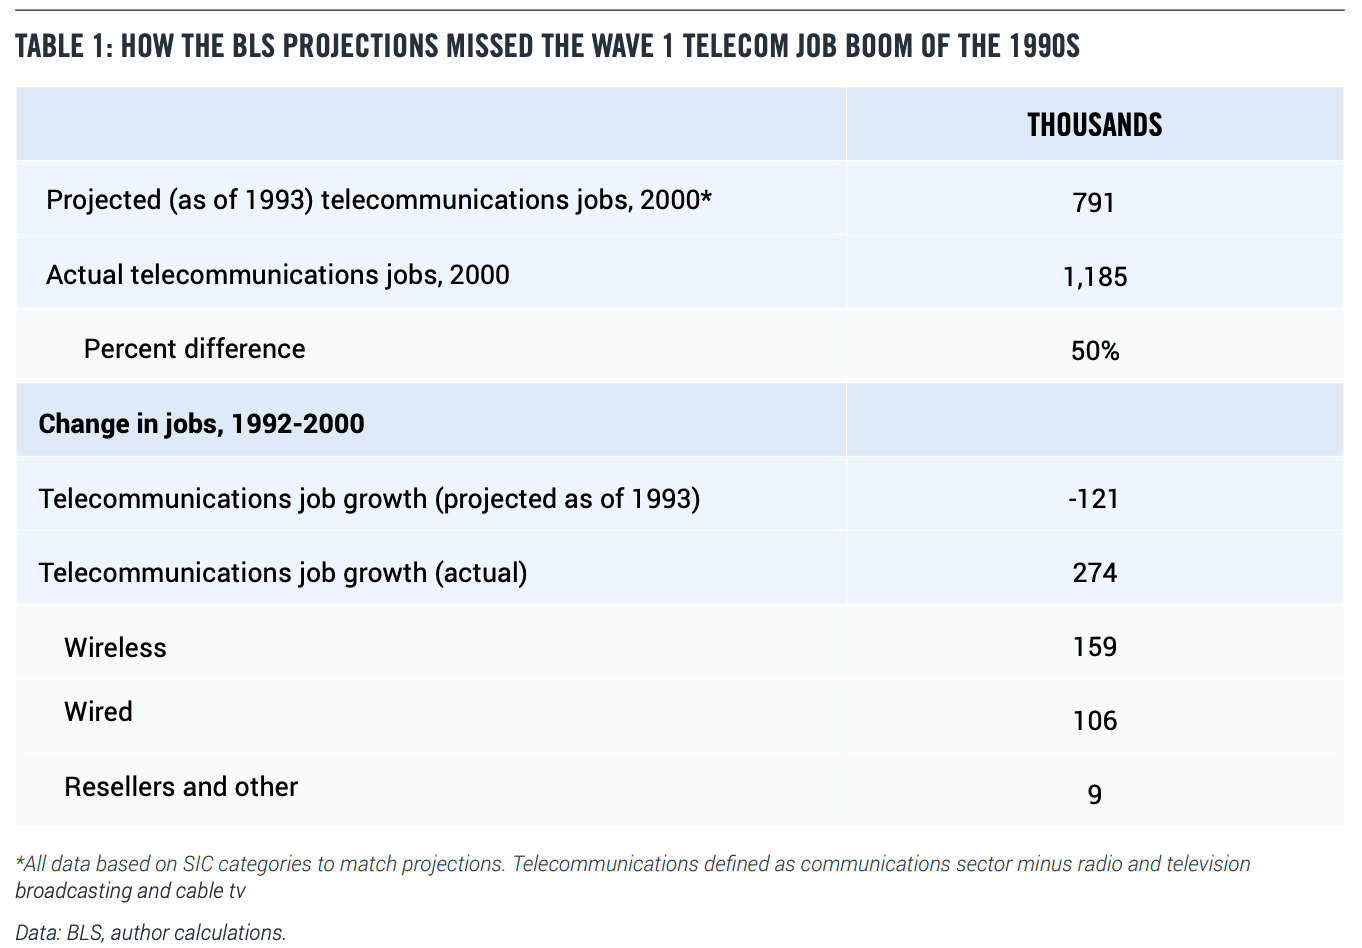
Yet, the BLS projection methodology typically misses the impact of new technologies. For example, the employment projections issued in 1993 anticipated that telecommunications employment would drop from 912,000 in 1992 to 791,000 in 2000. (5) In reality, telecommunications jobs rose to 1,185,000 in 2000, 50 percent above the projected value (Table 1). (6)

Wave 2: The App Economy

The second wave of wireless jobs, The App Economy, began in 2007 with Apple’s introduction of the iPhone, coupled tightly with the opening of the App Store and Android Market (later renamed Google Play) in 2008. Suddenly mobile phone users had a powerful computer in their pockets that could handle a myriad of applications. The demand for mobile broadband soared. Mobile wireless networks moved from faster versions of 3G to 4G and LTE, as the number of broadband subscriptions soared.

But the second wave of wireless jobs also started with a paradox. Despite the central role of mobile, employment in the wireless industry peaked in 2007 and fell by half by 2019. In 2011, the Wall Street Journal ran a piece with the stark title: “Wireless Jobs Vanish.” (7)

In fact, wireless was creating jobs, but not in the wireless industry. (8) More and more IT professionals were involved in either developing mobile apps, maintaining them after they were on the market, or supporting them with users. For banks and other financial institutions, mobile apps became an important way of supplying their services without having expensive real estate or branch workers. Moreover, mobile apps could use the camera on smartphones to provide services like depositing checks at homes.

Beyond utilitarian tasks like banking, shopping, and travel reservations, apps became the major way that people interacted with their smartphones. We watched videos, listened to music or podcasts, messaged friends, played games, and spent time on social networks. One survey found that adult Americans spent almost three hours per day on their smartphones, and 90 percent of that time was spent on apps. (9)

Conventional BLS statistics contained no categories for app developers. But a widely cited study by this report’s author, released in early 2012, analyzed detailed data on job postings and estimated that the U.S. App Economy included 466,000 jobs, including workers developing and maintaining mobile apps and the workers supporting them. (10) Follow-up studies confirmed continued growth in the U.S. App Economy, with the figures from April 2019 reporting more than 2.2 million App Economy jobs. (11) This reflects an average growth rate of more than 20 percent annually (Table 2).

Other studies have found similar or even higher estimates. For example, a 2018 study from Deloitte estimated 5.7 million App Economy jobs in the U.S., using a different methodology and a much bigger assumption of spillover effects. (12)

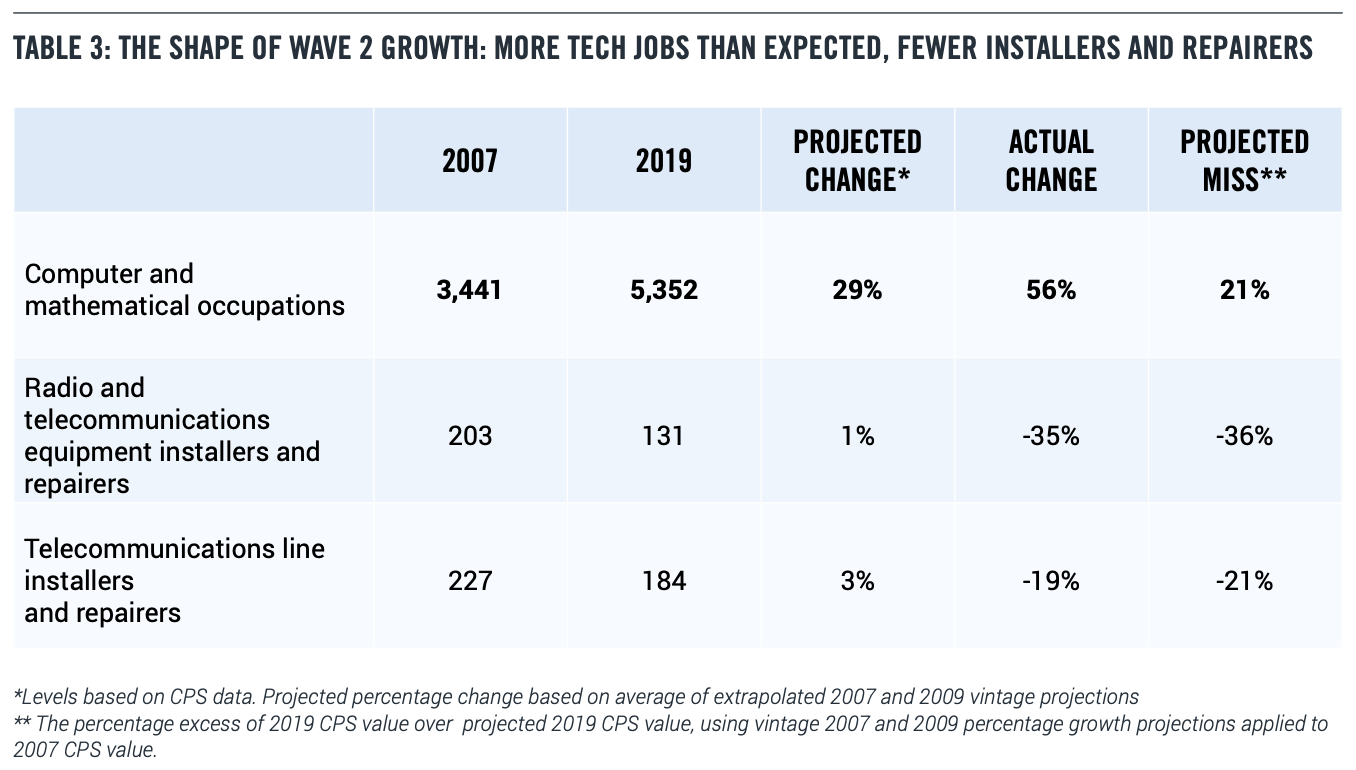
The job impact of mobile broadband and the App Economy did show up in the official numbers in a different way: the unexpectedly rapid growth of people working in “computer and mathematical occupations.” “Computer and mathematical occupations” is a broad category that includes data scientists, software developers and engineers, information security specialists, computer support specialists, and database and network administrators.

By contrast, skilled workers who maintain the telecom networks—the people who lay and fix the fiber-optic lines and put up the cellphone towers—are in the “installation, maintenance, and repair” occupations.

The BLS projections in 2007 and 2009 underestimated the expected size of the computer and mathematical workforce in 2019 by roughly 20 percent, or over 1 million workers. But the relevant categories of skilled installers and maintainers were overestimated in the projections. This tilt towards tech jobs is very important for understanding the third wave (Table 3).

II. WAVE 3: THE 5G REVOLUTION

Wave 3 of wireless-driven job growth, The 5G Revolution, began in 2019 as mobile carriers expanded their initial 5G networks, and then continued into 2020. All major carriers in the U.S. — AT&T, Verizon, and T-Mobile — are heading towards nationwide 5G networks by the end of 2020, according to analysts. (13) The pandemic has made the case for 5G more compelling as many of the use cases for 5G services have been pulled into the present.

Telehealth has become not just optional but a requirement in many medical situations.

Students from kindergarten to graduate school have been forcibly introduced to distance learning. Businesses and governments have been learning how to use virtual meetings, at a much lower cost than flying around the world. Companies have started using robots to help disinfect their stores. (14)

The U.S. military faces its own challenges, as the virus has forced changes in routines to minimize infectiousness and to protect its suppliers. “We believe the COVID-19 pandemic has accelerated society’s transition to broadband and digitization by at least a decade,” said one market analyst in March 2020. (15)

Indeed, in the early days of the pandemic, Verizon announced that it was expecting to allocate $17.5- $18.5 billion on capital expenses in 2020, up from its previous guidance of $17-$18 billion. “This effort will accelerate Verizon’s transition to 5G and help support the economy during this period of disruption,” Verizon said in a press release. So far, the pandemic has caused spectrum auctions in Europe to be pushed back. (16) Meanwhile the FCC has not changed its spectrum auction plans for 2020. (17)

Spending on 5G networks is what is known by economists as “autonomous investment”—that is, investment that is not linked to the immediate ups and downs of GDP. (18)

The Extension of Wireless to Physical Industries

Wave 2 was focused on “digital industries,” where the output can be reduced to bits and bytes. This includes games, music, communications, social networks, news, advertising, financial services, and ecommerce purchases of digital goods such as hotel and plane reservations. These digital industries, while important, make up less than 20 percent of the economy. (19) (Formally defined, the digital sector includes computer and electronics manufacturing; ecommerce; software and other publishing; video and audio content; broadcasting; telecommunications; data processing; internet publishing and search; and computer systems design and programming. Slight changes to the boundary of the digital sector does not affect the analysis here).

Wave 3, by contrast, is based on the applications of wireless to the challenges and opportunities in physical industries, such as agriculture, energy, construction, manufacturing, transportation, education, healthcare, and government (including defense).

Physical industry use cases include low-power wireless sensors that must operate for long periods in a field, say, without a battery replacement, or a low-latency connection to a drone or autonomous vehicle.

Table 4 shows the key physical sectors had slow or negative productivity growth during the second wave (in general 1 percent annual productivity growth is adequate and 2 percent is good, so none of these industries made the grade). Slow or negative productivity growth means less competitive industries, weaker wage gains, and lesser quality jobs.

Surprisingly, most of these industries had low and falling spending on telecommunications services, as a share of total output (for most industries, total output can be interpreted as revenues. For defense, total output can be interpreted as spending including accounting for depreciation). (20) For example, in agriculture, the amount spent on telecom services went from a very low 0.16 percent in 2007 to an even lower 0.13 percent. (To provide some context, in 2018 the average telecom share for digital industries was 3.5 percent, and the average telecom share for physical industries was 0.7 percent).

5G is likely to reverse both of these trends. Faster, more versatile wireless communications are an essential factor in driving productivity gains. Research shows that industries like manufacturing, construction, and healthcare have lagged in digitization, helping explain why productivity growth has been so slow. To increase productivity, physical industries need the ability to gather information from widely dispersed sensors and to use that data to control activities in real-time. That’s not possible without faster and more versatile wireless communications supplied by 5G.

The ability to rapidly communicate data and information using 5G will increase productivity gains in both the public and private sectors. And these productivity gains, in turn, will lead to higher revenue, faster wage gains, advances in job quality, and increased international competitiveness.

In 2017, a study from the Technology CEO Council examined the impact 5G will have on productivity growth in the “physical industries” and tax revenues over the next 15 years.21 The report estimated that the physical industries will boost annual economic growth by 0.7 percentage points over the next 15 years, generating an additional $2.7 trillion in annual economic output, $8.6 trillion in wage and salary payments, and $3.9 trillion in federal tax revenue.

The 5G Revolution and Job Growth

The impact of 5G on jobs can be summarized as “network meets the cloud.” That means we can push more capabilities out to the edge, including real-time and near-real-time applications of machine learning and artificial intelligence to the physical world. In many cases, new technologies create new tasks and markets that didn’t exist before. (22) For example, healthcare providers already monitor medical equipment like pacemakers remotely. But with 5G, the set of possible at-home diagnostics or interventions will expand greatly, and telehealth installers and maintainers will be a highly valued occupation.

5G will greatly expand the capabilities of drones in a range of applications from agriculture to military to logistics, especially in conjunction with artificial intelligence. That will expand the market for skilled drone operators, sometimes called “remote-pilots-in-command,” earning as much as $100,000 per year.

The other alternative is that productivity gains will lower costs enough to expand the market, which ends up creating new jobs. (23) That’s what happened in ecommerce. The use of robots in ecommerce fulfillment centers, combined with effective use of data, helped drive down costs low enough to offer consumers fast delivery and easy returns. And the combination of fast delivery and easy returns, in turn, made the ecommerce proposition irresistible to many consumers, because now they could avoid the time and trouble of going to the store, getting the product quickly and simply returning it for free if it didn’t work. The result was a massive shift from unpaid household shopping hours to paid ecommerce fulfillment and delivery hours. (24)

Or consider manufacturing. The pandemic has called into question the wisdom of depending on global supply chains for important medical supplies, and by extension, any parts that one might need in a crisis.

The low-latency high-bandwidth services delivered by 5G can help spur the digitization of the factory floor, boosting productivity and increasing flexibility. (25, 26) The result could be a shift to distributed local manufacturing in the U.S. in the post-COVID era, creating jobs and shortening supply chains.

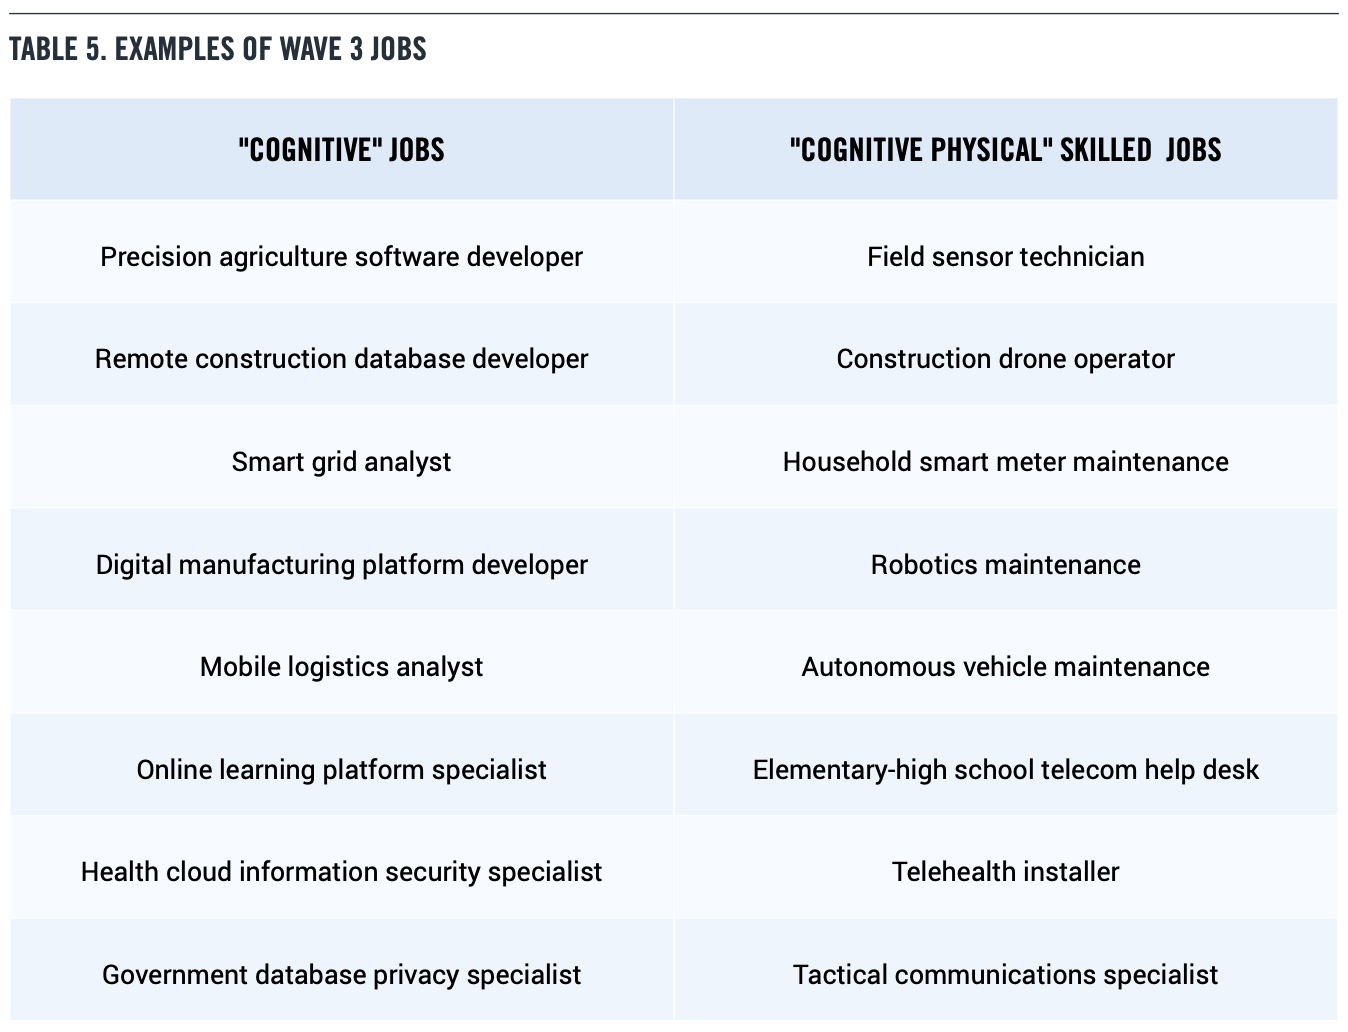
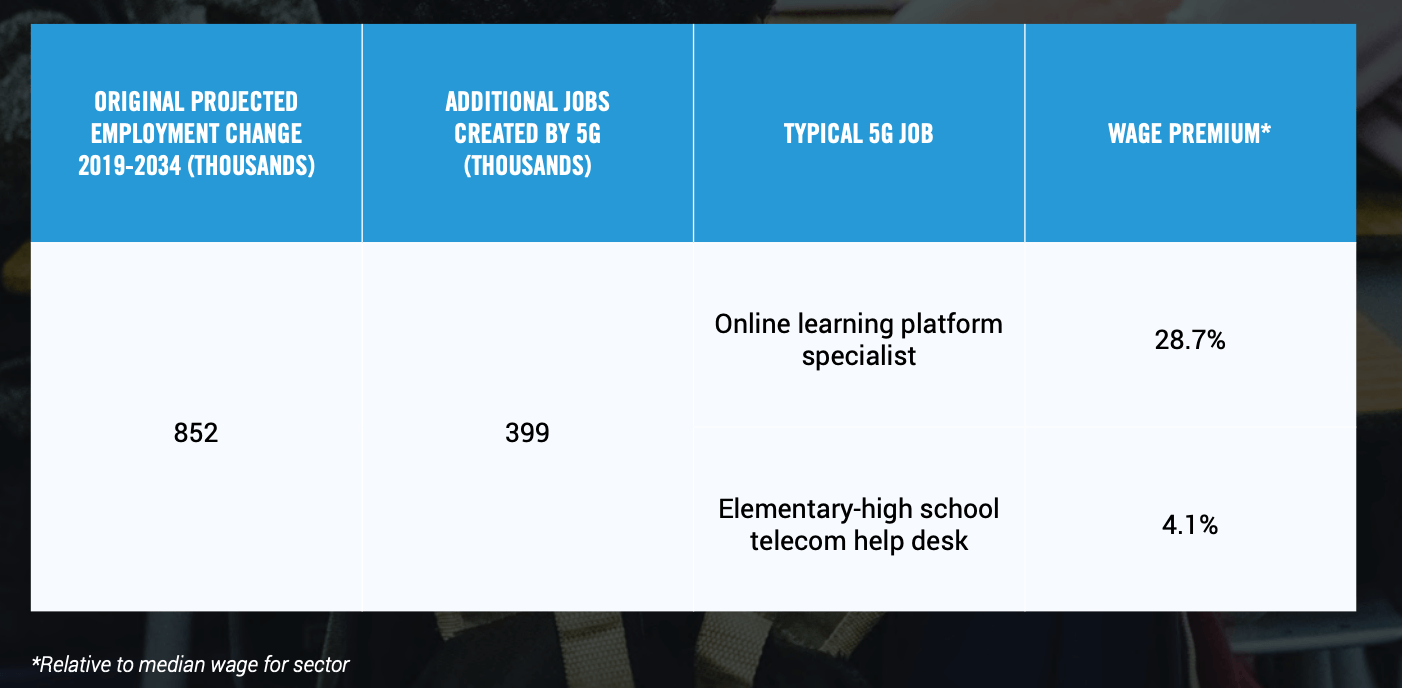
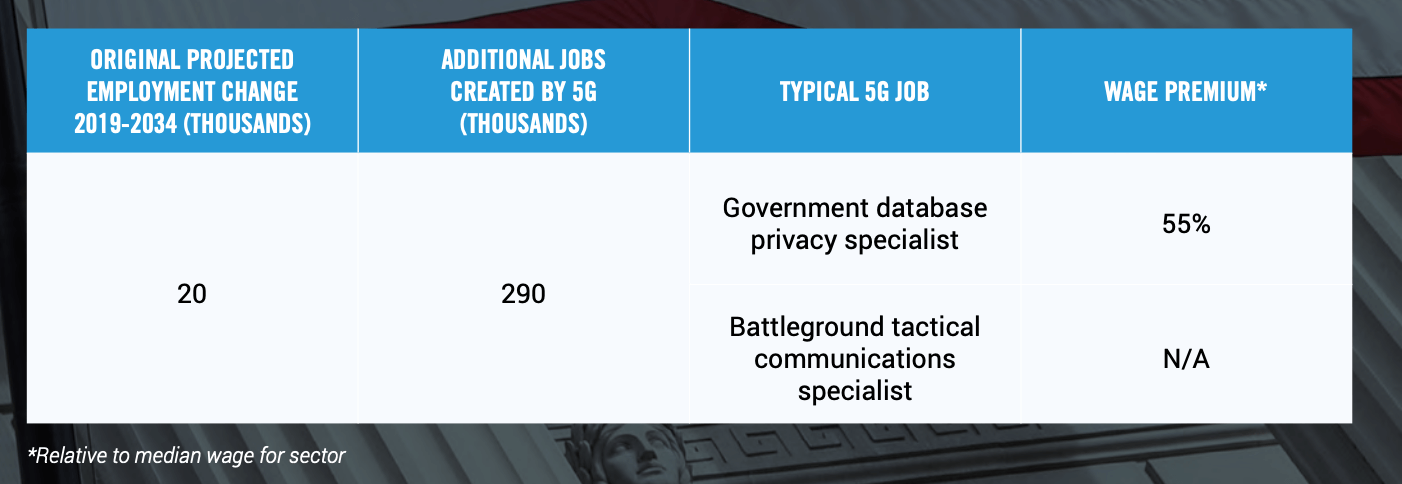
Table 5 identifies examples of Wave 3 jobs. Unlike Wave 2, which mostly generated “cognitive” tech jobs which required a college education, Wave 3 is rooted in the physical world. As a result, Wave 3 will also create mixed ‘cognitive-physical” skilled jobs, many of which fall into the category of installers and maintainers. In addition, people will continue to play an essential role in the supervision loop of advanced robots.

The types of cognitive jobs listed in Table 5 mainly fall into the broad occupational class of “computer and mathematical occupations.” Relative to the median wage for all occupations, these jobs pay a wage premium of 122 percent.

But Wave 3 will also generate blue-collar jobs that use a combination of manual and problem-solving skills—what we call “cognitive-physical” jobs— which are likely to pay a wage premium as well.

Today, the median wage for telecommunications equipment installers and repairers is 45 percent higher than the overall median wage, according to figures from the BLS. As 5G becomes an integral part of business operations, we would expect such jobs to become more valuable rather than less.

III. QUANTIFYING LONG-TERM 5G-RELATED JOBS

Estimates of job growth spurred by a new technology have to be measured against some baseline. As we noted earlier, the BLS projection methodology typically looks backward, not forward, and has a difficult time dealing with ongoing technological changes. BLS projections have consistently understated the job impact of wireless innovation. In the first wireless wave, jobs in the wireless industry came in 50 percent above projections. In the second wireless wave, the rise of the App Economy drove up demand for computer and mathematical jobs 21 percent above BLS projections as of 2019.

Our fundamental assumption is that unlike the second wave—which was mostly focused on digital industries—the third wave will drive demand for both cognitive and cognitivephysical jobs across the whole range of physical and digital industries. The third wave will therefore benefit a wider set of Americans and regions than the second wave did. We therefore adopt a simple and straightforward approach to estimating the impact of 5G on jobs. We start with the latest BLS industry and occupation projections, issued in September 2019, for the 2018-2028 period. We rebase them to 2019 and extend them to 2034 to get a 15-year projection.

Then we assume that the additional jobs produced by 5G in the third wave, relative to the baseline, are the same magnitude as the additional jobs produced by wireless innovation in the second wave. We then allocate these jobs across industries according to their size, rather than focused on only tech. Finally, we then apply a conservative job multiplier.

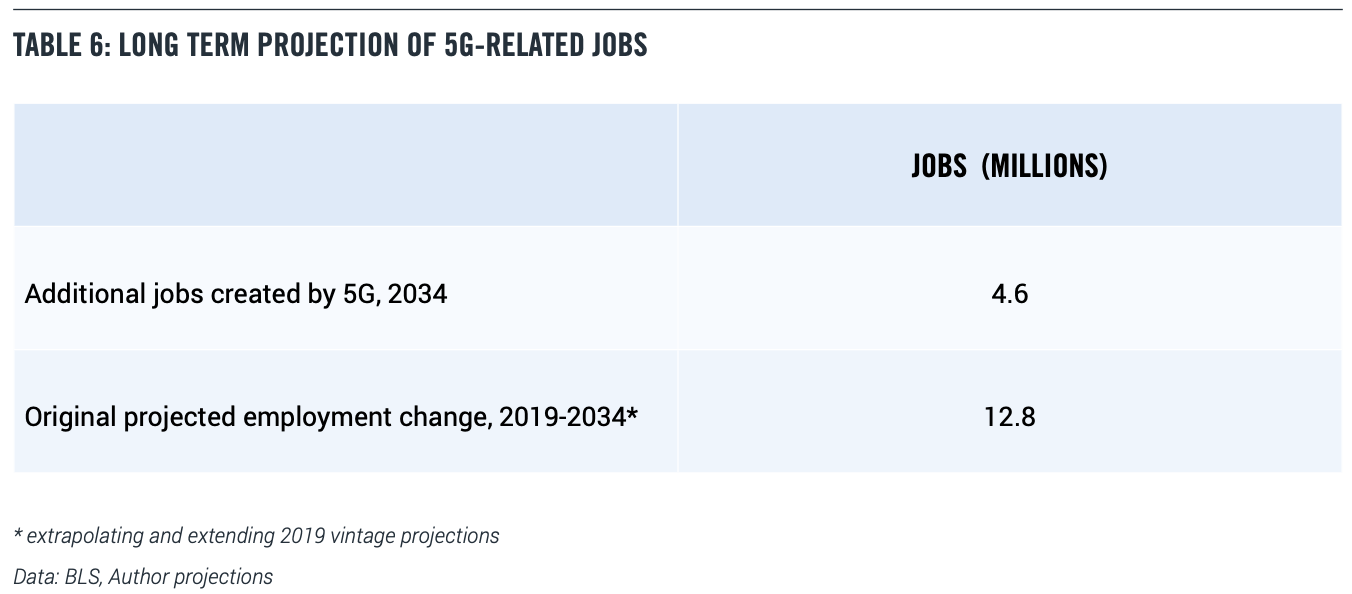
Based on these assumptions, we estimate that 5G and related technologies will produce an additional 4.6 million jobs in 2034 relative to the baseline original projected growth of 12.8 million.

When we say ‘additional’ we mean that 5G-driven job growth is an additional factor that the conventional projections do not take into account. In an important sense, 5G job creation is a countervailing force to job destruction from automation and globalization. These are higher paying jobs that will replace jobs that are lost.

Past Reports Projecting 5G impact On Jobs

In 2017, Accenture released a report estimating wireless operators will directly invest $275 billion between 2017 and 2024 in 5G infrastructure, creating up to 3 million jobs and boosting GDP by $500 billion.27 Of the $275 billion investment, $93 billion was estimated to be spent on construction, with the remainder being allocated to network equipment, engineering, and planning. Importantly, the report recognized this growth will be spread across communities of all sizes. “Small to medium-sized cities with a population of 30,000 to 100,000 could see 300 to 1,000 jobs created. In larger cities like Chicago, we could see as many as 90,000 jobs created,” the authors wrote.

More recently, a report on the global economic impact of 5G was released in November 2019 by IHS Markit, updating a 2017 study. (28) This report looked at several measures of 5G impact. First, the report forecast that between 2020 and 2035, global real GDP would grow at an average annual rate of 2.5 percent, with 5G contributing almost 0.2 percent of that growth. Second, the report looked at the seven leading countries for 5G—the United States, China, Japan, Germany, South Korea, the United Kingdom, and France—and found that the collective investment in R&D and capital expenditures by firms that are part of the 5G “value chain” within these countries will average over $235 billion annually, measured in 2016 dollars. The U.S. and China each accounted for about one-quarter of global spending on 5G R&D and capital expenditures. Third, the IHS Markit report estimated that 22 million jobs would be supported by the 5G value chain globally in 2035, with 2.8 million of those jobs in the United States.

Most recently, two economists at NERA Economic Consulting, Jeffrey A. Eisenach and Robert Kulick, estimated the potential job impact of 5G. (29) They found that if 5G adoption followed the path of 4G adoption, then, “at its peak, 5G will contribute approximately 3 million jobs and $635 billion in GDP to the U.S. economy in the fifth year following its introduction.” This employment effect is smaller but faster than the one reported here.

IV. KEY 5G USE CASES

As previously noted, The 5G Revolution will create job opportunities across many sectors and regions in the U.S. In this next section, we identify eight of the most likely use cases that have significant potential for job growth.

1. AGRICULTURE

Agriculture is an industry ripe for transformation. In many areas of the country, it is still heavily dependent on low-cost labor, which may be discouraged because of the pandemic. And as of 2018, only 0.1 percent of agriculture revenues were being spent on telecommunications, a percentage that had dropped slightly since 2007.

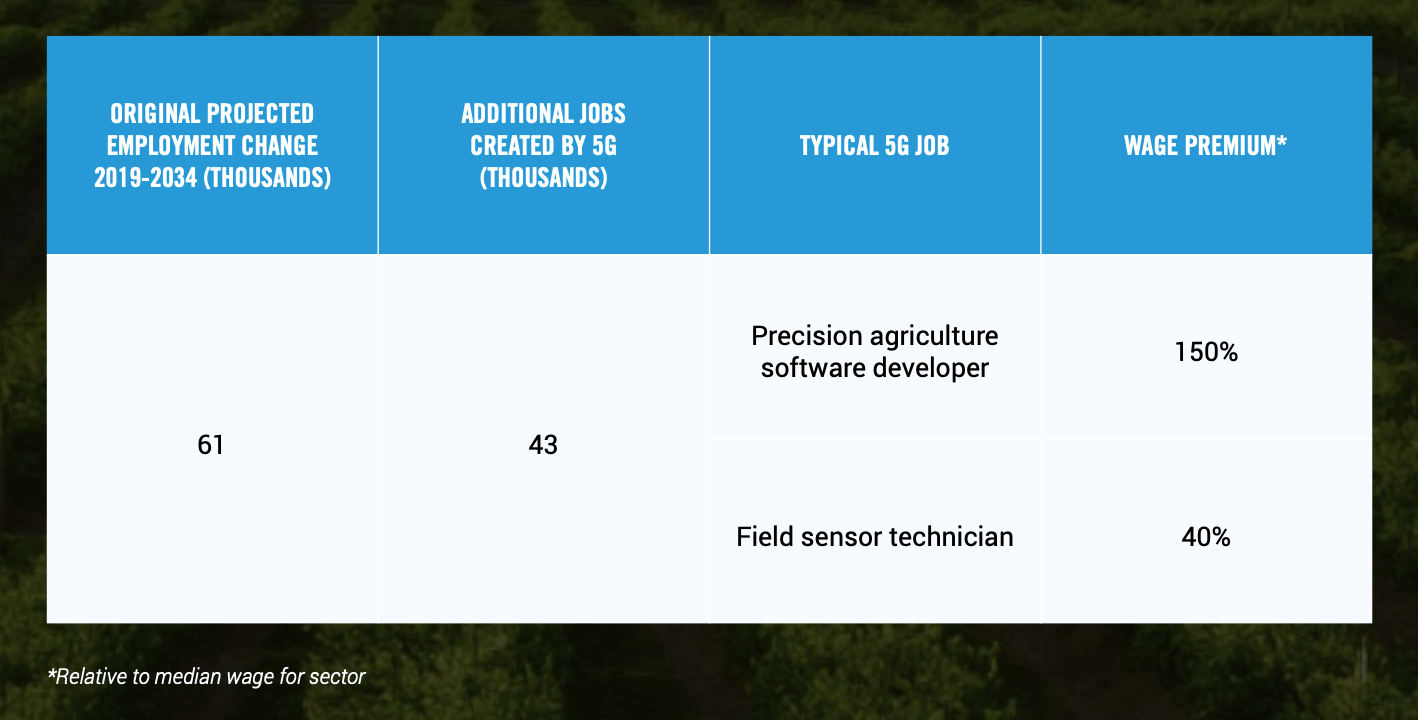
Faced with an evolving environment with increasing temperatures and diverging precipitation levels in wet and dry areas, precision agriculture will rely on an interconnected system of low power sensors, integrated equipment, and data—all powered by 5G—to monitor field conditions and maximize yields while efficiently allocating scarce resources such as water. (30)

To best utilize the new technologies, agriculture will have to build and maintain a new tech and telecom infrastructure and the workforce is only now starting to come into existence. This requires both software developers and people to install and maintain the equipment.

For example, as of March 2020, agriculture technology company Farmers Edge was looking for a precision technology specialist to install equipment and software at its growers’ farms in Madison, Wisconsin.

2. CONSTRUCTION

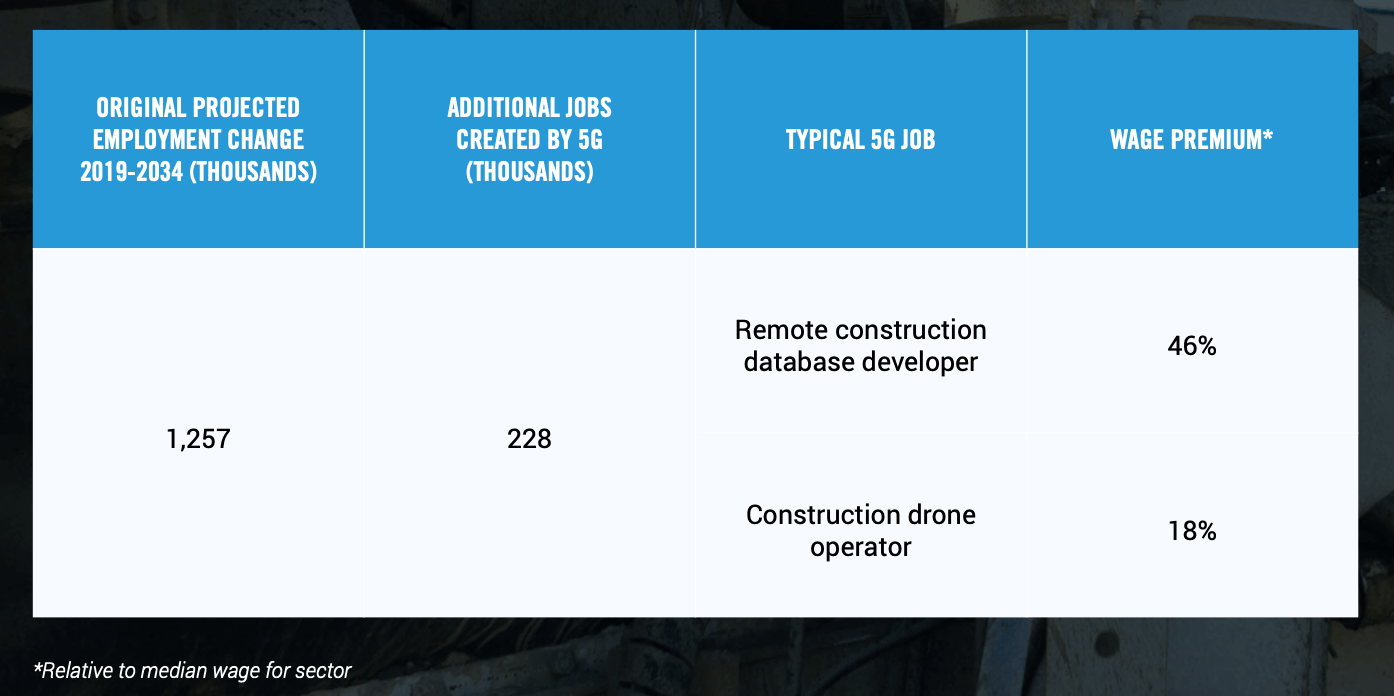
5G plays an essential role in digitizing construction, a key sector which has been plagued by high costs and low productivity in recent decades, especially in public infrastructure. (31) Perhaps not coincidentally, construction is one of the least digitized sectors of the economy. (32)

Since 2000, the cost of construction has risen 118 percent according to the Bureau of Economic Analysis. (33) Highways and streets have become 126 percent more expensive for state and local governments to invest in. (34) By comparison, overall prices in the economy have only risen 41 percent over the same time span. (35)

This increase in the relative price of construction helps explain why U.S. infrastructure seems shoddier and worn-out these days.

A 5G communication grid will allow the seamless and flexible integration of automated equipment and skilled workers on a construction site. Structures will go up faster with fewer dangerous errors, and worksites will be safer. Meanwhile, as 5G helps bring down the cost of construction, demand will rise. Both renovation and new building will be cheaper and faster.

3. UTILITIES

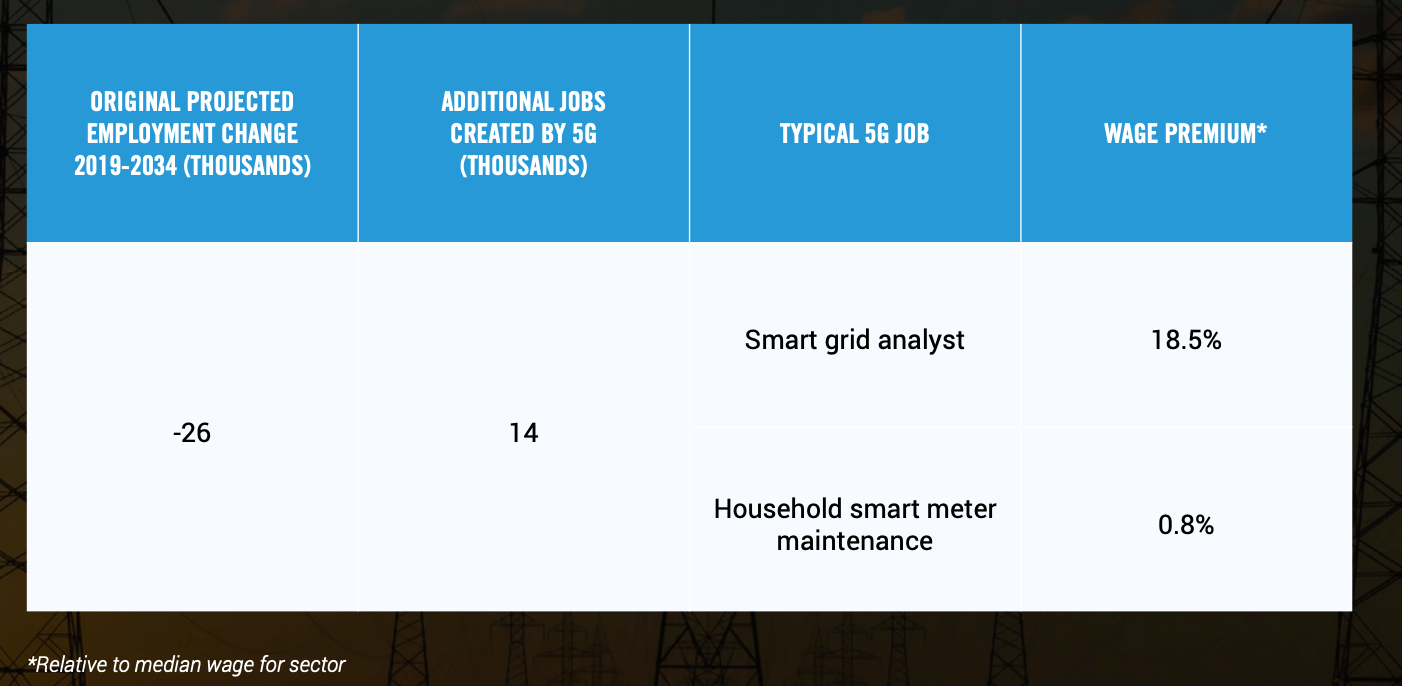
Energy use management is an essential use case for 5G. Utilities are already extensive users of information technology within their own operations to monitor power production and distribution. But 5G makes it much easier to connect up smart meters to the grid to give people and businesses better incentives to control their electric use.

This is one sector where our projection methodology may underestimate the number of new 5G-related jobs. If the energy infrastructure shifts over the next 15 years from fossil fuels to low-carbon energy sources, the opportunities for 5G-enabled workers may be very strong.

4. MANUFACTURING

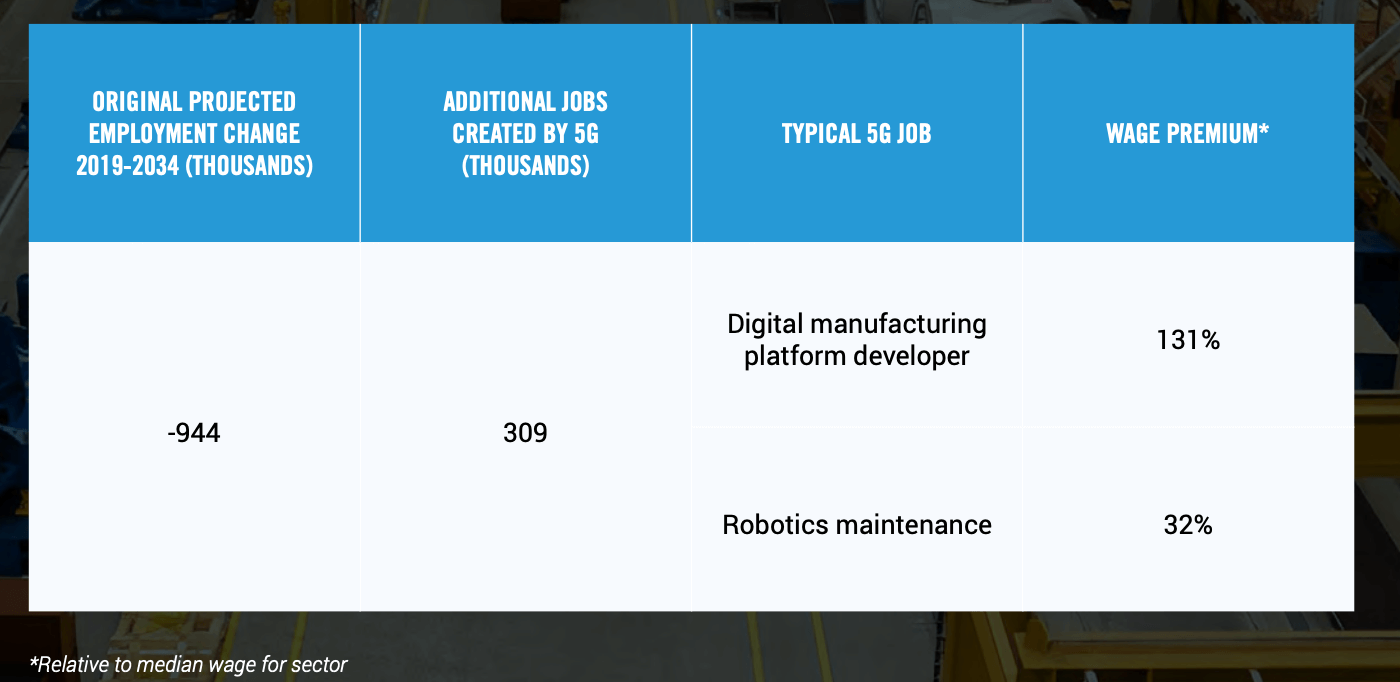
In manufacturing, 5G and digitization will help reduce costs, making domestic manufacturing more competitive. Many manufacturing industries have weak or even negative multifactor productivity growth over the past 20 years. (36) Multifactor productivity growth takes into account the usage of purchased services, energy, capital, and intermediate inputs and is a key measurement of competitiveness. Investment in information technology such as 5G, which manufacturing has lagged in since the early 1990s, will enable new business models that expand markets and enhance domestic competitiveness.

New markets and reinvigorated domestic competitiveness means more jobs in the U.S. Through a combination of digitized distribution, digitized production, and new manufacturing platforms – coined by PPI as the Internet of Goods – a new network of smallbatch and custom goods factories will likely arise. Importantly, these industrial startups will fuel job creation in low-density areas and former industrial hubs like the Midwest and upstate New York, as physical industries like manufacturing dominate these economies. That means more domestic production and less imports. (37)

5. TRANSPORTATION AND WAREHOUSING

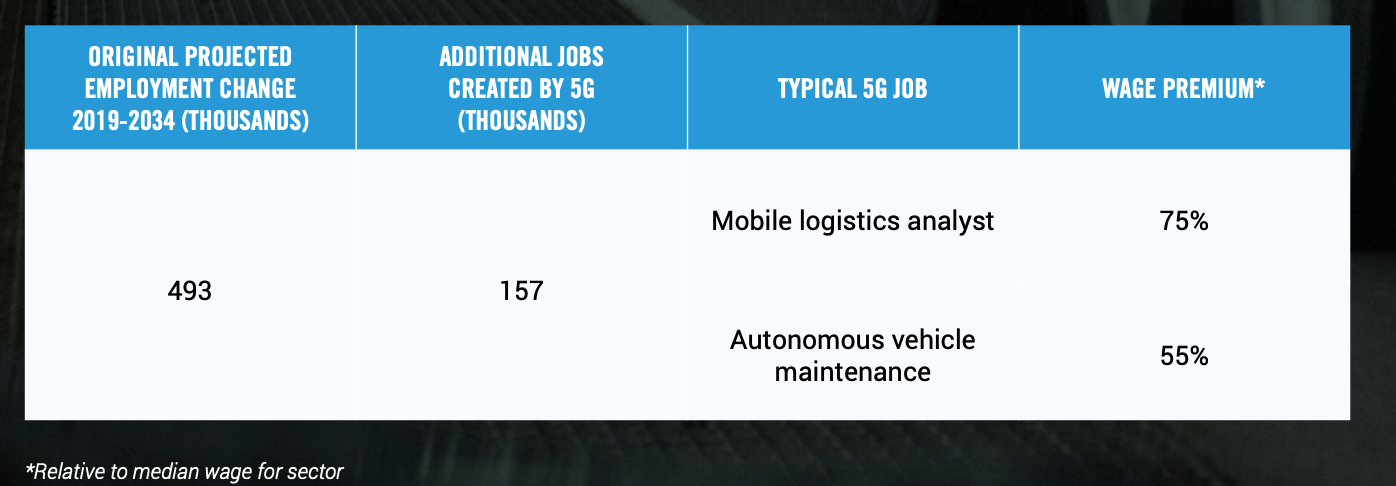
5G will transform how people and goods move from point to point and how cities manage traffic. This has major implications for industries ranging from defense and transportation to logistics and delivery.

Low-latency 5G connections will accelerate the roll-out of fully autonomous trucks and cars. But the flip side is that these vehicles will have to be maintained to a very high standard to keep them safe, creating more jobs for skilled technicians, and compensating for the loss of truck driver jobs.

These capabilities depend on the speed of 5G to rapidly relay data. In trucking, a report by McKinsey recognizes, “sixty-five percent of the nation’s consumable goods are trucked to market. With full autonomy, operating costs would decline by about 45 percent, saving the US for-hire trucking industry between $85 billion and $125 billion.” (38) This savings from automated trucking could be passed onto consumers in the form of lower prices. Delivery drones stand to further disrupt how goods are delivered.

And in traffic management, traffic signals will be based on real-time traffic flow rather than timed stoplights. Pittsburgh recently introduced smart traffic lights and saw travel times cut by 25 percent. (39) These innovations reduce the need for drivers and increase the need for maintenance and road workers as driving and delivery become less physically intensive and goods can be moved around the clock.

The creation of new types of jobs is already starting. As of March 2020, transportation services company Transdev Services was hiring a self-driving vehicle operator in San Francisco, California. Technology platform Argo AI was seeking an autonomous vehicle system test specialist responsible for operating its autonomous test platforms in Miami, Florida. And transportation services firm MV Transportation was searching for an autonomous vehicle attendant tasked with ensuring the safe operation of the Autonomous Vehicle in Corpus Christi, Texas.

6. EDUCATION (PUBLIC AND PRIVATE)

Students and teachers at all levels were forced to adopt virtual learning in 2020 because of the pandemic. Reports from the field have been mixed. The technology in many cases was not up to the task, and many students, especially in low-income neighborhoods, were caught on the wrong side of the digital divide. If schools want to engage in virtual learning, they will need a technology like 5G with the bandwidth for students and teachers to fully engage.

A related issue is training of workers on new equipment and processes. As 5G moves into the workplace, it will transform the way that physical industries such as manufacturing and healthcare do business. In order for workers to stay relevant, the training technology has to become 5G-enabled as well.

7. HEALTHCARE

As with education, the pandemic forced healthcare providers to adopt ad hoc telehealth practices without the proper technology. 5G will provide the framework in which providers can truly practice healthcare at a distance. Moreover, 5G is essential to unlocking quality healthcare for rural, low-density areas because of its ability to support real-time high-quality video, transmit large medical images, and enable real-time remote monitoring.

Maintaining the telehealth infrastructure will be a core function at hospitals, which will employ skilled telehealth technicians, just like they have lab technicians and nurses. Clinical information will flow wirelessly into electronic health records, requiring specialized database specialists who are trained in the medical and privacy requirements of these types of data. As of late April, Beth Israel Lahey Health of Beverly, Massachusetts was looking for a “telehealth installer.”

8. GOVERNMENT (EXCEPT EDUCATION)

We can divide the impact of 5G on government into military and civilian uses. On the military side, a March 2020 report from the Congressional Research Service noted: “5G technologies could have a number of potential military applications, particularly for autonomous vehicles, command and control (C2), logistics, maintenance, augmented and virtual reality, and intelligence, surveillance, and reconnaissance (ISR) systems—all of which would benefit from improved data rates and lower latency (time delay).” (40)

In fact, the USDOD has already released several Requests for Prototype Proposals for test beds focusing on AR/VR for training, smart warehouses and dynamic spectrum sharing. All of these potential applications generate new human resource demands as well. As the capabilities of 5G evolve, it becomes more important than ever to best make use of resources, both in terms of equipment and people. For example, as of summer 2020, The Aerospace Corporation was looking for a “5G and Internet of Space Things Wireless Network Engineer” with the ability to obtain a U.S. security clearance.

On the civilian side, “smart cities” development will mean that state and local governments will have to transform all of their services to 5G, from waste collection to police to property tax assessment. And that will, in turn, mean a workforce much more heavily oriented towards maintaining and repairing the necessary telecom equipment.

Where Will Wave 3 Jobs be Located?

Both the first and second wave of wireless jobs were concentrated in dense digital cities like San Francisco, New York and Boston.

Table 7 shows examples of top “digital” areas, as ranked by the share of local GDP coming from the information sector, the financial services sector, and the professional services sector (which includes law, engineering, and accounting, as well as computer programming).

Not surprisingly, the list of the top digital metro areas is headed by New York and San Francisco. There’s one important caveat: for confidentiality reasons, the Bureau of Economic Analysis suppresses some data, so we can’t calculate the digital share for all metro areas.

EXAMPLES OF TOP DIGITAL METRO AREAS

1. Boston-Cambridge-Newton, MA-NH

2. Boulder, CO

3. New York-Newark-Jersey City, NY-NJ-PA

4. San Francisco-Oakland-Berkeley, CA

5. Seattle-Tacoma-Bellevue, WA

*Listed alphabetically. Inclusion based on digital share, which measures the share of the information, financial services, and professional services sectors in overall metro GDP Data: BEA

By contrast, Wave 3 will benefit those areas which are more balanced in terms of digital and physical industries. Table 9 shows some examples of such areas. These areas are not tech deserts, for sure, but they are well-positioned to take advantage of the opportunities offered by 5G.

EXAMPLES OF BALANCED DIGITAL/PHYSICAL METRO AREAS

1. Albany-Schenectady-Troy, NY

2. Ann Arbor, MI

3. Baltimore-Columbia-Towson, MD

4. Buffalo-Cheektowaga, NY

5. Cleveland-Elyria, OH

6. Colorado Springs, CO

7. Detroit-Warren-Dearborn, MI

8. Harrisburg-Carlisle, PA

9. Huntsville, AL

10. Jacksonville, FL

11. Kansas City, MO-KS

12. Lincoln, NE

13. Pittsburgh, PA

14. San Antonio-New Braunfels, TX

*Listed alphabetically. Inclusion based on digital share, which measures the share of the information, financial services, and professional services sectors in overall metro GDP Data: BEA

V. SHORT-TERM SNAPSHOT: THE IMMEDIATE IMPACT OF 5G

So far, we have been discussing the longterm job impact of 5G. But in the wake of the COVID-19 pandemic, we need to be concerned about the short-term job impact as well. In this section, we show that current 5G build-out and engineering activities has already created 106,000 jobs as of April/May 2020 (Table 9).

Estimating 5G Network Build-out Jobs

Network build-out activities, of course, consist of installing 5G small cells around the country, including their backhaul connections. In some cases, the technicians and installers are employed directly by the carriers, while in other cases they are contractors. These are cognitive physical jobs, in the sense that we discussed earlier in the rep

ort. We get data on this employment from two different sources. First, the BLS track

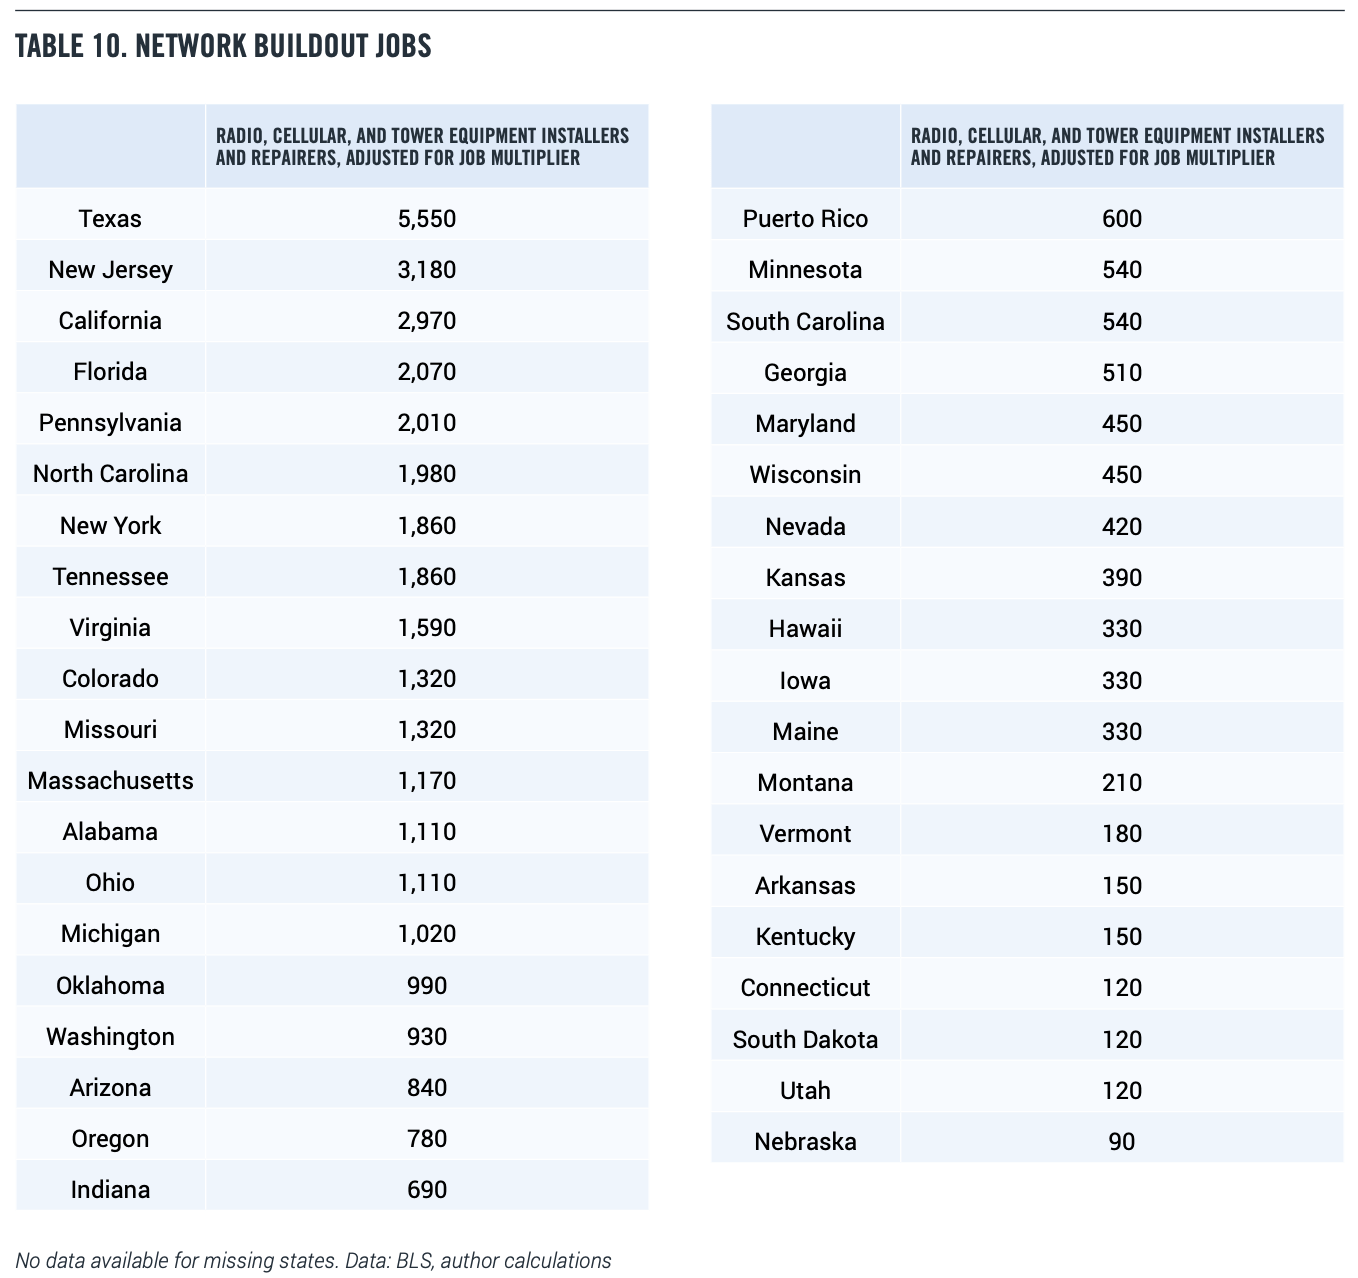
s the number of “Radio, Cellular, and Tower Equipment Installers and Repairers” in its Occupational Employment Statistics (OES). (41) As the name suggests, this category includes the workers who install 5G access points. As of May 2019, the last data available, there were 14,370 workers in this occupational category, with a relative standard error of 5.8 percent. Factoring in a conservative job multiplier, that gives us a net job impact of 43,000.

How are those jobs distributed? The top state according to the BLS data is Texas, followed by New Jersey, California, and Florida. These figures were as of May 2019 and based on several years of rolling surveys (Table 9).

Of course, the location of build-out activity changes over time as providers finish with one area for now and shift their construction activities to other area. To understand current 5G construction activity, we turn to another data source: publicly available job postings. These job postings contain information on the location of jobs and also the skills needed. For example, one company is advertising for a “Tower Top Hand” with 5G experience in the Baltimore area.

The database of job postings that we use comes from Indeed.com, which identifies itself as “the #1 job site in the world.”(42) Indeed’s real-time database of job postings is full-text Booleansearchable, including by title, location and by age of job posting.

We searched for job postings with the terms “tower” or “technician” in the title, and 5G in the body of the posting. This allowed us to identify “hot spots”—metro areas where there was current hiring activity for workers installing 5G networks (Table 11).

As of early May, companies are hiring for tower technicians in areas such as Allentown, Pennsylvania and the Baltimore metro area, as telecom providers extend their 5G networks outside of the densest high-income urban areas. Indeed, local news publications in these areas show evidence of discussions about ongoing deployments. (43)

Current 5G Engineering and Software Jobs

Making 5G a reality will also require hiring in engineering and software development. But unlike cell and tower installers and repairers, there is no obvious BLS occupational category that matches up well to 5G engineers and software developers.

To understand the prevalence and location of 5G engineers and developers, we further analyze the universe of online job postings, using a methodology that was developed to estimate the number and distribution of App Economy jobs.

These job postings contain information on the location of jobs and also the skills needed. For example, in late April and early May 2020, Commscope was advertising for an “Engineer, Principal 5G Systems” in Richardson, Texas. Epsilon Solutions was advertising for a contract “Wireless Core Engineer” to “test, deploy and debug DISH’S standalone 5G network” in Denver, Colorado. And KaRDS Cyber Solutions in Annapolis Junction, Maryland was advertising for a “5G Wireless SME / Senior Systems Engineer Level 6.” This position required a “TS/ SCI clearance with polygraph.

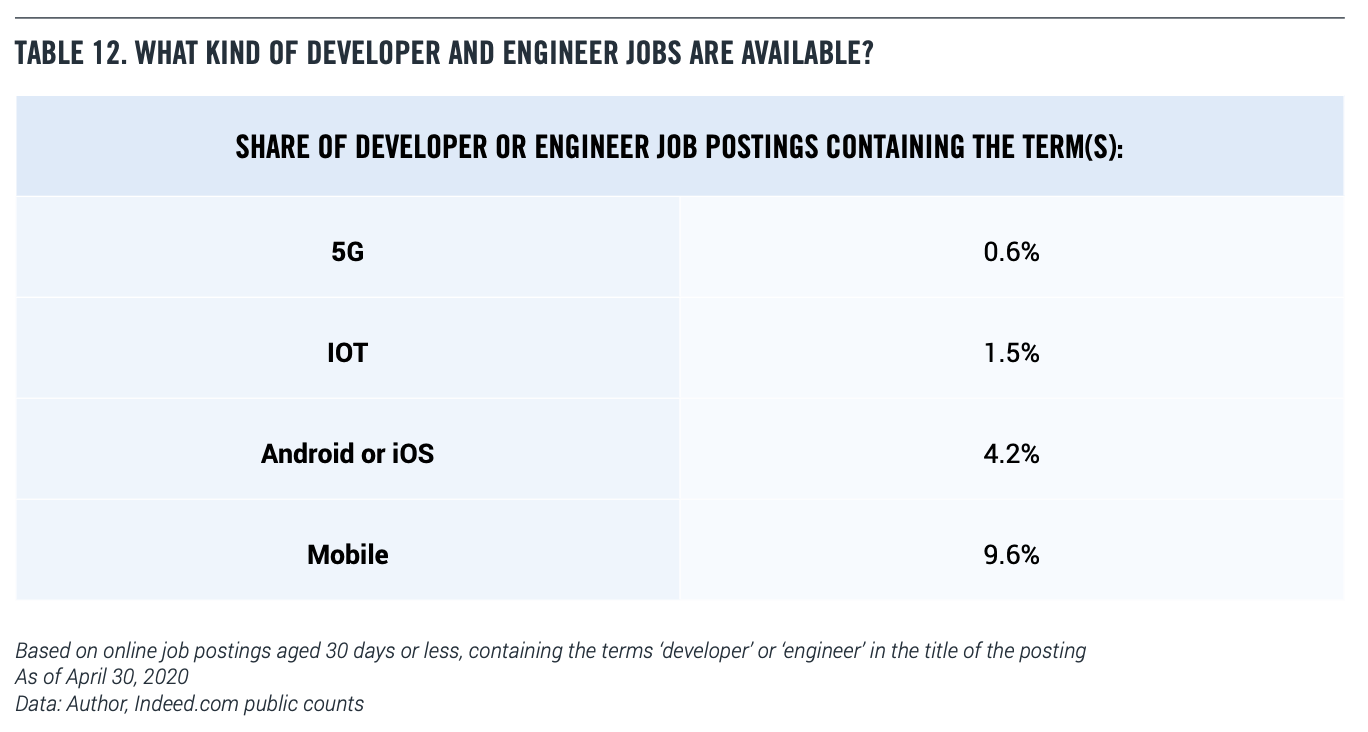
We started by searching for job postings with the words “engineer” or “developer” in the title, with postings aged 30 days or less. This gave us our initial pool of roughly 50,000 postings nationally as of the end of April. Generally speaking, our past research has suggested that searches with no age limit work better, but because of the pandemic-related shutdowns, we decided to focus on the more recent job posts.

Within that pool, roughly 0.6 percent contain the term 5G. By contrast, job postings containing the terms IoT, Android or iOS, or mobile are far more common (Table 12). We then use this share of job postings to estimate the share of jobs (see Appendix). There are roughly 1.75 million engineers, and an equal number of software developers, according to BLS. Taking 0.6 percent of that total comes to roughly 21,000 jobs, and then accounting for the multiplier gives us 63,000 5G-related engineering related jobs.

A First Look at China

We gain some insights into the Chinese 5G labor market through analysis of online job postings in both English and Chinese, as collected by Indeed.com. This approach is limited because of the lack of visibility into hiring by key 5G companies such as Huawei, China Telecom, and Tencent, so we cannot arrive at an overall number. Nevertheless, even a preliminary analysis may be useful.

We consider job postings which include ‘5G’ in the title and were released 30 or fewer days ago. For example, in the U.S., CommScope posted an opening for a 5G Systems Architect. As of August 17, 2020, the U.S. had 85 such new postings, compared with 125 for China. As noted, the China sample is significantly incomplete.

To put these numbers into some context, over the same period, the U.S. had 14370 new postings with ‘software’ in the title, while China had 4137 new postings with ‘software’ in the title (in either Chinese or English). That suggests the intensity of Chinese hiring of 5G personnel, relative to hiring of software personnel overall, is higher than in the U.S.

These jobs are very heavily concentrated in a relatively small number of states. California and Texas by themselves account for almost 50 percent of 5G engineering job postings. This makes sense given the location of the leading companies in the 5G space.

VI. THE KEY INPUT TO 5G JOBS: CAPITAL INVESTMENT AND SPECTRUM ACCESS

5G is a capital-intensive investment by its nature. To realize its benefits, wireless operators must invest in R&D and capital expenditures in engineering and network buildout. In a 2017 study, Accenture estimated wireless operators will invest $275 billion from 2017 to 2024, $93 billion of which will be spent on construction. (44) Indeed, via its Investment Heroes series, PPI estimates the major wireless operators have invested more than $150 billion in the United States since 2016, much of which has gone towards 5G R&D and deployment. (45, 46)

The portion of spectrum to be most used for 5G is divided into two categories: millimeter wave (above 24 GHz) and sub-6 (6 GHz and below). (47, 48) Each of these spectrum ranges will play a vital role in bringing 5G products and services online. While mmWave has the fastest speeds, it has limited range and is not able to tolerate much interference like walls or rain. (49) In the sub-6 spectrum, the range is better than that of the mmWave, but speeds are reduced. While mmWave will be utilized in dense population areas such as downtown areas and stadiums to transmit data, sub-6 will be critical to providing access to IoT products in suburban and rural areas.

Spectrum for commercial use is controlled by the Federal Communications Commission (FCC). One of the ways the FCC distributes spectrum is by auctioning licenses, with the proceeds going to the Treasury Department. Since 1994, the U.S. government has raised over $100 billion in revenue from wireless companies participating in FCC spectrum auctions. (50) The FCC’s first 5G spectrum auction, the mmWave of 28 GHz, was conducted in November 2018.51 The FCC followed by auctioning the 24 GHz band in March 2019, and the 37, 39, and 47 GHz bands in December 2019. (52, 53)

Much of the spectrum used by mobile networks to date have been concentrated in the sub-6 bands of 600 MHz to 2.6 GHz. These mid- to low-bands are likely to be used for 5G as well to achieve wider geographical coverage. As of April 2019, the FCC had awarded 716 MHz of spectrum below 3 GHz. (54) Additionally, the FCC has designated the 2.5 GHz band to “be available for commercial use via competitive bidding”. (55) The FCC ran an auction the 3.5 GHz band in July and August 2020. (56) And in February, the FCC ordered satellite operators in the 3.7- 4 GHz range to relocate, freeing the space for reallocation by December 2023. (57)

The other mechanism by which the FCC distributes spectrum is by allowing unlicensed use of certain spectrum – for purposes such as Wi-Fi. Under this regime, operators can use designated airwaves to transmit data without getting permission from the FCC. (58) However, the lack of exclusivity in unlicensed bands means an increased risk of interference. In March 2019, the FCC freed up the 116-123 GHz, 174.8-182 GHz, 185-190 GHz, and the 244-246 GHz bands for unlicensed use. (59) And in April 2020, the FCC proposed rules to make the entire 6 GHz band available for unlicensed use. (60)

International Comparisons of Spectrum Allocations

In April 2019, Analyses Mason released a report summarizing certain countries’ spectrum allocations. (61) The countries had comparable amounts of spectrum below 3 GHz awarded, with the U.S. coming in first at 716 MHz, Australia in second at 690 MHz, Germany at third with 689 MHz, Canada fourth with 648 MHz, and the United Kingdom rounding out the top five with 647 MHz. Asian countries have allocated similar amounts of spectrum below 3 GHz, with Japan at 601 MHz, Hong Kong at 583 MHz, China at 582 MHz, and South Korea at 477 MHz.

Awarded spectrum from 3-24 GHz had greater variation among countries. “Whilst many countries have now awarded over 100MHz of (exclusive nationwide) spectrum to mobile, several countries (China, Italy, and Spain) have awarded 300MHz or more,” the authors write. Following those three countries were South Korea, the U.K., Australia, Japan and Qatar – all with 200 MHz or more allocated. Notably, the U.S., Canada, France, Germany, and Hong Kong had not awarded any of this spectrum as of April 2019. As previously mentioned, sub-6 spectrum is a critical component to delivering new 5G products and services outside of high population density areas because of its ability to travel long distances while still providing 5G speed.

In the mmWave range, only the U.S., South Korea, and Italy had awarded spectrum. The U.S. had awarded 2,500 MHz, South Korea 2,400 MHz, and Italy 1,000 MHz as of April 2019. Other countries in the analysis had mmWave allocations planned, ranging from the second half of 2019 to 2021. The U.S. leads in the total amount auctioned or planned to be auctioned at about 7 GHz, followed closely by China at 6 GHz, and Canada at nearly 5 GHz. Australia, France, Germany, Spain, Sweden and the U.K. all planned to assign around 3 GHz.

A broader February 2020 analysis of countries conducted by Global Mobile Suppliers Association found 40 countries have completed allocations of 5G suitable spectrum since 2015. (62) “A total of 54 countries have announced plans and approximate dates for allocating 5G-suitable frequencies with timelines for completion between now and end-2022,” the authors note.

The economic and national security implications of 5G are why the U.S. needs a long-run spectrum plan. In September 2018, the FCC unveiled its ‘5G FAST’ plan, detailing the previously discussed spectrum that it intends to make available for 5G services. (63) In October 2018, the Trump Administration issued a presidential memorandum directing the Department of Commerce to create a National Spectrum Strategy, but the strategy has not yet been released.

VII. POLICY IMPLICATIONS AND CONCLUSION

There are four important policy issues when it comes to 5G. First, as we have been discussing, is spectrum. As 5G opens up the physical industries to joining the digital economy, it becomes ever more imperative to have a longterm spectrum plan. Unlicensed spectrum, sub-6 spectrum, and mmWave spectrum all serve different purposes in the 5G ecosystem but are critical to realizing the full economic benefits of 5G.

The amount of spectrum suitable for 5G use is limited and thus needs to be allocated efficiently. Policymakers should prioritize a long-term spectrum plan that frees up more licensed and unlicensed spectrum, provides certainty for auctions in terms of cost and scheduling, streamlines government licensing and renewals, and encourages long-term investment in 5G networks.

5G is also critical to national competitiveness and security. As an April 2019 report from the Defense Innovation Board recognizes, leadership in 5G carries economic and national security advantages such as rapid communication systems, enhanced decision-making and strategic capabilities, better technology, standard setting, and job creation. (64) But, as the report notes, the physics of mmWave are challenging. Additionally, the sub-6 band is crowded with incumbent systems and uses, large portions of the spectrum are government owned and commercially limited, and there are concerns the Defense Department could experience reduced capability if it is required to share its sub-6 spectrum. While the Trump Administration has directed the Department of Commerce to create such a National Spectrum Strategy, it has not yet been released. For the U.S. to meet the challenges ahead, a national spectrum plan must carefully balance the government’s needs and what 5G will require in the long-term.

The second policy issue is increased government usage of 5G across both military and civilian activities. The public sector should be a leader in exploring cutting edge uses of 5G in areas like the delivery of government services and battlefield control-and-communications.

Third, Congress should be willing to invest heavily in the development of 5G and successor technologies. That’s essential if the U.S. is to keep up with foreign competitors, who are already focused on the military uses of so called 6G. (65) The federal government must start investing heavily in telecom research and development. The money should be split between nonprofits and for-profit companies, and the goal should be to create a new set of standards that American companies can build on.

And finally, the U.S. should make a significant investment in job training. The U.S. needs to double down on traditional STEM fields and encourage more people in America to go into engineering and math. Beyond that, we need a national skills initiative and mentoring programs to ensure that this new generation of workers will have the training needed to support the cognitive-physical jobs that the 5G Revolution is already beginning to create.

Methodology Appendix

In this paper we estimate both the long-term and short-term job impacts of the 5G Revolution, using different methodologies. Our 15-year estimates build on BLS employment projections, and assume a scenario where the employment impact of 5G is of the same percentage magnitude as the employment impact of Wave 2. The short run current job impact of the 5G build-out is estimated by a combination of BLS data and real-time job postings.

Context There are three main approaches for modeling the occupational impact of new technologies:

1. Consensus-based extrapolation of existing occupation-industry matrix, subject to industry employment constraints

2. Analysis of substitution effects of new technology on existing occupations

3. Modelling of new job creation by new technologies based on analysis of job impact of existing technologies. We call this the “bootstrap” approach.

Occupation-industry matrix In the United States (Bureau of Labor Statistics 2019), Canada (Canada Employment and Social Development Canada,2020), and other OECD countries, the main approach to modeling future occupational growth uses a detailed occupationindustry matrix. Industry growth is projected based on a macroeconomic model and an assumption of full employment, and “small changes” are made in the future coefficients of the occupation-industry matrix.

Because of their size and comprehensiveness, these models tend to be unique for their country. The BLS notes that “there are no comparable projections which are not in some way derived from BLS projections.”

However, such models in practice are not designed to pick up the occupational impact of disruptive technologies or the creation of new occupations. Indeed, the BLS explicitly benchmarks its model against what it calls the “occupational–share naïve model,” where the occupational share doesn’t change over time (BLS 2020).

Substitution effects of new technology

Frey and Osborne (2017) is the best-known example of projecting the potential substitution effects of new technology. By examining the tasks associated with particular occupations, they estimated that about 47 percent of total US employment is at risk of computerization.

However, the authors stress that their models only focus on the substitution effect of new technology, and provide no information at all about the job creation aspects of technology.

However, we make no attempt to forecast future changes in the occupational composition of the labour market. While the 2010-2020 BLS occupational employment projections predict US net employment growth across major occupations, based on historical staffing patterns, we speculate about technology that is in only the early stages of development. This means that historical data on the impact of the technological developments we observe is unavailable. We therefore focus on the impact of computerisation on the mix of jobs that existed in 2010. Our analysis is thus limited to the substitution effect of future computerisation.

For this reason, the substitution effect approach is inappropriate for this project.

Bootstrap approach

What we call the “bootstrap approach” uses the employment effects of previous technological advances to project the impact of future technologies. Shapiro and Hassett (2012) estimated the employment impact of 3G, and used that to project the impact of 4G. Accenture (2017) used the Shapiro-Hassett results for 3G to project the impact of 5G. Eisenbach and Kulik (2020) estimated the employment impact of 4G, and used that to project the impact of 5G.

In this project, we use the bootstrap approach, taking into account the new characteristics of 5G compared to 4G. We model the employment impact of 5G as a deviation from the BLS baseline forecast, based on the observed magnitude of the 4G deviation.

But whereas the employment impact of 4G was completely concentrated in white collar jobs and digital industries, we model the employment impact of 5G as extending to blue-collar jobs that use a combination of manual and problem-solving skills—what we call “cognitivephysical” jobs. Moreover, we model the industry impact of 5G as extending over the entire economy, including physical industries such as manufacturing, agriculture, and defense.

Here’s where the genuinely disruptive nature of 5G comes into play. We expect 5G to enormously increase telecom usage by physical industries, as 5G becomes an integral part of operations. However, as of the 2018 input-output data from the Bureau of Economic Analysis, telecom usage is still an extremely low share of intermediate inputs for many industries (see Table 4). As a result, current telecom usage is not a useful guide as to what industries will add workers with 5G.

In addition, to the degree that 5G usage is integrated into operations in physical industries, we would expect that the number of telecom installers and maintainers would increase. That has not yet happened under 4G. Indeed, the number of telecom installers and maintainers fell in 2019, according to BLS data (346K in 2018, versus 315K in 2019).

When dealing with technological trends that have not yet appeared in the official data, it is preferable to adopt the smallest number possible of conservative assumptions. In this case the model uses the employment category of “telecom installers and maintainers” as a proxy for skilled blue-collar, or “cognitive physical” jobs generated by 5G, as described on page 40 of the report. The model uses the employment category of “computer and mathematical occupations” as a proxy for cognitive jobs generated by 5G. And the model distributes the number of 5G jobs across all industries in proportion to their total employment. The model generates a conservative projection of 5G jobs by industry, based on the employment performance of 4G plus a small number of additional assumptions about the difference between 4G and 5G.

We recognize that totally new occupations generated by 5G might fall outside those categories 15 years from now. But given that 5G is just rolling out right now, we don’t have the data necessary, for example, to produce a credible forecast of the number of precision sensor installers that the agriculture sector will need to hire in 2033.

We also note that both the short term and long term models are completely agnostic about whether the 5G networks are built by the current cellular operators or by private enterprise. In fact, that is a strength of the methodology that we use. Industry-specific data was used to analyze Wave 1. But Wave 2 and Wave 3 are modeled based on occupational data which does not reference the cellular operators at all.

Long-term Estimate

The BLS regularly lists projections of employment trends by occupation and industry. As we showed in Tables 1 and 3, these projections underestimated the employment impact of the Wave 1 telecom boom by 50 percent after 10 years. The employment impact of the Wave 2 telecom boom on tech jobs was underestimated by 21 percent after 12 years.

To calculate this underestimate, we applied the projected growth rate of computer and mathematical occupations, derived from the 2007 and 2009 vintage projections, and applied it to the 2007 figure for computer and mathematical occupations from the Current Population Survey (CPS). Then we compared the result to the 2019 figure for computer and mathematical occupations from the CPS. We use the CPS data as the benchmark for the underestimate calculation because it gives the best available measure of the actual growth of tech jobs over time.

The analysis in this paper is based on the employment projections released in September 2019 for the time period 2018-2028. As in the past, these projections clearly do not have a telecom boom built into them. (A new set of projections were released in September 2020, after the analysis of this paper was completed. The new projections do not significantly change the results).

We will use a scenario for 5G jobs which is similar in one major respect to the Wave 2 boom, and different in two other aspects which reflect the particular characteristics of 5G.

  • As in Wave 2, we estimate that actual computer and mathematical employment (tech jobs) is 20 percent above the baseline BLS projection after 12 years (extending the projections an extra two years). These jobs are a proxy for cognitive jobs. (To be conservative, we use the occupational estimates from the BLS projection report as our 2018 starting point, rather than the somewhat higher CPS figures).
  • Unlike Wave 2, we estimate that actual number of telecommunications installers and repairers also come in 20 percent above projections after 12 years. These occupations are a proxy for skilled blue-collar, or “cognitive-physical,” jobs.
  • We allocate the additional jobs proportionally across all industries. By contrast, in Wave 2 the gains mainly came in digital industries.

We also use a conservative job multiplier of 3—that is, two additional indirect jobs for each direct job created by 5G (Bartik and Sotherland, 2019). By contrast, tech jobs are often assumed to create as many as five indirect jobs (MIT Sloane Review, 2012).

Short-term Estimate

We derive the number of “Radio, Cellular, and Tower Equipment Installers and Repairers” from the May 2019 Occupational Employment Statistics (OES). (68) As the name suggests, this category includes the workers who install 5G access points. However, by the nature of network build-out, where tower technicians were working last year may not be where they are working today. So we used the real-time database of job postings maintained by Indeed.com, which identifies itself as “the #1 job site in the world.” (69) Job postings are regularly used by economists as a rich data source. (70) Indeed’s real-time database of job postings is full-text Boolean-searchable, including by title, location and by age of job posting. We searched for job postings with the terms “tower” or “technician” in the title, and “5G” in the body of the posting.

For example, as of early July 2020, a staffing firm was looking for a “Tower Climber Technician” to work on maintaining and repairing 5G networks and based in the Detroit area. That gives us an indication of where mobile carriers or their contractors are hiring.

We also used job posting data to estimate the number of engineers nationally working on 5G projects. We started by searching for job postings with the words “engineer” or “developer” in the title, with postings aged 30 days or less. This gave us our initial pool of roughly 50,000 postings nationally as of the end of April.

Within that pool, roughly 0.6 percent contain the term 5G. The key assumption is the percentage of job postings for engineers and developers that include the term “5G” is a reasonable estimate of the percentage of engineers or developers that are involved in 5G development. Past research has supported this assumption.

Additional References

Accenture. 2017. “Smart Cities: How 5G Can Help Municipalities Become Vibrant Smart Cities.”

Timothy Bartik and Nathan Sotherland. 2019. “Realistic Local Job Multipliers,” WE Upjohn Institute, April 1, 2019.

Bureau of Labor Statistics. 2019. “Projections overview and highlights, 2018–28,” Monthly Labor Review, October 2019.

Bureau of Labor Statistics. 2020a. “Occupational Projections Evaluation: 2008–2018”

Bureau of Labor Statistics. 2020b. “Occupational Employment Statistics,” https://www.bls.gov/oes/

Jeffrey A. Eisenach and Robert Kulick. 2020. “Economic Impacts of Mobile Broadband Innovation: Evidence from the Transition to 4G,” American Enterprise Institute, May 2020.

Employment and Social Development Canada. 2020. “Canadian Occupational Projection System (COPS) – 2019 to 2028 projections.”

Carl B. Frey and Michael A. Osborne. 2017. “The Future Of Employment: How Susceptible Are Jobs To Computerisation?” Technological Forecasting and Social Change, 2017, vol. 114, issue C, 254-280.

Indeed.com. 2020. “About Indeed,” https://www.indeed.com/about

AnnElizabeth Konkel. 2020. “Healthcare and Medical Research Postings Decline,” Indeed, July 9, 2020. https://www.hiringlab. org/2020/07/09/healthcare-postings-decline/

MIT Sloan Review. 2012. “The Multiplier Effect of Innovation Jobs,” MIT Sloan Reiew, June 6, 2012. https://sloanreview.mit.edu/article/themultiplier-effect-of-innovation-jobs/

Robert J. Shapiro and Kevin A. Hassett. 2012. “The Employment Effects of Advances in Internet and Wireless Technology:Evaluating the Transitions from 2G to 3G and from 3G to 4G.”

Viewpoint: Antitrust Measures Must Leave Room for Innovators

As U.S. Attorney General William Barr is reportedly rushing to file an antitrust lawsuit against Google, an action that has all the markings of a political vendetta, progressives in the New York state Senate are launching their own campaign against Big Tech.

The Senate Consumer Protection Committee will hold a hearing on Monday to consider a misguided proposal known as the “Twenty-First Century Anti-Trust Act.” The bill would dramatically adjust the purpose of New York’s antitrust laws. Current law aims to prevent price-fixing, while the new proposal would shift the law to a nebulous standard that targets any player assumed to be dominant in the market.

If passed and signed by Gov. Andrew Cuomo, this bill would set back innovation in this state.

Read the full op-ed here.

A Rare Sign of Bipartisanship Progress: Telehealth in America

Over the August recess, I published a paper with Americans For Prosperity (shocking, I know) to highlight where there is bipartisan consensus on telehealth. Since the pandemic began, many telehealth regulations have been lifted and we explained what changes should be made permanent, what changes should go, and what additional policies could make care easier to access remotely.

Sen. Brian Schatz said that our paper demonstrated that, “telehealth is a rare area with strong bipartisan support and it’s here to stay. While we have made some progress in Congress on expanding access to telehealth during this pandemic, we have more work to do to make these changes permanent and allow more patients to continue receiving the critical health care they need wherever they are.”

I’ve summarized the findings on Medium.

America’s Remote Learning Imperative

The coronavirus pandemic is an historic test of the resilience of one of America’s most precious public assets: our public schools. So far, it’s a test we are failing. Tens of millions of children have fallen far behind in their studies. These learning losses will cascade as health fears keep most schools closed this fall – unless schools do a much better job of delivering effective online instruction to all students stranded at home.

As the pandemic continues to spread, it’s hard to imagine a more urgent national imperative than making sure all school districts are equipped to meet this challenge. At stake are the future prospects of 50.8 million public school students—especially those from low-income families, which have been the most severely affected by school closings.  

There is no single cause of this failure and no single cure. Access to computers and high-speed internet is obviously essential and should be a priority. However, the core problem is that most schools are still unprepared to deliver quality remote instruction.  Most of our large, bureaucratic, overly centralized school systems move too slowly, train their teachers inadequately, and fail to engage too many of their students, as well as their parents. 

The U.S. needs a crash program—on a scale equivalent to the 1960s moonshot, but faster—aimed at helping our schools operate virtually, both as a substitute for and an important complement to live instruction. We need a multi-pronged push by elected leaders, school officials, parents and businesses to ensure that every child who needs it has equal access to high-quality remote learning—in 2020 and beyond. We should turn the immediate crisis into an opportunity both to minimize learning loss during the pandemic and to build a strong platform for better teaching and learning for the long term.

Our strategy must be holistic.  If the focus is solely on laptops and internet connections, the effort will fail. It must include:

  • intensive professional development for teachers in online, synchronous teaching and use of available online curricula and resources; 
  • help for teachers and schools in engaging parents — who are, after all, every child’s first teacher; 
  • help for parents whose jobs and other responsibilities make it difficult or impossible to also serve as teachers’ aides at home;
  • development of new assessment tools to measure the effectiveness of different forms of remote education; 
  • support for students’ social-emotional learning and mental health; 
  • reform of school districts to give schools the flexibility they need to innovate rapidly; and 
  • redoubled efforts to improve literacy and digital literacy in students, particularly in low-income communities.

With our decentralized model of public education, this burden will fall on the shoulders of state and local leaders. Since they are financially strapped by the economic shutdown, however, the federal government must provide emergency funding. As Hoff Varner, a PTA President in Alameda, California, told The New York Times, “If we were a country interested in saving schools the same way we’ve saved airlines and banks, then this is a problem we could solve.” 

Instead of problem-solving, President Trump and his party have subjected the country to a needlessly partisan argument over whether or not to physically reopen schools.  

Like wearing masks and reopening the economy, reopening the schools should not be a political question. It must depend on whether parents, public health officials, and K-12 leaders believe it is safe for children and teachers in any particular locale to return to the classroom. A mid-July Axios-Ipsos poll showed that 7 in 10 American parents believed in-person classroom instruction was still too risky. 

Yet Congressional Republicans are treating the question like another partisan political football. While the GOP Senate bill offered $70 billion for K-12 public schools, Republicans proposed withholding two-thirds of funds from any school district until it submits a plan to the governor providing a detailed timeline for in-person instruction.

This made no sense. Apart from the historical irony of Republicans trying to dictate local school policy from Washington, it could jeopardize the health of millions of students, their parents, and educators. Republican lawmakers must drop their foolish threat to withhold money from schools that don’t physically reopen, and join with Democrats to approve the $70 billion as soon as possible, while also supporting effective public health strategies that will ultimately allow schools to reopen safely. 

If that money is distributed by the same formula used last spring for the first $13 billion in federal aid to schools, it would give more money to schools with more low-income students.  That will create an enormous opportunity for our urban schools. Using that formula, former Chicago Public Schools CEO Paul Vallas estimates that Chicago Public Schools, with an operating budget of $6.4 billion a year, will get just over $1 billion in new federal money. That is probably enough to assemble the resources and support across many fronts—if teachers, administrators, school boards, businesses, non-profits, unions, parents, and elected leaders cooperate to dramatically accelerate what to this point has been a slow evolution toward adopting and exploiting the full potential of digitally-enabled remote learning.

What Happened Last Spring

The decisions last spring to send all children home understandably caught America’s 131,000 public, private, and charter K-12 schools off guard. Some districts and schools rose to the challenge; many more did not. 

Now teachers’ unions are agitating against both opening schools prematurely and against expectations that they prepare to become full-time online instructors. Unions obviously are right to be concerned about their members’ safety. But the unions can’t have it both ways. If schools stay closed while teachers balk at providing synchronous remote instruction, millions of U.S. children will fall even further behind. Primary and middle schoolers won’t be acquiring the foundational skills – in phonics, reading and arithmetic – they need to become lifetime learners and productive workers. 

Data on the spring semester makes it extremely clear that things must change in the fall. 

By April 3, three weeks after school districts began shutting down, 76 percent of the 82 large districts studied by the University of Washington’s Center on Reinventing Public Education (CRPE) still provided no instruction to students. More distressing, by May 22, a third of them still provide no instruction. 

But even that finding was overly optimistic. In a later CPRE study of a statistically representative sample of 477 school districts, “We found just one in three districts expect teachers to provide instruction, track student engagement, or monitor academic progress for all students—fewer districts than our initial study suggested,” CRPE reported. “Far too many districts are leaving learning to chance during the coronavirus closures.” 

The most damning finding: “Only 14.5 percent of school districts with the highest concentration of students receiving free or reduced-price lunch expect teachers to provide live instruction.”

National student surveys reflected the same disappointing reality: 41 percent of teens did not attend any online or virtual classes; 78 percent reported spending only one to four hours per day on online learning; 32 percent reported two hours or less; and nearly one in four said they were connecting with their teachers less than once a week. 

In a survey by YouthTruth, reports CRPE Director Robin Lake, “Only 50 percent of students say they were able to focus on learning and only 41 percent said they were motivated to do schoolwork.”

In sum, about half of U.S. public school students received little or no instruction from March onward.

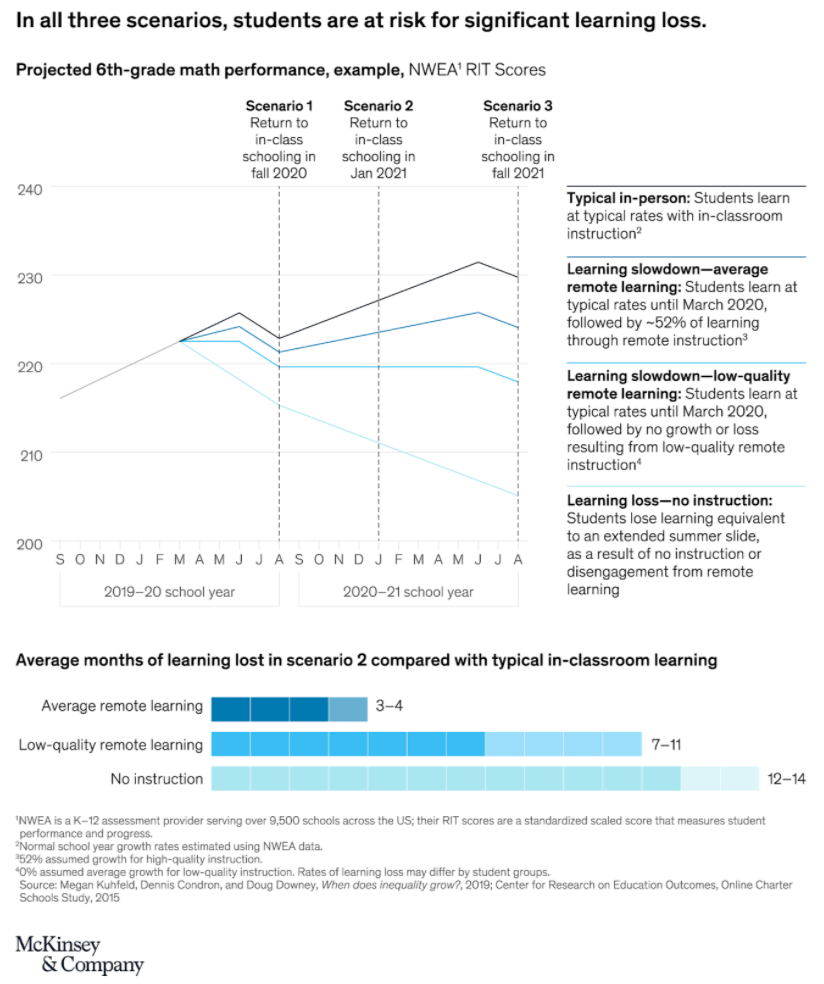
McKinsey & Company, the international consulting firm, estimated how much learning would be lost in the next school year, based on modeling three scenarios for the next school year. In the first, in-class instruction resumes in fall 2020. In the second, school closures and part-time schedules continue intermittently through the 2020–21 school year, with full-time, in-school instruction delayed until January 2021. In the third scenario, the virus is not controlled until vaccines are available, and schools operate remotely for the entire 2020–21 school year.

In the second scenario — the one most likely at this point in many places — students would lose three to four months of learning (beginning in March 2020) if they received “average” remote instruction, seven to 11 months with “lower-quality” remote instruction, and 12 to 14 months if they received no instruction (thanks to a “summer learning loss” that lasted for 17 months).

If districts fail to get their acts together, leaving vulnerable student populations to experience another semester like the one that just ended, millions may never regain their academic footing. Racial and socioeconomic achievement gaps would widen because of disparities in access to devices, internet connections, schools with coherent remote learning plans, live instruction from teachers, and parental supervision (especially in single-parent homes).

 This would do lasting damage to students’ personal development and long-term learning prospects, as well as to the US economy as a whole. In 2009, McKinsey estimated the achievement gap between high- and low-income students deprived the U.S. economy of $400 billion to $670 billion a year in productivity.  An inadequate online learning response in the coming year will increase that achievement gap.

The Digital Divide

While America’s digital divide has been closing steadily, significant gaps remain. The digital divide has two primary components: broadband adoption and internet-ready computer equipment (generally laptops). 

According to the Federal Communication Commission’s latest report, 95 percent of the nation had access to mobile (LTE) coverage in 2018, and nearly 94 percent of the population had access to “advanced” fixed (wireline) broadband.  That percentage falls to 77 percent and 72 percent for people living in rural and Tribal areas, respectively. “On average, deployment is highest in census block groups with the highest median household income, the highest population density, and the lowest poverty rate,” the FCC notes. 

Almost all (96 percent) students from households earning more than $150,000 had access to a laptop or desktop computer before the pandemic, compared to only half (51 percent) of students in households earning less than $25,000. A recent study on America’s “homework gap” estimates that nearly 17 million U.S. students, especially students of color, lack fixed (wireline) internet access at home. 

Before the pandemic about a quarter of Black and Latinx households had not adopted residential broadband, compared to 10 percent of white households and 5 percent of Asian households. Among students whose families earned less than $30,000 annually, 35 percent didn’t have a broadband connection at home; in households earning more than $75,000, just 6 percent had not adopted residential broadband. 

According to researchers at the University of Michigan, students who rely mainly on mobile connections lag behind those who have fixed broadband at home:      

We find that students who do not have access to the Internet from home or are dependent on a cell phone alone for access perform lower on a range of metrics, including digital skills, homework completion, and grade point average. They are also less likely to intend on completing a college or university degree. A deficit in digital skills compounds many of the inequalities in access and contributes to students performing lower on standardized test scores, such as the SAT, and being less interested in careers related to science, technology, engineering, and math.

The Federal Communications Commission created a “Keep Americans Connected” challenge to broadband operators last March. To date, more than 800 companies and associations have pledged to (1) refrain from terminating internet service to any residential or small business customers because of their temporary inability to pay bills; (2) waive any late fees that residential or small business customers incur as a result of the pandemic; and (3) open their Wi-Fi hotspots to any American who needs them. 

The nation’s broadband providers developed new programs and expanded existing programs to help low-wage workers and families that didn’t subscribe to internet at home. For example, Cox Cable offered discounted internet to families with children who qualified for subsidized meals, selected veterans, senior citizens, college students, public housing residents, and families that received rental assistance. Comcast, Spectrum, Optimum, Suddenlink, and others offered free broadband and Wi-Fi access for 60 days to certain customers—for example, students and low-income households.

Some schools and districts engaged with community partners to ensure students had access to high-speed internet. Public libraries offered mobile hotspots. Some school districts converted buses into mobile hotspots and parked them in high-need communities.  Alabama has used $10 million in federal relief funds to make every bus in the state a Wi-Fi hotspot. 

In addition to internet access, many schools and districts stepped up in the spring, distributing laptops or tablets and internet-connectivity devices. In Seattle, for example, Amazon donated 8,200 laptops to the public school system, and the nonprofit Partnership for Connecticut distributed 60,000 laptops statewide, which Dell provided at a 62 percent discount. Philanthropists provided support for laptops in many communities.

These efforts need to be continued and expanded, with federal and state support.  However, having broadband and devices is simply not enough, as all the data indicate. Even when provided with both, many students simply were unprepared for virtual learning. Ten weeks into the shutdown, the School District of Philadelphia reported that nearly 40 percent of students failed to attend online school on an average day. In Chicago, where 90 percent of public school students had online access, 41 percent logged into an online classroom fewer than three times a week. 

In Los Angeles, despite an offer of free Wi-Fi service for all disconnected students rolled out in March, daily absenteeism from March through May (measured by daily logins to the district’s online learning platform) averaged 40% of all secondary students on any given day. 

There are too many barriers to successful online education that go well beyond just putting a connected laptop in a child’s hands, and those barriers must be broken down. Students must be engaged in learning by their schools and teachers; parents have to support, encourage, and push them; states and school districts must learn how to measure the effectiveness of different remote learning approaches; and districts need to give their schools the flexibility to change their staffing models, budgets, and teaching strategies.

PPI recommends that states, districts, and charter schools focus on the following areas:

Training Teachers

Despite scant experience or training in virtual education, many teachers were thrust overnight into a wrenching transition from face-to-face instruction to online teaching. And most districts were not prepared to train them. Seven out of ten surveyed teachers reported they had not been properly prepared for virtual learning. The Washington Post reported that a survey found 43 percent of school administrators and 57 percent of teachers feeling “overwhelmed” by distance learning instruction.

In New York City, teachers were only given three days of training in online instruction, which for many of them was a first-time-ever introduction to basic learning platforms such as Google Classroom. But few teachers across the country had ever had to figure out how the keep third graders engaged in a Zoom class all day, how to use online content to excite the curiosity of inner city kids, how to grade fairly when some homes had no parent available to assist, or dozens of other challenges. For thousands of dedicated and conscientious teachers, the learning curve toward a new and different style of pedagogy has been steep. 

A new survey of 800 educators by EdTech Evidence Exchange and the University of Virginia found that only 27 percent of teachers participated in any kind of formal professional learning for online instruction last spring. About a quarter of teachers reported they covered no new material during the school closings, while more than half said they covered less of the curriculum than they normally do. 

Some districts are wisely delaying school openings to allow time to train teachers in remote learning. For instance, Clark County, Nevada’s largest district, delayed the start of school by two weeks to provide teachers 10 full days of professional development.

There are many kinds of educational software already available that schools can use, much of it free. For instance, Summit Public Schools in California has spent the past decade developing and sharing its Summit Learning Program for free with almost 400 other schools around the country. Developed by its teachers and programmed by software engineers provided by Mark Zuckerberg, it is a sophisticated system that uses software and online tools to help kids acquire content knowledge and projects to help them develop their deeper learning skills, such as research, writing, speaking, critical thinking, and teamwork.

Khan Academy, developed by Salman Kahn, is another widely used and highly respected free resource. It provides more than 6,500 video lessons in math, science, computing, arts and humanities, economics, reading, and life skills. By 2020, it had more than 5.6 million subscribers, and its videos had been viewed more than 1.7 billion times. 

Most teachers need intensive training to learn about their instructional options, confer with school leaders and parents about which option best meet their students’ needs, and become comfortable using them. On top of that, teachers need training in how to engage students and keep them engaged—an entirely different challenge during remote education than with a classroom full of children. 

Hit especially hard by school closures were the 7.1 million students ages 3-21 who required special education services. Not only did many of them lack computers and residential broadband, but many were cut off from occupational, speech, and physical therapy. Because the hallmark of special education is individualized or small-group support for students with a wide array of unique needs, it is impossible to devise a standard “model” for remote learning. Online programs and computers must be tailored to reflect students’ various disabilities. Some experts believe teachers should also offer one-on-one support to acclimate special needs students to learning by computer and to track their progress. 

“Some states allow in-person supports for students with disabilities. In Maryland and California, some providers may visit children’s homes,” reports Beth Hawkins in The 74. “In Washington state, some students can attend meetings and receive services in school buildings with proper social distancing.”

As many parents with pre-schoolers discovered last spring, trying to deliver early learning digitally also can be an exasperating experience for everyone involved. According to education researcher Jesse McNeill:

Distance learning presents a particular challenge to early childhood learners. Remote learning strategies that work for older students (e.g., synchronous, hour-long lectures) do not translate to younger students who rely heavily on adult facilitation and cannot pay attention for long periods. In addition, many early childhood learning activities require one-on-one facilitation or small-group interaction, which is difficult to deliver in a distance learning environment.

To surmount such difficulties, pre-K teachers and parents will have to work closely together to develop routines around remote instruction that respect the multiple pressures on working parents, and that also build in opportunities for the face-to-face interactions that young children need. 

In short, online learning isn’t simply a matter of parking a teacher in front of a camera and rolling the tape. Everyone – students, teachers, parents and administrators – will need training in new ways to teach and learn. 

Engaging and Supporting Parents

The effectiveness of virtual learning often hinges on how engaged parents are in making sure their children participate. In effect, remote learning shifts some of the burden of administering their children’s education from teachers to parents, who also have to navigate their own work responsibilities. One recent study found that 60 percent of teachers say that the lack of parental supervision and support at home is a key reason why students don’t participate in online learning.

Many older and low-income parents lack digital skills (and some lack English language skills) to coach their children on how to learn online. In fact, according to a survey by the Joan Ganz Cooney Center, many parents ironically look to their kids to teach them these skills:

Children frequently help their parents use devices that connect to the Internet, such as computers, tablets, and smartphones. Half (53 percent) of all low- and moderate-income parents who use the Internet say that their child helps them, including 63 percent of those whose child is between 10 and 13 years old. Parents with lower educational attainment are more likely to turn to their children for help: 62 percent of those who did not graduate from high school do so, compared with 45 percent of those with a college degree. Hispanic parents are the most likely to say that their child has helped them use Internet-connected devices (63 percent, compared with 45 percent of Whites), but there were no statistically significant differences within the Hispanic community by income, language, or immigrant generation. 

The Centers for Disease Control (CDC) estimates that in households with minor children, only about 35 percent of parents are able to telework from home. Since someone has to stay home to take care of the kids, single parents who aren’t able to telework are forced to give up their jobs. Only 19.7 percent of Blacks and 16.2 percent of Latinos can telework and support their children’s learning throughout the day.

Remote learning places a special burden on parents who also happen to be teachers. According to the Brookings Institution, nearly half of public school teachers have children living at home. It’s difficult to deliver online instruction to their students while also helping their children get the most from their online courses – especially if both things are happening at the same time. 

Federal funds to help parents afford childcare during the upcoming school year are essential, including support for innovative solutions such as “learning pods” or “pandemic pods.” These are small groups of students who learn together with an in-person teacher or tutor. A Godsend to parents trying to juggle their day jobs while also supervising their childrens’ education, learning pods nonetheless are expensive and families with low and modest incomes should get public help to defray the costs. 

Schools also need to engage parents in helping to teach their children, particularly parents without computer skills. In Prince George’s County, Maryland, the school district has created nine Parent Centers throughout the 133,000-student district, where parents can get help with using computers and other challenges. The Centers give parents tips on keeping children engaged, connecting with a Parent Teacher Organization (PTO), and finding the best ways to communicate with teachers and monitor student participation.

A practice of many of the nation’s best charter schools to encourage parental engagement should be widely adopted.  Many charters have long sent teachers to visit their students’ homes and asked parents to sign contracts that commit them to supporting the education of their children. Some of the nation’s more innovative school districts, including those in Denver and Washington, D.C., have begun to emulate this practice. Several studies have found that students perform better when teachers actively reach out to their parents.

But not all “family engagement” is equally effective. As many parents know, involvement in a PTA, a potluck dinner at school, or a back-to-school night doesn’t help their kids learn. Research suggests that parents can best help their children by communicating high expectations and the value of learning, monitoring progress and holding their children accountable, supporting learning at home, advocating for them, and guiding their major decisions to college or career.

Some schools and districts actively help parents develop these skills. The Flamboyan Foundation, a leader in this field, has trained thousands of teachers, particularly in Washington, D.C.  The training has several purposes, according to Flamboyan’s former executive director, Susan Stevenson: 1) to change teacher beliefs and mindsets about parents, so they see parents as assets and engaging them as part of their responsibility; 2) to build trusting, mutually respectful relationships and two-way communication with families; 3) to help teachers work with parents (and their surrogates), so those parents can help their children succeed in school; 4) and to enable teachers to learn from families about their children, so they can better teach them. 

Districts and charter networks should use some of any federal money that arrives to train and pay their teachers to do these things, virtually as well as physically. Funding will also be necessary to provide translators for parents and other caregivers who don’t speak English. 

Finally, each school should have a communication plan to ensure parents have access to timely information about available resources. Schools should also create support groups for parents of multiple children, parents of special needs students, and parents who are essential workers and cannot stay home to make sure their children are keeping up with their studies. 

Assessing Student Progress

As students return to school, whether virtually or in person, using diagnostic tests to assess their current level of content knowledge will be critical to charting a path forward. Without preliminary assessments, schools and parents will lack a yardstick for measuring the gains (or losses) from remote instruction. 

Districts and schools will need an injection of federal and state resources and support to design ways to regularly assess how well different forms of remote learning are working, so teachers can continuously improve their offerings. End-of-year tests do not help with this task: schools will need to assess progress every six weeks or so. While some already do that in some form, all will need to learn which forms of assessment work best in a remote-learning environment. For instance, they will need to incorporate student and parent surveys into their assessments, to measure student engagement. And they will need to measure and emphasize academic growth (how much children learn over time), not just proficiency (whether they are at grade level). 

Most states already require some form of annual growth measurement, although California’s approach is woeful and some other states could strengthen their methods. Tennessee’s Value-Added Assessment System offers a good model, but districts will need a different approach to measure growth more often than once a year. 

Supporting Students’ Social-Emotional Learning and Mental Health

Successful schools help students not just to learn content, but to develop their social-emotional competencies, such as persistence, self-discipline, responsible decision-making, ability to work with others, and ability to set and achieve goals. Like many things, this becomes more challenging in a remote-learning environment. 

One key is establishing close relationships between teachers and students. In most successful charter schools, for instance, all students participate in an “advisory” or “family”—a group of 15 or so students with one teacher. They meet regularly and often focus on activities and discussions meant to build social-emotional competencies. The teacher is expected to get to know each student and their family well and to keep track of how they are doing. Many charter school leaders believe that these close relationships—more than any other factor—helped make their transitions to remote learning effective.  

The Collaborative for Academic, Social, and Emotional Learning (CASEL) has published a guide to enhancing social-emotional learning in this time, which includes many other useful suggestions. 

As the pandemic moves through communities, it leaves behind emotional scars. Particularly in communities of color, students grieve the loss or illness of parents and other relatives, in isolation from their friends. In the coming months, more of them will face economic hardship, including eviction from their homes. For some, mental health issues will become acute. Clearly, districts and schools need federal and state funds to hire additional social workers and psychologists who can reach out and work with students and their families dealing with trauma. 

Modernizing School System Organization 

In addition to delivering emergency aid to schools so that our children keep learning during the pandemic, our leaders need to craft a long-term strategy for making our K-12 system more resilient against future pandemics or other shocks. They should pay heed to a key lesson from school districts’ uneven performance last spring: organization matters.

Most of America’s K-12 public schools are organized under a century-old model, in which school districts own and operate all schools within a defined geography and vest authority to make all key decisions in a superintendent and his or her staff, not in school principals.

Centralized, rule-driven, bureaucratic monopolies worked well enough during the Industrial Era, when most graduates would go on to manual labor or stay home and raise kids. But global competition has raised the bar dramatically; today’s graduates must be able to do so much more to earn a decent living. Meanwhile, the pace of change has accelerated and computer technologies have made amazing things possible. 

In response, a new model for school organization and governance has begun to emerge, geared to the knowledge economy. Non-hierarchical and decentralized, the new model is built upon school autonomy, strict public accountability, and the ability to choose among very different schools tailored to the diverse needs of children. In the 21st century, success comes from decentralized networks of mission-driven organizations whose customers have choices, not from top-down bureaucracies.

This explains why public charter schools, which are freed from district bureaucracies, educate urban children far more effectively than district schools in most cities. By their fourth year in a charter, urban charter students learn 50 percent more every year than district students with similar demographics and past test scores, according to a study of 41 urban regions by Stanford University’s Center for Research on Education Outcomes.

Free from red tape and bureaucracy, charters are also nimbler than district-operated schools. Recent surveys by the Center for Reinventing Public Education, at the University of Washington, showed that charter management organizations transitioned to distance learning faster and more thoroughly this spring than districts did, on average. They were already more likely to use educational software, to deliver personalized learning, and to engage parents in their children’s learning. CRPE found that many of them quickly redefined teachers’ roles and responsibilities to fit the new reality—using teacher leaders for each grade to lead the redesign of instruction, record sample lessons, and organize professional development for other teachers, for instance.  

On the other hand, school districts had the resources to purchase and distribute computers and hotspots quickly, a big advantage. To adapt to remote learning effectively, in other words, school systems needed strong central offices capable of marshaling resources but decentralized operation of individual schools, so empowered principals and teachers can quickly implement remote education and the support systems required for success.  

New Orleans, a district in which every public school is chartered, provides a compelling example of how to take advantage of district-level power and school-level adaptability. Within three school days of the sudden closure, more than half the city’s public schools were handing out free meals. Within three weeks of closure, the school district had procured thousands of laptops and hotspots, which it then delivered to schools for distribution to those who needed them.

“By March 23, the beginning of the second week of school building closures, at least 97 percent of New Orleans public schools had begun providing their students with some form of physical and/or digital educational resources to continue learning,” reports New Schools for New Orleans. By mid-April, a Louisiana Department of Education survey showed that teachers at all New Orleans public schools were reaching out to their students at least weekly, teachers at 90 percent were giving students feedback on their work, and teachers at 80 percent were delivering new content across all grade levels. This summer 60 percent of New Orleans’ charters offered virtual summer school to prevent an exacerbated “summer slide” (learning loss) for their students. 

The combination of capable central offices that can steer well and empowered school leaders and teachers who can row effectively is possible in a system of charter schools. But it is also possible in districts that give schools charter-like autonomy. (With this autonomy must come accountability for performance—including potential replacement by a stronger operator—since not all autonomous schools will succeed.) 

More than a dozen school districts across the nation are converting significant numbers of their schools to this model. A good example is Indianapolis Public Schools, which has converted a third of its schools to nonprofit organizations with full autonomy and five-year performance agreements. They are called “innovation network schools,” and they include restarts of failing schools, new startups, conversions of district schools, and conversions of charter schools. Since they were launched five years ago, they have been the fastest improving group of schools in the district.

States should create incentives – both carrots and sticks — for districts to do this. In Texas, for instance, the state can appoint a new school board if a district school is rated failing for five years in a row. But districts that recruit nonprofit organizations to operate “partnership schools” get a two-year reprieve from sanctions, plus an average of $1,000 per student per year in extra funding to help turn around those schools. 

Because such autonomous schools have more leeway to create innovative approaches to distance learning, other states should pass similar legislation, and Congress should include a financial incentive to encourage states to do so. By devoting as little as $2-3 billion to challenge grants for states that empower and encourage their districts to shift toward a more decentralized model, the federal government could speed up a transition that is underway but moving far too slowly.

Conclusion

The various investments proposed above focus on the immediate need to improve remote learning, but they will benefit students when they return to school buildings as well. Educational software and online resources are incredibly valuable, whether as primary or secondary/homework materials, and the more familiar teachers, students and parents are with them, the better. Parental engagement is an area most schools need to improve rather dramatically, so improvements made during a period of exclusively remote learning will benefit their students as more normal conditions return. Assessment of student progress is already rudimentary at too many schools, so efforts to expand it and make it more sophisticated during the pandemic can help for the long term. The same goes for social-emotional learning and mental health supports. And finally, the need to modernize our century-old operating systems for public education was acute before the pandemic and will remain so afterward.

America’s school districts and charter networks will use some of any forthcoming emergency federal money for technology, and some of it to make their school buildings safer when students return to them. But educational leaders should not ignore the “people” side of the equation. More than anything else, we need more involved parents, teachers with more expertise in using educational software and the Internet, students able to learn because they have support in dealing with the trauma in their lives, and school districts in which the central office can steer effectively but leave the rowing—the operational decisions about hiring, firing, budget, curriculum and school day and year—to those hired to run the school.

Amid Trump economic debacle, Biden’s central message must be his plan for American recovery

President Donald Trump is desperate to make this campaign about anything other than the economic disaster his incompetence has largely caused. But Joe Biden can’t let him do it. Biden’s own robust economic recovery plans must become the Biden-Harris ticket’s key election message.

Just in the last two weeks, Trump has desperately invoked law and order, or federal approval of a non-existent vaccine, or the latest QAnon conspiracy theory — in short, anything but the sick economic elephant in the room.

And no wonder. More than 22 million Americans lost their jobs just in March and April as Donald Trump bungled the COVID crisis, but more than half of those jobs have yet to return. Job growth in July was less than half that of June. And the new August numbers out last Friday being touted by the administration in fact barely make a dent in this new structural unemployment. The actual unemployment rate may be closer to 9% due to misclassification, according to Bureau of Labor Statistics, andover 29 million people were receiving unemployment benefits as of mid-August.

Read the full piece here.

Unemployed Americans Face Benefit Cut-Off

While House Democrats and Senate Republicans remain at an impasse over how generous unemployment benefits should be in the current recession, a potentially greater problem is looming: millions of unemployed Americans will see their benefits terminated prematurely unless Congress takes additional action in the next three months. What’s more, many workers are forced to clear bureaucratic hurdles to qualify for extended benefits Congress approved last spring to help them ride out the pandemic.

This piece explains why jobless Americans are entangled in red tape and on course to lose their benefits at the end of this year. Congress should fix these problems by tying the duration of unemployment benefits to actual economic conditions rather than arbitrary deadlines, streamlining the transition from regular benefits to extended pandemic benefits, and requiring the states to do a better job of informing workers about special pandemic extensions.

Not All Unemployed People Are Eligible for the Same Number of Weeks

People who lose their jobs through no fault of their own can typically draw unemployment benefits for 26 weeks. When unemployment spikes, the Extended Benefits (EB) program automatically extends the duration of benefits, usually for 13–20 weeks. But to buy unemployed people more time to find work amid the pandemic recession, Congress created a new program that offered 13 additional weeks of benefits for job seekers to draw before EB, called Pandemic Emergency Unemployment Compensation (PEUC). (Since some states offer unemployment benefits for fewer than 26 weeks, Congress also let people who exhausted all available benefits in fewer than 39 weeks make up the difference through the new program otherwise meant for self-employed workers, Pandemic Unemployment Assistance.)

However, it turns out that many people who lost their jobs as a result of the pandemic will not receive all 39 weeks of unemployment benefits. Why? Because the pandemic-specific unemployment programs expire at the end of this year. That means that anyone who began receiving benefits after March 28 will have their pandemic benefits cut off before they receive 39 weeks of benefits.

Leaders may have hoped back in March that the pandemic would subside and the unemployed would not need an extension after December. But we now know that’s not likely. Instead of “going away” as President Trump said that it would, the pandemic became worse than ever, which hurt the economy and caused even more layoffs. Over 80 percent of all initial normal unemployment claims filed during the pandemic were filed with fewer than 39 weeks to go before the end of the year. While some of those recipients are repeat claimers who might still get the full benefit, evidence from California suggests most were newly unemployed people who cannot. Republicans’ refusal to negotiate seriously with House Democrats now risks undermining the stimulus that Congress has already passed by prematurely kicking millions from pandemic unemployment programs.

Image for post

Even Eligible Beneficiaries Face Hurdles to Claiming Benefit Extensions

The looming cutoff isn’t the only problem facing unemployed people. To get however much of a benefit extension they do qualify for, recipients must also run a bureaucratic gauntlet through state unemployment offices already saddled with outdated technology and unprepared for the flood of applications. The U.S. Department of Labor has told states to require beneficiaries who have exhausted their normal benefits to actively apply for PEUC benefits, rather than receiving the benefits automatically. Some states are automatically enrolling beneficiaries in the program anyway, but PPI has only identified 14 such states, while 29 states indicate beneficiaries must specifically apply for PEUC in some way (several states have not yet set up their PEUC programs, and others do not indicate on their websites how beneficiaries transition from normal benefits to PEUC). This new application is simple in some jurisdictions, but onerous in others. Jobless people in Arkansas, for example, must physically go to a state unemployment office to apply for these benefits, even though they can apply for normal benefits online.

Image for post

These extra barriers could deter some recipients from getting the benefits they are entitled to. And beneficiaries who may have already survived onerous wait times to get their normal benefits may once again face delaysas states struggle to process PEUC applications. Kansas warns people transitioning from normal unemployment benefits to PEUC to expect delays in their payment, which can be brutal on cash-constrained people struggling to pay their bills.

Federal policy requires states to notify people who are likely eligible for PEUC, but many are not doing so until after a recipient exhausts their normal benefits, which risks leaving people confused as to whether they are entitled to more benefits. Although I have found no good data on how common this is, anecdotal evidence from my experience suggests the problem is real. My mother, who is furloughed, did not understand what the benefit extensions would entitle her to, and those extensions made gave her a better alternative to accepting an early retirement offer from her employer. Another close friend, who is unemployed, was planning to move to his parents’ house hundreds of miles away before he found out about PEUC through his own research. States should inform all recipients of everything they are entitled to when they begin receiving benefits (or as soon as new information becomes available) so no one makes life-changing decisions based on incomplete information.

Longer Benefits Could Support the Economy Even More Than Larger Benefits

Spending more on unemployment benefits helps more than just the recipients themselves — it helps the economy in which that money is spent. And while Congress can and should do both, extending the duration of unemployment benefits might do even more to stimulate the economy than increasing the size of benefits. This is because money put into circulation by the government only stimulates the economy if it gets spent on goods and services by those who receive it. Beneficiaries are likely to spend every dollar of a small benefit to pay for necessities, but every additional dollar is slightly less essential to maintain their standard of living. As the size of the benefits grows, recipients are more likely to save rather than spend a greater share of those benefits. Accordingly, the jobless population is more likely to spend money they receive from a benefit extension than they are a bigger weekly benefit with a similar cost.

Further, the long-term unemployed are less likely to have savings or other resources to support themselves, making it even more likely they will spend a large share of their benefit. And contrary to GOP Senator Rand Paul’s claim that said “If you give people money and you make it less painful to be in a recession we can stay in a recession longer,” research on the Great Recession found that extending benefit duration did not create a strong disincentive to work. Because people can only draw unemployment benefits if they are looking for a job, extending unemployment benefits can give recipients a vital lifeline without holding back the economic recovery.

To strengthen this safeguard for job seekers and the economy, Congress should return to the negotiating table and take three immediate actions:

  • First, cancel the arbitrary end-of-year deadline for pandemic benefits and tie the duration of unemployment benefits to real economic conditions as indicated by figures such as the unemployment rate.
  • Second, direct the Labor Department to let states automatically enroll beneficiaries who exhaust their normal benefits in PEUC.
  • Third, require states to notify all beneficiaries about the full slate of benefits available to them, with immediate updates should those benefits change.

For more information on how states say people can apply for PEUC, see below.

State, How are Normal Beneficiaries Transferred to PEUC:

Alabama, Automatically
Alaska, New Application
Arizona, New Application
Arkansas, New Application
California, Automatically
Colorado, New Application
Connecticut, New Application
Delaware, Automatically
Florida, New Application
Georgia, Automatically
Hawaii, New Application
Idaho, New Application
Illinois, Automatically
Indiana, Not Clear
Iowa, Automatically
Kansas, New Application
Kentucky, New Application
Louisiana, Not Clear
Maine, New Application
Maryland, Automatically
Massachusetts, Automatically
Michigan, Automatically
Minnesota, New Application
Mississippi, Not Clear
Missouri, New Application
Montana, New Application
Nebraska, Automatically
Nevada, New Application
New Hampshire, Not Clear
New Jersey, Automatically
New Mexico, New Application
New York, Automatically
North Carolina, New Application
North Dakota, New Application
Ohio, New Application
Oklahoma, New Application
Oregon, New Application
Pennsylvania, Automatically
Rhode Island, Not Clear
South Carolina, New Application
South Dakota, Not Clear
Tennessee, New Application
Texas, Not Clear
Utah, New Application
Vermont, Automatically
Virginia, New Application
Washington, New Application
West Virginia, New Application
Wisconsin, New Application
Wyoming, New Application

Unemployed Americans Face Benefit Cut-Off

While House Democrats and Senate Republicans remain at an impasse over how generous unemployment benefits should be in the current recession, a potentially greater problem is looming.

While House Democrats and Senate Republicans remain at an impasse over how generous unemployment benefits should be in the current recession, a potentially greater problem is looming: millions of unemployed Americans will see their benefits terminated prematurely unless Congress takes additional action in the next three months. What’s more, many workers are forced to clear bureaucratic hurdles to qualify for extended benefits Congress approved last spring to help them ride out the pandemic.

This piece explains why jobless Americans are entangled in red tape and on course to lose their benefits at the end of this year. Congress should fix these problems by tying the duration of unemployment benefits to actual economic conditions rather than arbitrary deadlines, streamlining the transition from regular benefits to extended pandemic benefits, and requiring the states to do a better job of informing workers about special pandemic extensions.

Not All Unemployed People Are Eligible for the Same Number of Weeks

People who lose their jobs through no fault of their own can typically draw unemployment benefits for 26 weeks. When unemployment spikes, the Extended Benefits (EB) program automatically extends the duration of benefits, usually for 13–20 weeks. But to buy unemployed people more time to find work amid the pandemic recession, Congress created a new program that offered 13 additional weeks of benefits for job seekers to draw before EB, called Pandemic Emergency Unemployment Compensation (PEUC). (Since some states offer unemployment benefits for fewer than 26 weeks, Congress also let people who exhausted all available benefits in fewer than 39 weeks make up the difference through the new program otherwise meant for self-employed workers, Pandemic Unemployment Assistance.)

However, it turns out that many people who lost their jobs as a result of the pandemic will not receive all 39 weeks of unemployment benefits. Why? Because the pandemic-specific unemployment programs expire at the end of this year. That means that anyone who began receiving benefits after March 28 will have their pandemic benefits cut off before they receive 39 weeks of benefits.

Leaders may have hoped back in March that the pandemic would subside and the unemployed would not need an extension after December. But we now know that’s not likely. Instead of “going away” as President Trump said that it would, the pandemic became worse than ever, which hurt the economy and caused even more layoffs. Over 80 percent of all initial normal unemployment claims filed during the pandemic were filed with fewer than 39 weeks to go before the end of the year. While some of those recipients are repeat claimers who might still get the full benefit, evidence from California suggests most were newly unemployed people who cannot. Republicans’ refusal to negotiate seriously with House Democrats now risks undermining the stimulus that Congress has already passed by prematurely kicking millions from pandemic unemployment programs.

Even Eligible Beneficiaries Face Hurdles to Claiming Benefit Extensions

The looming cutoff isn’t the only problem facing unemployed people. To get however much of a benefit extension they do qualify for, recipients must also run a bureaucratic gauntlet through state unemployment offices already saddled with outdated technology and unprepared for the flood of applications. The U.S. Department of Labor has told states to require beneficiaries who have exhausted their normal benefits to actively apply for PEUC benefits, rather than receiving the benefits automatically. Some states are automatically enrolling beneficiaries in the program anyway, but PPI has only identified 14 such states, while 29 states indicate beneficiaries must specifically apply for PEUC in some way (several states have not yet set up their PEUC programs, and others do not indicate on their websites how beneficiaries transition from normal benefits to PEUC). This new application is simple in some jurisdictions, but onerous in others. Jobless people in Arkansas, for example, must physically go to a state unemployment office to apply for these benefits, even though they can apply for normal benefits online.

These extra barriers could deter some recipients from getting the benefits they are entitled to. And beneficiaries who may have already survived onerous wait times to get their normal benefits may once again face delays as states struggle to process PEUC applications. Kansas warns people transitioning from normal unemployment benefits to PEUC to expect delays in their payment, which can be brutal on cash-constrained people struggling to pay their bills.

Federal policy requires states to notify people who are likely eligible for PEUC, but many are not doing so until after a recipient exhausts their normal benefits, which risks leaving people confused as to whether they are entitled to more benefits. Although I have found no good data on how common this is, anecdotal evidence from my experience suggests the problem is real. My mother, who is furloughed, did not understand what the benefit extensions would entitle her to, and those extensions made gave her a better alternative to accepting an early retirement offer from her employer. Another close friend, who is unemployed, was planning to move to his parents’ house hundreds of miles away before he found out about PEUC through his own research. States should inform all recipients of everything they are entitled to when they begin receiving benefits (or as soon as new information becomes available) so no one makes life-changing decisions based on incomplete information.

Longer Benefits Could Support the Economy Even More Than Larger Benefits

Spending more on unemployment benefits helps more than just the recipients themselves — it helps the economy in which that money is spent. And while Congress can and should do both, extending the duration of unemployment benefits might do even more to stimulate the economy than increasing the size of benefits. This is because money put into circulation by the government only stimulates the economy if it gets spent on goods and services by those who receive it. Beneficiaries are likely to spend every dollar of a small benefit to pay for necessities, but every additional dollar is slightly less essential to maintain their standard of living. As the size of the benefits grows, recipients are more likely to save rather than spend a greater share of those benefits. Accordingly, the jobless population is more likely to spend money they receive from a benefit extension than they are a bigger weekly benefit with a similar cost.

Further, the long-term unemployed are less likely to have savings or other resources to support themselves, making it even more likely they will spend a large share of their benefit. And contrary to GOP Senator Rand Paul’s claim that said “If you give people money and you make it less painful to be in a recession we can stay in a recession longer,” research on the Great Recession found that extending benefit duration did not create a strong disincentive to work. Because people can only draw unemployment benefits if they are looking for a job, extending unemployment benefits can give recipients a vital lifeline without holding back the economic recovery.

To strengthen this safeguard for job seekers and the economy, Congress should return to the negotiating table and take three immediate actions:

  • First, cancel the arbitrary end-of-year deadline for pandemic benefits and tie the duration of unemployment benefits to real economic conditions as indicated by figures such as the unemployment rate.
  • Second, direct the Labor Department to let states automatically enroll beneficiaries who exhaust their normal benefits in PEUC.
  • Third, require states to notify all beneficiaries about the full slate of benefits available to them, with immediate updates should those benefits change.

For more information on how states say people can apply for PEUC, see below.

State, How are Normal Beneficiaries Transferred to PEUC:

Alabama, Automatically
Alaska, New Application
Arizona, New Application
Arkansas, New Application
California, Automatically
Colorado, New Application
Connecticut, New Application
Delaware, Automatically
Florida, New Application
Georgia, Automatically
Hawaii, New Application
Idaho, New Application
Illinois, Automatically
Indiana, Not Clear
Iowa, Automatically
Kansas, New Application
Kentucky, New Application
Louisiana, Not Clear
Maine, New Application
Maryland, Automatically
Massachusetts, Automatically
Michigan, Automatically
Minnesota, New Application
Mississippi, Not Clear
Missouri, New Application
Montana, New Application
Nebraska, Automatically
Nevada, New Application
New Hampshire, Not Clear
New Jersey, Automatically
New Mexico, New Application
New York, Automatically
North Carolina, New Application
North Dakota, New Application
Ohio, New Application
Oklahoma, New Application
Oregon, New Application
Pennsylvania, Automatically
Rhode Island, Not Clear
South Carolina, New Application
South Dakota, Not Clear
Tennessee, New Application
Texas, Not Clear
Utah, New Application
Vermont, Automatically
Virginia, New Application
Washington, New Application
West Virginia, New Application
Wisconsin, New Application
Wyoming, New Application

We should push for more progress in telehealth

Over the last few months, millions of Americans have used telehealth services — the remote delivery of care and health monitoring using digital telecommunications tools — to get health care. Federal and state policymakers have made it easier to access telehealth during the pandemic to keep people home and safe but there is no reason to slow the momentum after so much progress has been made.

Due to policy changes at the state and federal levels, the use of telehealth has grown faster in the past five months than in the preceding 25 years. During the COVID-19 pandemic:

Most of the current telehealth expansions are temporary and will expire with the end of the current public health emergency declaration. But they don’t need to. In fact, 39 senators from both sides of the aisle have introduced legislation that would make some of those changes permanent.

Read the full op-ed here.

Online Courses Cost Too Much—So Do Onsite Classes

After welcoming undergraduates back to campus, Notre Dame, Michigan State, and the University of North Carolina (among others), experienced outbreaks of COVID-19. The result—they switched back to remote learning. With 26,000 cases of coronavirus linked to college campuses, more will soon follow. While some of those schools will offer discounts for online courses, many others won’t. Is this fair?

Students don’t think so. In a recent survey, 93 percent of undergraduates said online tuition should be reduced. This result isn’t a surprise. Most of us equate “online” with “less expensive.” But while other industries have been able to cut prices taking advantage of technology and the Internet—colleges and universities (with the exception of massive online courses or MOOCs) typically charge the same for online and onsite courses. Why?

Read Paul’s full op-ed here.

U.S. App Economy Update August 2020

As of August 2020,  we estimate that the United States has 2.52 million App Economy jobs, up 12% from our latest April 2019 estimate (released September 2019). This estimate includes a conservative estimate of spillover jobs (for a definition of an App Economy job and an explanation of our methodology, please see the appendix of our 2017 report) .

We can also estimate App Economy jobs by mobile operating system. As of August 2020, there are 2.135 million jobs in the iOS ecosystem and 1.983 million jobs in the Android ecosystem, up 15% and 14%, respectively, from the April 2019 estimates.  Note that many App Economy jobs belong to both ecosystems.

In the middle of a pandemic-induced recession, well-known companies like Snapchat, Etsy, Capital One and Square have posted job openings for mobile app developers.  So have lesser-known companies like UrgentCare2go and ForeFlight in Texas; Echelon Fit Multimedia and Tomahawk Robotics in Florida; ZYRL.us and Gambyt in Michigan; and Zumper in Illinois.  The demand for mobile app developers and other app-related jobs has been broad, across retail, finance, healthcare, networking, defense, and other industries.

The gains are driven in part by the overall rise in the number of people working in computer and mathematical occupations, which is a key input to our estimation procedure. Gains, not surprisingly, are also due to the increasing importance of mobile apps in a world of telehealth, virtual meetings, and remote learning.

The App Economy also has a history of being recession-resistant. Remember that Apple opened the first App Store in July 2008, just as the U.S. economy was plunging into financial crisis. The App Store and the others that followed, including Google Play (originally Android Market) which launched in October 2008, were successful despite historic economic turmoil.

Moreover, the App Economy served as an important engine for the long economic expansion that was ended by the pandemic in February 2020. The table below show our estimates of App Economy employment, going back to fall 2011. The table also includes an interpolated estimate for February 2020, the last pre-pandemic month.

We find that from July 2008 to February 2020  the App Economy generated a total of 2.4 million jobs, compared to the roughly 15 million nonfarm payroll jobs created by the whole U.S. economy. So an estimated 16% of net job growth since the creation of the App Store in July 2008 has come from the App Economy.

These calculations come with caveats, of course. We are tracking App Economy jobs by analyzing online job postings, an indirect methodology that is not as reliable as direct job counts. But it’s also true that the App Economy has transformed the way that people spend their time. According to one survey, American adults spent more than 2 ½ hours per day on mobile apps in 2019.  By comparison, government data shows the average American spends about 2 hours per day preparing meals, eating, and cleaning up afterwards.


The Rise of the App Economy, 2008-2020

Date of Estimate Date of Publication App Economy Jobs (thousands) Nonfarm payroll jobs (millions)
July 2008 Creation of App Store 0 137.5
November 2011 February 2012 466 132.7
April 2012 October 2012 519 133.8
June 2013 July 2013 752 136.3
December 2015 January 2016 1660 143.1
December 2016 May 2017 1729 145.4
April 2019 September 2019 2246 150.5
February 2020 interpolated 2417 152.5
August 2020 August 2020 2520 139.6 (July)
Data: South Mountain Economics, Progressive Policy Institute


We can do a similar calculation for the iOS and Android ecosystems as well, as the table below shows. The iOS ecosystem contributed an estimated 14% of net job growth from the creation of the App Store in July 2008 to February 2020, the peak month before the pandemic started.  Similarly, the Android ecosystem contributed an estimated 13% of net job growth between July 2008 and February 2020.


The App Economy’s Contribution to Job Growth

(share of nonfarm payroll job growth, July 2008-February 2020*)

All App Economy jobs 16%
iOS ecosystem 14%
Android ecosystem 13%
*Based on an interpolated estimate. Many App Economy jobs belong to both ecosystems. Data: Progressive Policy Institute


What about on the state level? Here are the top 20 states, ranked by the number of App Economy jobs as of August 2020.


App Economy Jobs by State, August 2020

(Thousands)
California 531
Texas 199
New York 184
Florida 123
Virginia 115
Washington 114
Illinois 95
Massachusetts 90
Maryland 79
Pennsylvania 77
Georgia 73
North Carolina 70
Ohio 67
Colorado 60
New Jersey 59
Michigan 56
Minnesota 42
Arizona 39
Oregon 33
Tennessee 31
Data: Progressive Policy Institute


Congressman Don Beyer on the Path Out of the COVID-19 Economic Crisis

PPI President Will Marshall and Ben Ritz from the Center for Funding America’s Future are joined by Congresswoman Don Beyer (VA-8), Vice Chair of the Joint Economic Committee, to talk about the fiscal health of the United States, the path out of the economic crisis caused by COVID-19, the role automatic stabilizers should play as America works to build a resilient recovery, and the Worker Relief and Security Act.

The Trump Party’s war on reality

The perverse joke at the heart of so-called reality TV is that it is totally fake — full of cartoonish heroes and villains and contrived dramas. Just like pro wrestling, the Trump presidency, and this week’s Republican National Convention.

It was a slickly produced, flag-bedecked exercise in mass delusion. In the squalid, everyday reality of his presidency, Donald Trump is a fumbling, dissembling, chaotic mess of a “leader” whose MO is denying the nation’s most urgent problems and deflecting blame on others for his failure to manage them effectively.

In the spectacle of the last four nights, however, Trump was anointed America’s only hope for salvation. Speaker after speaker extolled a beaming Trump for his “decisive action” against COVID-19, an inversion of reality that would make George Orwell dizzy. In his acceptance speech last night, Trump lauded himself, with characteristic hyperbole, for having ordered an “unprecedented national mobilization” against the “China virus,” even as the United States leads the world in COVID-19 deaths and infections.

The week featured what you would expect from the Trump Party: a Niagara of lies about the fictitious evils stalking America — socialism, anarchy in the streets, a plot to abolish the suburbs, Chinese leaders who deliberately loosed a deadly disease on the world, the betrayal of U.S. workers and assaults on religion and gun rights, etc. — and about Trump’s supposedly heroic, solitary battles on behalf of embattled Americans who still love their country.

The most overtly bigoted president in modern U.S. history trotted out people of color to pay tribute to his color-blind compassion, and Trump shamelessly repeated his risible claim to have done more for Black Americans than any president since Abraham Lincoln.

In cult-like fashion, family members and administration flunkies parroted the Great Leader’s own talking points, such as his easily disproven claim that Trump had built the “greatest economy in world history” before the Chinese bushwacked him with the coronavirus. In the absence of a record of real accomplishments to run on, as Barack Obama said at the Democratic Convention, Trump just “makes stuff up.”

Read the full piece here.

Denier-in-chief: Trump, COVID and climate change

It is a tale of two worlds. In Real World, the COVID scourge continues to inflict massive human suffering and economic costs on the American people. More than 177,000 Americans have died. More than 5.7 million have been infected. These are by far the largest tolls in the world. No wonder the U.S. economy is now a basket case.

More than 22 million jobs were lost in April alone, and many more in March and May, yet only 42% of those jobs have returned. Even with so many jobless Americans waiting to go back to work, job growth has slowed with July employment less than half that of June, and August looking weaker still.

This is the worst job market since the Great Depression. Yet after more than almost nine months, the Trump administration still does not have a coherent or effective national COVID-19 strategy, and Senate Republicans went on vacation rather than pass unemployment extensions for millions of jobless Americans.

But as his convention continues, the president seems to reside in Trump World, a land of alternative facts where everything appears fine. Late last week, Trump called his presidency the “most successful period of time in the history of our country, from every standard” and said his administration has “demonstrated over the last four years the extraordinary gains that are possible.”

Meanwhile, this week heatwaves, wildfires and hurricanes, all made much worse by climate change, are devastating communities and making life unbearable for tens of millions of Americans across the country.

In California, a massive heatwave scientists say is exacerbated by climate change has led to 600 separate fires, including the second and third largest in state history, which have killed seven people thus far. More than one million acres have burned, three times the annual average, just in the last nine days. More than 100,000 people have been evacuated. Even as the coronavirus pandemic increases respiratory illness, air quality has been fouled for tens of millions across the West.

Read more here.

The Trump Party’s Festival of Fear

The 2020 Republican National Convention ostensibly opened last night, but few Republican leaders or ideas traditionally associated with the party were on display. Instead, viewers entered into the fevered world of the GOP’s replacement: the Trump Party.
Much of the show, naturally, featured Trump himself. Often his disembodied voice bellowed familiar slogans and boasts against a backdrop of American flags, syrupy music and canned applause. Especially cringeworthy were several scenes in which “ordinary Americans” gathered, maskless, around the Great Man himself, who beamed benignly as they heaped fulsome praise on his heroic services to America. “I am so in awe of your leadership,” gushed a woman who identified herself as a nurse.
The spectacle was a dreary reminder that the Trump Party inhabits an alternate political universe, constructed by Fox News –its Pravda — and other right-wing media, where life’s discomforting realities and complexities are not allowed to intrude. And despite Trump’s promises of a “positive” and hopeful convention, the dominant notes were fear and anger.
Although she wasn’t billed as such, the real keynoter of the night was Donald Trump, Jr.’s girlfriend, Kimberly Guilfoyle. She glowered and shouted her way through a long harangue against the Trump Party’s stock villains: socialists, the media, cancel culture, cosmopolitan elites, rioters and Democrats who “want to destroy our country.”
Some other takeaways from last night’s festival of fear:
  • Team Trump is deeply worried that voters will hold the president responsible for bungling the nation’s response to coronavirus pandemic. Much of the show was devoted to testimony from nurses and doctors attesting to Trump’s “decisive leadership” in combatting the virus. That was one of the night’s mantras, alongside the equally implausible claim that Trump had built “the greatest economy the world has ever known” before the pandemic.
  • Racially tinged cultural themes, especially law and order, will again be front and center. Speaker after speaker accused Democrats, falsely, of wanting to “defund the police.” Mark and Patricia McCloskey, the St. Louis couple charged with pointing a gun at protesters, warned that “your family will not be safe in the radical Democrats’ America.” For good measure, they accused Joe Biden and the Democrats of “encouraging anarchy and chaos on our streets,” scheming to deprive people of their gun rights and “abolish the suburbs by ending single family zoning.”
  • In lieu of a governing philosophy and agenda, the Trump Party has a laager mentality. It feels culturally besieged and is held together only by a visceral hatred of the “liberal” media, Democrats and what America is becoming – a multiethnic democracy no longer dominated by descendants of immigrants from northern Europe. It exists not to govern – the party didn’t even bother to produce a platform – but to keep its enemies from governing.
For progressives, the good news in all this is that the Trump Party has little interest in persuasion. It’s aiming its appeals at the dwindling ranks of white, blue collar voters who put Trump over the top – by an excruciatingly thin margin of 77,000 votes – in the Electoral College in 2016. It’s doubling down on intensifying a sense of white grievance to hold back the inexorable tide of America’s changing demography.

PODCAST: Congressman Don Beyer on the Path Out of the COVID-19 Economic Crisis

PPI President Will Marshall and Ben Ritz from the Center for Funding America’s Future are joined by Congressman Don Beyer (VA-8), Vice Chair of the Joint Economic Committee, to talk about the fiscal health of the United States, the path out of the economic crisis caused by COVID-19, the role automatic stabilizers should play as America works to build a resilient recovery, and the Worker Relief and Security Act.

Listen on Breaker.

Listen on Google Podcasts.

Listen on Overcast.

Listen on Pocket Casts.

Listen on Radio Public.

Listen on Spotify.