WASHINGTON — Real wages were well below historical trends going into the 2024 election, despite strong economic growth. At the same time, the latest job release from the Bureau of Labor Statistics shows that foreign-born workers now account for more than 19% of U.S. employment, up sharply in recent years.
A new report from the Progressive Policy Institute (PPI), titled “Real Wages, Immigration, and the Election,” explores how the combination of weak real wages and the historic jump in immigration in 2023 and 2024 became a major factor in the 2024 election outcome. Authored by Dr. Michael Mandel and Andrew Fung, the report argues that voters were not misinformed about the economy, as some political analysts suggested. Instead, they accurately recognized that their real wages had fallen behind pre-pandemic trends.
“Our research shows that real wages were far weaker than expected,” said Michael Mandel, PPI Vice President and Chief Economist. “That reality shaped voter attitudes in 2024, and Democrats were unprepared for the backlash.”
Key findings include:
Real wages fell during the post-pandemic inflationary surge, but unexpectedly did not fully recover when inflation abated, leading to what the report calls a “wageless economic boom.”
Legal immigration is a clear positive for the country in the long run. But foreign-born workers accounted for nearly 90% of total employment growth from 2019 to 2024, suggesting a short-term connection between stagnant real wages and the jump in immigration.
Democrats misread the political landscape by touting indicators such as job creation and GDP while failing to address voters’ economic discontent about wage growth.
“Real wages need to be at the center of economic policymaking and political strategy,” said Andrew Fung, PPI Policy Analyst. “If voters feel they’re falling behind financially, no amount of strong GDP numbers or job gains will change their minds.”
With the 2024 election serving as a wake-up call, Democrats must recalibrate their economic message — focusing on real wage growth and cost-of-living improvements — to regain trust among working-class voters.
Founded in 1989, PPI is a catalyst for policy innovation and political reform based in Washington, D.C. Its mission is to create radically pragmatic ideas for moving America beyond ideological and partisan deadlock. Learn more about PPI by visiting progressivepolicy.org. Find an expert at PPI and follow us on X.
In retrospect, the Biden Administration ran an unprecedented political economy experiment: What happens when a massive jolt of investment spending runs into historic levels of immigration? The outcome turned out to be an odd and confusing mixture of good news and bad news that no one expected. Gross domestic product and employment both soared well above pre-pandemic forecasts. These strong headline macroeconomic indicators gave many Democrats a false sense of security going into the 2024 election.
But despite the unanticipated strength of hiring, real wage growth slowed to a crawl. In its August 2019 economic outlook, the Congressional Budget Office had forecast that private sector wages and salaries, adjusted for inflation, would rise by about five percentage points over the next five years. In fact, by this measure, real wages did not rise at all from 2019 to 2024 — a “wageless economic boom” that soured many voters on Democratic candidates.
Real wages surged during the early days of the pandemic, fell during the inflationary period, and then started to climb again. But, surprisingly, the gap between the projected real wage and the actual real wage did not narrow in 2023 and 2024.
What happened? The obvious answer is inflation. Rising prices for food, energy, housing, and other essentials created a cost-of-living crisis, which eroded real wages. As PPI has written, the surge in inflation was at least partly due to high levels of government spending, including Biden’s hallmark investment legislation.
But government spending alone doesn’t explain the inability of wages to keep up with rising prices, which had such an impact on the election. All other factors being equal, after the initial inflationary shock, strong job growth and lots of job openings should have allowed workers to negotiate higher wages with employers. Instead, wages showed a weak response to inflationary pressures.
So why did real wages not rebound faster in 2023 and 2024? The Federal Reserve’s attack on inflation by raising interest rates is likely part of the cause. But GDP growth stayed strong, and the economy never came close to recession.
Given the timing, one important potential contributor to the real wage slowdown is the historic surge of immigration in 2022, 2023, and 2024, which added millions of new workers to the labor market in a short period of time. New estimates from the Census Bureau, released in December 2024, confirm that foreign-born immigration soared to over 2.5 million in 2023 and over 3 million in 2024.
BLS data shows that foreign-born workers accounted for 89% of employment growth from 2019 to 2024. And a May 2024 paper from the Federal Reserve of Kansas City draws a link
between immigration and wages, at least for the post-pandemic period:
….Industries and states that experienced larger increases of immigrant workers tended to see more deceleration in mean hourly earnings growth rates between 2021 and 2023.
Let’s be very clear. PPI believes that, in the long run, increased legal immigration represents a clear positive for the country in both the economic and social sense. We strongly support expanding pathways for legal immigration to help meet America’s future demographic, workforce, and innovation aspirations, while taking sustained action to minimize illegal immigration in a manner consistent with our values. This balance is necessary for keeping America the vibrant, resilient, and robust culture and nation it is today.
However, it’s increasingly clear that Democrats made a huge political mistake in the 2024 election by not acknowledging the short-term economic impacts of historic levels of immigration. This policy brief will draw connections between the time path of real wages, the unexpected immigration surge of 2023 and 2024, and the outcome of the 2024 elections. We will not be discussing here whether the Biden Administration should have followed different investment spending or immigration policies. These are complicated questions that require weighing a variety of short-term and long-term benefits and costs.
Rather, our goal is to offer a possible explanation of the divergence between the rosy headline macroeconomic indicators in 2024 and the consistent negativity of voters about their economic prospects. This negative real wage shock amplified voter concerns about issues such as immigration, trade, technology, and housing. Immigration is especially important for understanding the election.
We can’t say for certain that the weakness in wage growth in recent years was caused by the latest surge in foreign immigration. Whether or not immigration was responsible for slow wage growth during this period, voters do not think like economists. As such, it is not surprising that many made a connection between the immigration surge and the weakness in real wages, given what they see in their daily lives.
This analysis has several political implications. First, voters were not suffering from misinformation when they blamed Biden for the economy. People knew that their real wages and real incomes were below pre-pandemic trends, and they resented the Democrats telling them how well they were doing.
Second, Democrats likely were held accountable not simply for the 2021-22 inflationary surge but for the inability of real wages to recover back to trend in 2023 and 2024. Third, this analysis offers insight into what could have been done better and how Democrats can avoid the same pitfalls moving forward. In particular, Democrats need to use real wages to help set a political context for policy goals. This time, the issues were government spending, inflation, and immigration. In the next election, the key issues may be different. But taking changes in real wages seriously will help align Democrats with the concerns of working Americans.
Ed Gresser from the Progressive Policy Institute discusses the inflationary impact of tariffs, as he reacts to the Trump administration’s imposition of levies on steel and aluminum imports.
The anniversary of the Yalta Conference, which ended 80 years ago this week in a Soviet-occupied Crimean resort on the Black Sea, has a special significance in central and eastern Europe—and not just because it took place in a Ukrainian city that Russian soldiers once again occupy.
At the time, in the U.S and allied countries, the agreement between Franklin D. Roosevelt, Winston Churchill, and Josef Stalin was hailed as a historic breakthrough, one step away from the end of World War II and proof positive that the U.S. and the Soviet Union would continue to cooperate in the postwar era. The countries in what would soon be known as the Soviet sphere of influence felt no such euphoria. They understood right away, as Americans would learn in coming months, that the upshot of the conference was to cement Soviet control over a broad swath of eastern Europe—countries from Ukraine to Estonia, more than a thousand miles north.
It’s an anniversary that holds important lessons for Donald Trump, unlikely as it is that he is reading history as he prepares to sit down with Vladimir Putin and perhaps once again carve up the territory in this much-contested corner of Europe.
In just three weeks, President Trump has set an all-too-familiar tone for his White House sequel: chaotic, dishonest, bullying and contemptuous of the rule of law.
Only it’s worse this time because Trump erroneously believes his narrow victory last November — he won the popular vote by just 1.5 percent — has given him a mandate to rule the U.S. by decree.
He’s lashing out madly in every direction — threatening our neighbors with massive tariffs, bullying small countries like Denmark and Panama whose territory he covets, proposing to depopulate and take over Gaza and settling scores with the very government he heads, which he imagines to be his worst enemy.
Americans are witnessing a naked power grab that would shred the Constitution’s checks and balances, rob Congress of its most important powers, neuter the courts and create the imperial presidency that Richard Nixon dreamt of long ago.
From our Budget Breakdown series highlighting problems in fiscal policy to inform the 2025 tax and budget debate.
Both on the campaign trail and in his time as president, Donald Trump has hailed tariffs as “the greatest thing ever invented.” There’s seemingly no problem these taxes on imports can’t solve: paying for his legislative agenda, closing trade deficits, exacting diplomatic concessions, and more. Yet, in reality, the tariffs Trump began enacting this week are bad tax policy that don’t raise much revenue but do raise costs for American businesses and households.
This week began with Trump announcing his intent to impose a 25% tariff on goods from Canada and Mexico and an additional 10% tariff on goods from China. The new tariffs on China went into effect on Tuesday, while those on Mexico and Canada were only temporarily delayed after last-second agreements with their respective leaders. Together, Mexico, China, and Canada make up a substantial amount of U.S. trade — roughly 44% of all imported goods — with important imports ranging from oil and lumber to computers and produce. And this is likely to only be the beginning of Trump’s trade wars, as he’s promised to impose similar measures on the European Union, which represents another 17% of imported goods.
There are plenty of serious problems with these aimless and destructive tariff policies. By targeting Canada and EU allies, the United States is eroding vital diplomatic partnerships at a time when it should be strengthening them to counter rising threats from Russia, China, and Iran. These unilateral tariffs also represent a blatant disregard for the U.S. Constitution, which clearly assigns the power to levy taxes to Congress, not the president. By circumventing the legislative process to impose sweeping tax hikes, Trump is concentrating power in the executive and diminishing the fiscal checks and balances essential for our democracy.
But beyond these grave concerns, tariffs are simply bad tax policy. One of Trump’s central justifications for the new tariffs is that they will raise revenue that can be used to offset cuts to other taxes — even suggesting that they could replace income taxes entirely. But estimates for this latest round of tariffs show that, if implemented, they would raise only $1.3 trillion over ten years. That is less than one-third of what it would cost to extend the expiring provisions of the Tax Cuts and Jobs Act over the same period. Even if Trump imposed tariffs on all imported goods at the revenue-maximizing rate — estimated to be around 50% — they would likely still be insufficient to finance the full Trump agenda that some Republicans have estimated could cost as much as $10 trillion, much less replace the roughly $35 trillion the income tax will raise over the next ten years.
Not only do tariffs raise less revenue than income taxes, they do so in a way that is less fair. The tariff schedule currently has over 11,000 different rates depending on the type of good, its composition, and the county of origin. This complexity invites special interest carveouts and results in disproportionately higher tariffs on the goods that lower- and middle-income households consume. For example, expensive silver spoons currently face much lower tariffs than steel spoons, and cheaper clothing made from polyester and wool faces higher tariffs than more luxurious counterparts such as silk or cashmere. Well-resourced lobbyists and businesses are already seeking to carve out their own exemptions from Trump’s new tariffs, leaving the remainder of Americans with higher tariff rates.
The American people will pay the price for such bad tax policy. Businesses that rely on imported goods or components would face higher input costs for production. These higher costs would then be passed down to consumers in the form of higher prices, raising the cost of everyday goods, from food to clothing to gas. Tariffs would also harm export-reliant industries — such as agriculture, energy, and manufacturing — by strengthening the dollar and inviting retaliatory measures, thereby lowering demand for American goods overseas. Overall, estimates suggest that these measures could hike taxes on the average American household by nearly $1,000 while the resulting decline in economic output could eliminate 330,000 jobs.
Rather than foster economic growth and prosperity, tariffs create economic uncertainty and chaos. If Trump continues to lean on them as his favorite policy tool, he will unnecessarily burden American households and cause massive economic disruptions for businesses. Instead of standing idly by to enable aimless trade wars, Congress should look to the alternative trade agenda recently outlined by PPI, which focuses on lowering costs for Americans, promoting the global competitiveness of U.S. industry, and strengthening vital partnerships abroad.
In this episode of Trade Splaining, hosts Rob and Ardi dive into the latest on tariffs, AI disruptions, and surprising tourism trends. We break down the new wave of tariffs, their impact on global trade, and what they signal for U.S. economic strategy. Plus, we explore China’s DeepSeek AI breakthrough, the EU’s struggle to stay competitive, and Switzerland’s unexpected move to expand free trade amid growing protectionism.
We also speak with Ed Gresser, VP of the Progressive Policy Institute, who helps unpack tariff escalation, economic shifts, and the power of data in today’s rapidly evolving trade landscape.
Trump has made reducing the trade deficit “to zero” a primary goal of his trade policy, White House trade counselor Peter Navarro said Tuesday at a POLITICO event where he blamed imports for millions of lost jobs, thousands of factory closings and a grim trail of divorces, alcoholism, drug addiction and death among America’s working class.
However, that’s a slanted view of imports, which lower costs for consumers and U.S. manufacturers, thereby supporting jobs in the United States, said Ed Gresser, vice president in charge of trade at the Progressive Policy Institute, a Democratic think tank. It also ignores the role that technology has played in manufacturing job losses, he said.
In addition, even though the goods trade deficit now is regularly above $1 trillion, it remains relatively small as a percentage of the U.S. economy, which has continued to grow over the years. In fact, the trade deficit is most likely to decline “when the economy goes really bad,” said Gresser, from the Progressive Policy Institute.
“The biggest trade deficit reductions we’ve had in the 21st century were during the financial crisis in 2009 and the Covid pandemic in 2020,” Gresser said. “That type of experience is quite effective at reducing trade deficits, but it always comes with many fewer jobs and depressed economies. It does not come with numerous openings of factories.”
Gresser, an economist and former U.S. trade official, said Trump’s first term provided a real-world example of why more tariffs won’t reduce the trade deficit.
That’s because the level of government spending plays a huge role in the macroeconomic factors that determine the size of the trade deficit. The Republican-led Congress cut far more in taxes during his first term than Trump raised in new tariff revenue, causing both the U.S. fiscal deficit and trade deficit to rise, Gresser said.
However, even if Republicans perfectly matched the multi-trillion-dollar cost of extending the 2017 tax cuts with trillions of dollars of new tariff revenue, that would not reduce the trade deficit, since the government’s fiscal deficit would remain the same, Gresser said.
“If you’re raising tariff rates and reducing income tax rates, the main thing you’re doing is shifting taxation from wealthy people to hourly wage workers and their families,” Gresser said. “That’s going to raise the cost of goods and have a big impact on reducing tax bills for the wealthiest people. Your impact on trade balance, if they offset exactly, will be nil.”
FACT:Canada, Mexico, and China are the U.S.’ three largest trading partners
THE NUMBERS: Temperature tonight in Lewiston, Maine – -5°
* Accuweather forecast. Minus five degrees in Fahrenheit system; Celsius equivalent -20°.
WHAT THEY MEAN:
Following up on our statement on Mr. Trump’s attempt to raise tariffs on products from Canada, Mexico, and China last Saturday — a 10% tax on smartphones, laptops, and other Chinese-assembled products in place and 25% taxation of Canadian and Mexican-made stuff perhaps in a few weeks — here are PPI’s four principles for response to tariffs and economic isolationism:
Defend the Constitution and oppose attempts to rule by decree;
Connect tariff policy to growth, work, prices and family budgets, and living standards;
Stand by America’s neighbors and allies;
Offer a positive alternative.
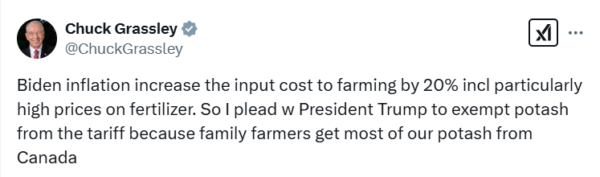
Regrettably, we’ll likely have a lot to say about these this year. Others, too. Here for example is Iowa Senator Charles Grassley on Monday, connecting tariffs to the daily farm economics:
“I plead w/ President Trump to exempt potash from the tariff because family farmers get most of their potash from Canada.”
Similar notes from other Republican Senators: Kevin Cramer (R-N.D.) worries about the loss of 80% of North Dakota’s export trade as, provoked beyond their normal good nature, Canadians publish retaliation lists; Susan Collins (R-Maine) thinks of Maine businesses and (noting this week’s Arctic-level Lewiston thermometer readings) fears a sudden spike in home heating bills:
“The Maine economy is integrated with Canada, our most important trading partner. Certain tariffs will impose a significant burden on many families, manufacturers, the forest products industry, small businesses, lobstermen, and agricultural producers. For example, 95 percent of the heating oil used by most Mainers to heat their homes comes from refineries in Canada.”
To put a number on this, Maine bought $2.73 billion worth of fuel oil, mostly for heating oil from Canada last year, so Mr. Trump’s midwinter 10% energy tariff would have hit the state’s 590,000 households with a new $270 million bill.
These tariff threats were only temporarily withdrawn Monday evening, though, and return in three weeks. So before they do, some stats on their potential impact for energy, food, consumer goods, and industrial supply costs in the United States; then a thought on the options open to the Senators and Reps. making these sorts of complaints.
Crude oil: Canada supplies about 60% of America’s crude oil imports, and Mexico another 10%. Even setting aside refined products like New England’s home heating oil, the two countries together provide about 30% of the crude oil American refineries use for gasoline, jet fuel, and locally refined heating oil. The value of crude alone last year came to $107 billion, meaning a 25% tariff at face value raises the refineries’ bills by about $27 billion, with the bill coming due later on for families at gas stations and in heating bills.
Toys: China ships about 80% of U.S. toys — $12 billion in 2023 — and Mexico another 5%, suggesting higher costs for birthday parties this spring and Christmas presents further ahead.
Phones and TV sets: China likewise supplies about 80% of the smartphones sold in the U.S. (with Vietnam and India as the other two suppliers). For TV sets, the Chinese share is a more modest 50%, and the Mexican share is 10%.
Groceries: Mexico is the U.S.’ top source of winter vegetables and fruit, supplying grocery stores with about $2.5 billion worth of fresh produce each month in wintertime. Last month, we noted that in February of 2024, this came to 188,640 tons of tomatoes, 128,330 tons of peppers, 106,460 tons of avocadoes, and 44,440 tons of lemons and limes. Here are some more February 2024 purchases: 44,000 tons of fresh strawberries and 26,000 tons of raspberries, 110,000 tons of jalapenos and other chili peppers, and 97,450 tons of cucumbers. One could go on.
Auto parts: Of the $139 billion worth of auto parts American factories and repair shops bought last year from abroad, $65 billion worth came from Mexico, $16 billion from Canada, and $12 billion from China. So expect your U.S.-made car to cost more and your repair bills to rise along with the gas prices.
The toy/phone/TV tariffs may or may not stay on, and the threats to impose tariffs by decree on purchases from Canada and Mexico come back in three weeks. What then are the Senators’ options? Their concern about rising costs for farmers and lobster boat captains, cold homes, threats to jobs, and stretched family budgets is actually linked very closely to the first principle of response — defend the Constitution and oppose attempts to rule by decree. The Constitution’s tariff clause is not at all blurry: “Congress shall have the Power to lay and collect Taxes, Duties, Imposts, and Excises.” So Republican Senators and Representatives have no need to plead for special carveouts and exemptions. They have all the power they need to keep potash and heating oil prices down, and to preserve Congress’ constitutional authority from Mr. Trump’s power grab, by voting. They just need to use it.
Ed Gresser is Vice President and Director for Trade and Global Markets at PPI.
Ed returns to PPI after working for the think tank from 2001-2011. He most recently served as the Assistant U.S. Trade Representative for Trade Policy and Economics at the Office of the United States Trade Representative (USTR). In this position, he led USTR’s economic research unit from 2015-2021, and chaired the 21-agency Trade Policy Staff Committee.
Ed began his career on Capitol Hill before serving USTR as Policy Advisor to USTR Charlene Barshefsky from 1998 to 2001. He then led PPI’s Trade and Global Markets Project from 2001 to 2011. After PPI, he co-founded and directed the independent think tank ProgressiveEconomy until rejoining USTR in 2015. In 2013, the Washington International Trade Association presented him with its Lighthouse Award, awarded annually to an individual or group for significant contributions to trade policy.
Ed is the author of Freedom from Want: American Liberalism and the Global Economy (2007). He has published in a variety of journals and newspapers, and his research has been cited by leading academics and international organizations including the WTO, World Bank, and International Monetary Fund. He is a graduate of Stanford University and holds a Master’s Degree in International Affairs from Columbia Universities and a certificate from the Averell Harriman Institute for Advanced Study of the Soviet Union.
Co-hosts Anne Kim and Garrett Epps speak with Tamar Jacoby, who is living and working in Kyiv as Director of the Progressive Policy Institute’s New Ukraine Project. She speaks about the future of Ukraine, the changing face of warfare, and Vladimir Putin’s potential ambitions in Europe.
This past November, Canada’s Liberal government ordered TikTok to dissolve its Canadian business operations on November 6. The act does not remove the ability for Canadians to download or access the app, or post content, but presents a significant business disruption. TikTok has challenged this mandate, filing an application for judicial review with Canada’s federal court.
This follows a more aggressive move by the U.S. Congress and the previous presidential administration to ban U.S. providers from providing hosting and other web services to TikTok, unless ByteDance divests from the app by January 19, 2025. Following a last-minute intervention by President Trump, TikTok was able to continue operating past the deadline but has still not returned to U.S. app stores and cannot be updated. Additionally, President Trump’s directive may be challenged in court and could fail before a more permanent solution is found.
The similar moves by the U.S. and Canada follow similar justifications. TikTok is owned by ByteDance, a Beijing-based company. According to TikTok, 60% of the company is owned by global investors, 20 percent is owned by its founders, and 20% is owned by its employees. And while it may be owned by a Chinese-based company, TikTok itself is headquartered in Los Angeles and Singapore. But as a result of ByteDance’s association with China, governments across the world have expressed concerns that influence by the Chinese government, which yields wide unilateral authority to affect corporate operations in the country, could be used to force tweaks to its algorithm to advance subversive content or misuse sensitive user data. The data at TikTok’s disposal is vast: the app has become a global phenomenon and economic powerhouse, attracting over 1 billion users worldwide. Over 170 million Americans and 14 million Canadians use the app.
This follows western relations with China growing increasingly tense in recent years. The West widely views the Chinese government as a foreign adversary, and American public opinion of China, for example, hit an all-time low in 2024.
While moves to restrict TikTok may seem like low-hanging fruit for hawkish policymakers, the proposals to do so do not address the real concerns that apps like TikTok, but also social media apps broadly, present to user privacy and security.
First, while concerns over national security risks by a known foreign adversary can be legitimate, Canada, the U.S., and various other countries have yet to present definitive proof that TikTok has misused user data or made material platform changes at the behest of the Chinese government. At this time, the justification for the laws targeting TikTok has been speculation.
As others have also pointed out, there is a broader concern in the TikTok debate about data privacy than just TikTok itself. TikTok, like many social media websites, collects and stores user data to reform its recommendation algorithms and ad targeting. However, as many have pointed out in opposition to the TikTok restrictions, this is not a unique feature of TikTok. All social media sites collect a plethora of user data for similar purposes. But if data privacy is the true concern, banning TikTok is only a small remedy to this issue that does not address the wider systemic need. Laws like Canada’s PIPEDA or California’s CCPA make progress on addressing this issue, but don’t go all the way to address the concerns laid out by data privacy activists.
Furthermore, TikTok is not uniquely vulnerable as a tool for the use of foreign interference. During the 2016 election, Facebook was used by Russian actors in an attempt to influence American public opinion on a large scale, and smaller attempts were made to use Google and Twitter for similar purposes. No evidence has been presented that TikTok has been used for foreign interference efforts.
TikTok serves as a lucrative platform for users, creators, and small businesses across the globe to build a virtual community. If users cannot access TikTok, they will simply move to alternative apps that can pose comparable or even more significant threats. We’ve already seen evidence of this movement in the wake of the U.S. TikTok ban. During the week leading up to January 19, U.S. downloads of RedNote — one of China’s most popular social media apps — nearly tripled, and over 700,000 new users joined the platform.
Outlawing TikTok in North America would have resounding economic and political consequences. According to an Oxford Economics report commissioned by TikTok, the app contributed over $24 billion to the U.S. GDP and $5.3 billion in tax revenue to the U.S. government in 2023. Presumably, a scaled impact on the Canadian economy and workforce would occur, too. If TikTok closes its operations in Vancouver and Toronto, hundreds of local jobs would be eliminated. Going after TikTok in North America not only has resounding economic repercussions — it is also an increasingly unpopular political position among voters. As of August 2024, only 32% of American voters supported a TikTok ban, falling from 50% in March 2023.
Forcing TikTok to dissolve its operations or outright banning the app is a temporary solution to the broader data and national security issues nations across the globe are facing. Federal governments can maintain the economic benefits of TikTok and act in accordance with the political interest of their voters, while preserving national security and protecting user data by adopting comprehensive data privacy policies.
One thing all Americans should be able to agree on is that our government (and how it operates) leaves a lot to be desired.
Unfortunately, Elon Musk and his Department of Government Efficiency (DOGE) seem ready to bring the same kind of arbitrary and ego-driven reforms that cut the value of Twitter (now X) by 80%, to the federal government. As its name implies, DOGE is supposed to focus on improving efficiency. But instead of presenting reforms to streamline government sensibly, Musk’s initial forays are mostly focused on political retribution and a desire to gut the federal workforce no matter the cost to efficiency, expertise, and security.
For too long both Republicans and Democrats have shied away from the hard choices needed to reform the federal government. If President Trump and Musk continue on their current path, another window of opportunity will have been tossed away. Fortunately, there is time to halt the madness, and instead adopt a reform agenda that draws on successful government reform initiatives—like the first Hoover Commission (1947 to 1949) and the Clinton-Gore reinventing government (REGO) policies—that offer a clear roadmap on how to save taxpayers dollars and enhance government performance.
In mid-2024, as the war in Ukraine ground into a third year and Western military aid showed ominous signs of flagging, Kyiv and its friends in Europe began moving toward a different approach: producing weapons closer to the fighting, on Ukrainian soil. This would require help from Europe and the U.S.—significant funding and oversight. But it promised in the long haul to reduce Ukrainian dependence on the West and, after the war, to provide a powerful new arsenal for Europe.
Denmark was the first country to participate, followed by other northern European nations, and early efforts were promising. Altogether in 2024, what became known as the “Danish model” provided more than a half billion dollars for Ukrainian weapons production, and the approach was warmly welcomed in Kyiv, with President Volodymyr Zelensky and others calling for its expansion in 2025.
Then, astonishingly, in late January, Ukrainian Defense Minister Rustem Umerov suspended the well-regarded director of the agency that had made the new approach possible by bringing transparency and accountability to the agency that purchases weapons and ammunition for the Ukrainian army.
WASHINGTON — Today, Ed Gresser, Vice President and Director for Trade and Global Markets at the Progressive Policy Institute (PPI), issued the following statement in response to President Trump imposing a 25% tariff on goods from Mexico and Canada, and a 10% tariff on Chinese goods:
“Mr. Trump’s use of a bad-faith ‘state of emergency’ to launch a bizarre and unprovoked economic attack on America’s closest neighbors and largest export markets is bad economics and bad national security. If sustained, it will mean higher prices for American families on everything from heating oil to fresh vegetables and auto repair bills, increased production costs for American businesses and lost export sales for farmers and manufacturers, diminished American influence in the world, and likely new — in fact, unprecedented — North American security problems for all of Mr. Trump’s successors. It is also bad tax policy: while unable to raise the revenue a modern government needs for defense, retirement, and health programs, tariffs very efficiently shift tax burdens from wealthy households to hourly-wage families, and from services businesses like real estate and financial services to manufacturers, retailers, restaurants, construction firms, and agriculture.
“As damaging as all this will be, the systemic implications of this step for American governance are even worse. One-man creation of a new tariff system is an open invitation to future corruption, as — aware they can create new tariff systems by themselves — all future presidents will face temptation to use tariffs to punish critics and rivals, and to reward supporters and cronies. Still more fundamentally, it usurps Congress’ Constitutional power over ‘Taxes, Duties, Imposts and Excises,’ and substitutes rule by personal decree for legitimate legislation. As such, today’s attempted action is a breach of the separation of powers and a threat to the Constitution. House Speaker Mike Johnson, Ways and Means Committee Chairman Jason Smith, and their Senate counterparts Majority Leader John Thune and Finance Committee Chairman Mike Crapo, must oppose this power grab and, per the Congressional oath of office, support and defend the Constitution.”
PPI recently outlined four key principlesfor responding to tariff-driven economic isolationism. Additionally, PPI has warned of the economic risks posed by Trump’s tariff policies in a recent report and detailed these concerns in testimony before Congress and in PPI’s own coverage. For further context on the Constitution over tariffs and taxation and how the legislative, not executive branch, has the authority, see the full text of the U.S. Constitution.
Founded in 1989, PPI is a catalyst for policy innovation and political reform based in Washington, D.C. Its mission is to create radically pragmatic ideas for moving America beyond ideological and partisan deadlock. Find an expert and learn more about PPI by visiting progressivepolicy.org. Follow us @PPI.
###
Media Contact: Ian O’Keefe – iokeefe@ppionline.org
National School Choice Week is a time to rediscover the embarrassment of rich educational opportunities in today’s K-12 public education. These opportunities include not only different school options like magnet schools, charter schools, and microschools. They also involve other educational options using open enrollment, dual enrollment, and career pathways programs. Many of these options have the added benefit of giving public school educators new options for their professional lives.