FACT: Energy makes up nearly a fifth of U.S. exports this year.
THE NUMBERS: Energy share of U.S. merchandise exports – 2022* 18.1%
2021 16.8%
2020 10.5%
2010 6.4%
2000 1.7%
1932 13.2%**
* Six months of available data, January-June 2022 ** Previous record
WHAT THEY MEAN:
Export growth figures are usually boring and small: A 2.3% growth rate might suggest a weak year; 7.5% or 10.2% a very good one; a drop of -2% would be exceptionally bad. Here are this year’s U.S. natural gas export rates to a string of European countries, based on the data available for the first six months of 2022:
Sweden
884%
Belgium
588%
Spain
394%
Italy
357%
France
352%
Poland
347%
Lithuania
274%
Netherlands
175%
U.K.
155%
What is going on here? Three things, one transitory and the other two suggesting an accelerating revolution in energy trade:
(a) The usual answer in natural-resource trade is the commodity markets. In the aftermath of Russia’s invasion of Ukraine, oil prices are up from $41.30 to $107 per barrel since 2020, and the International Monetary Fund’s index of natural gas prices is nine times its 2020 level. These effects are typically transitory – with prices up, export money goes up too; when they go back down, export earnings fall with them.
(b) The U.S. produces much more energy than before, propelled by investments made during the high-price China boom era, circa 2004-2012. The Department of Energy’s figures (measured by energy content) show U.S. production of oil, natural gas, and renewable energy up from 41 quadrillion BTUs in 2010 to 71 quadrillion BTUs in 2021. With a lot more available, the U.S. is accordingly exporting more than ever before.
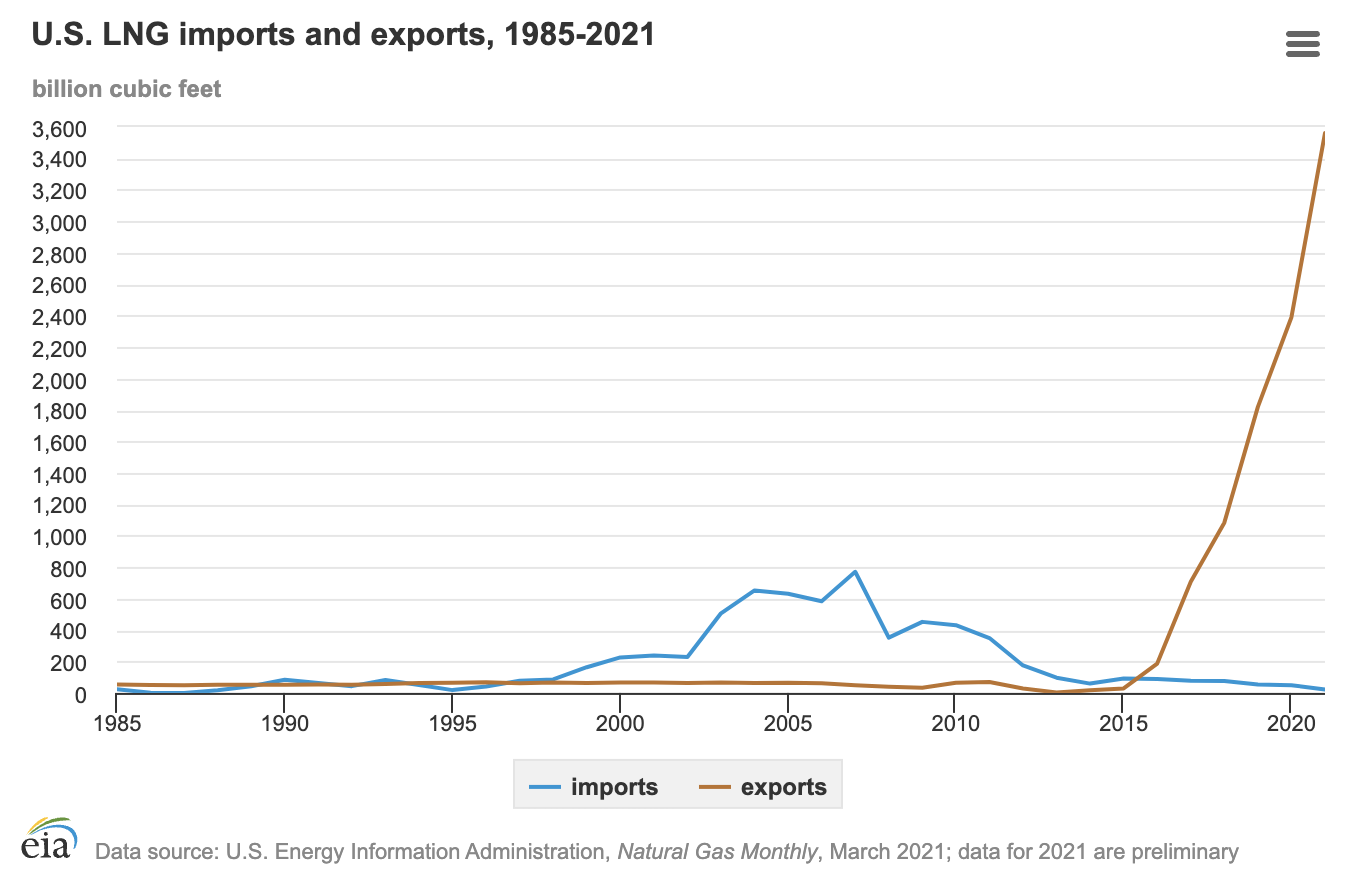
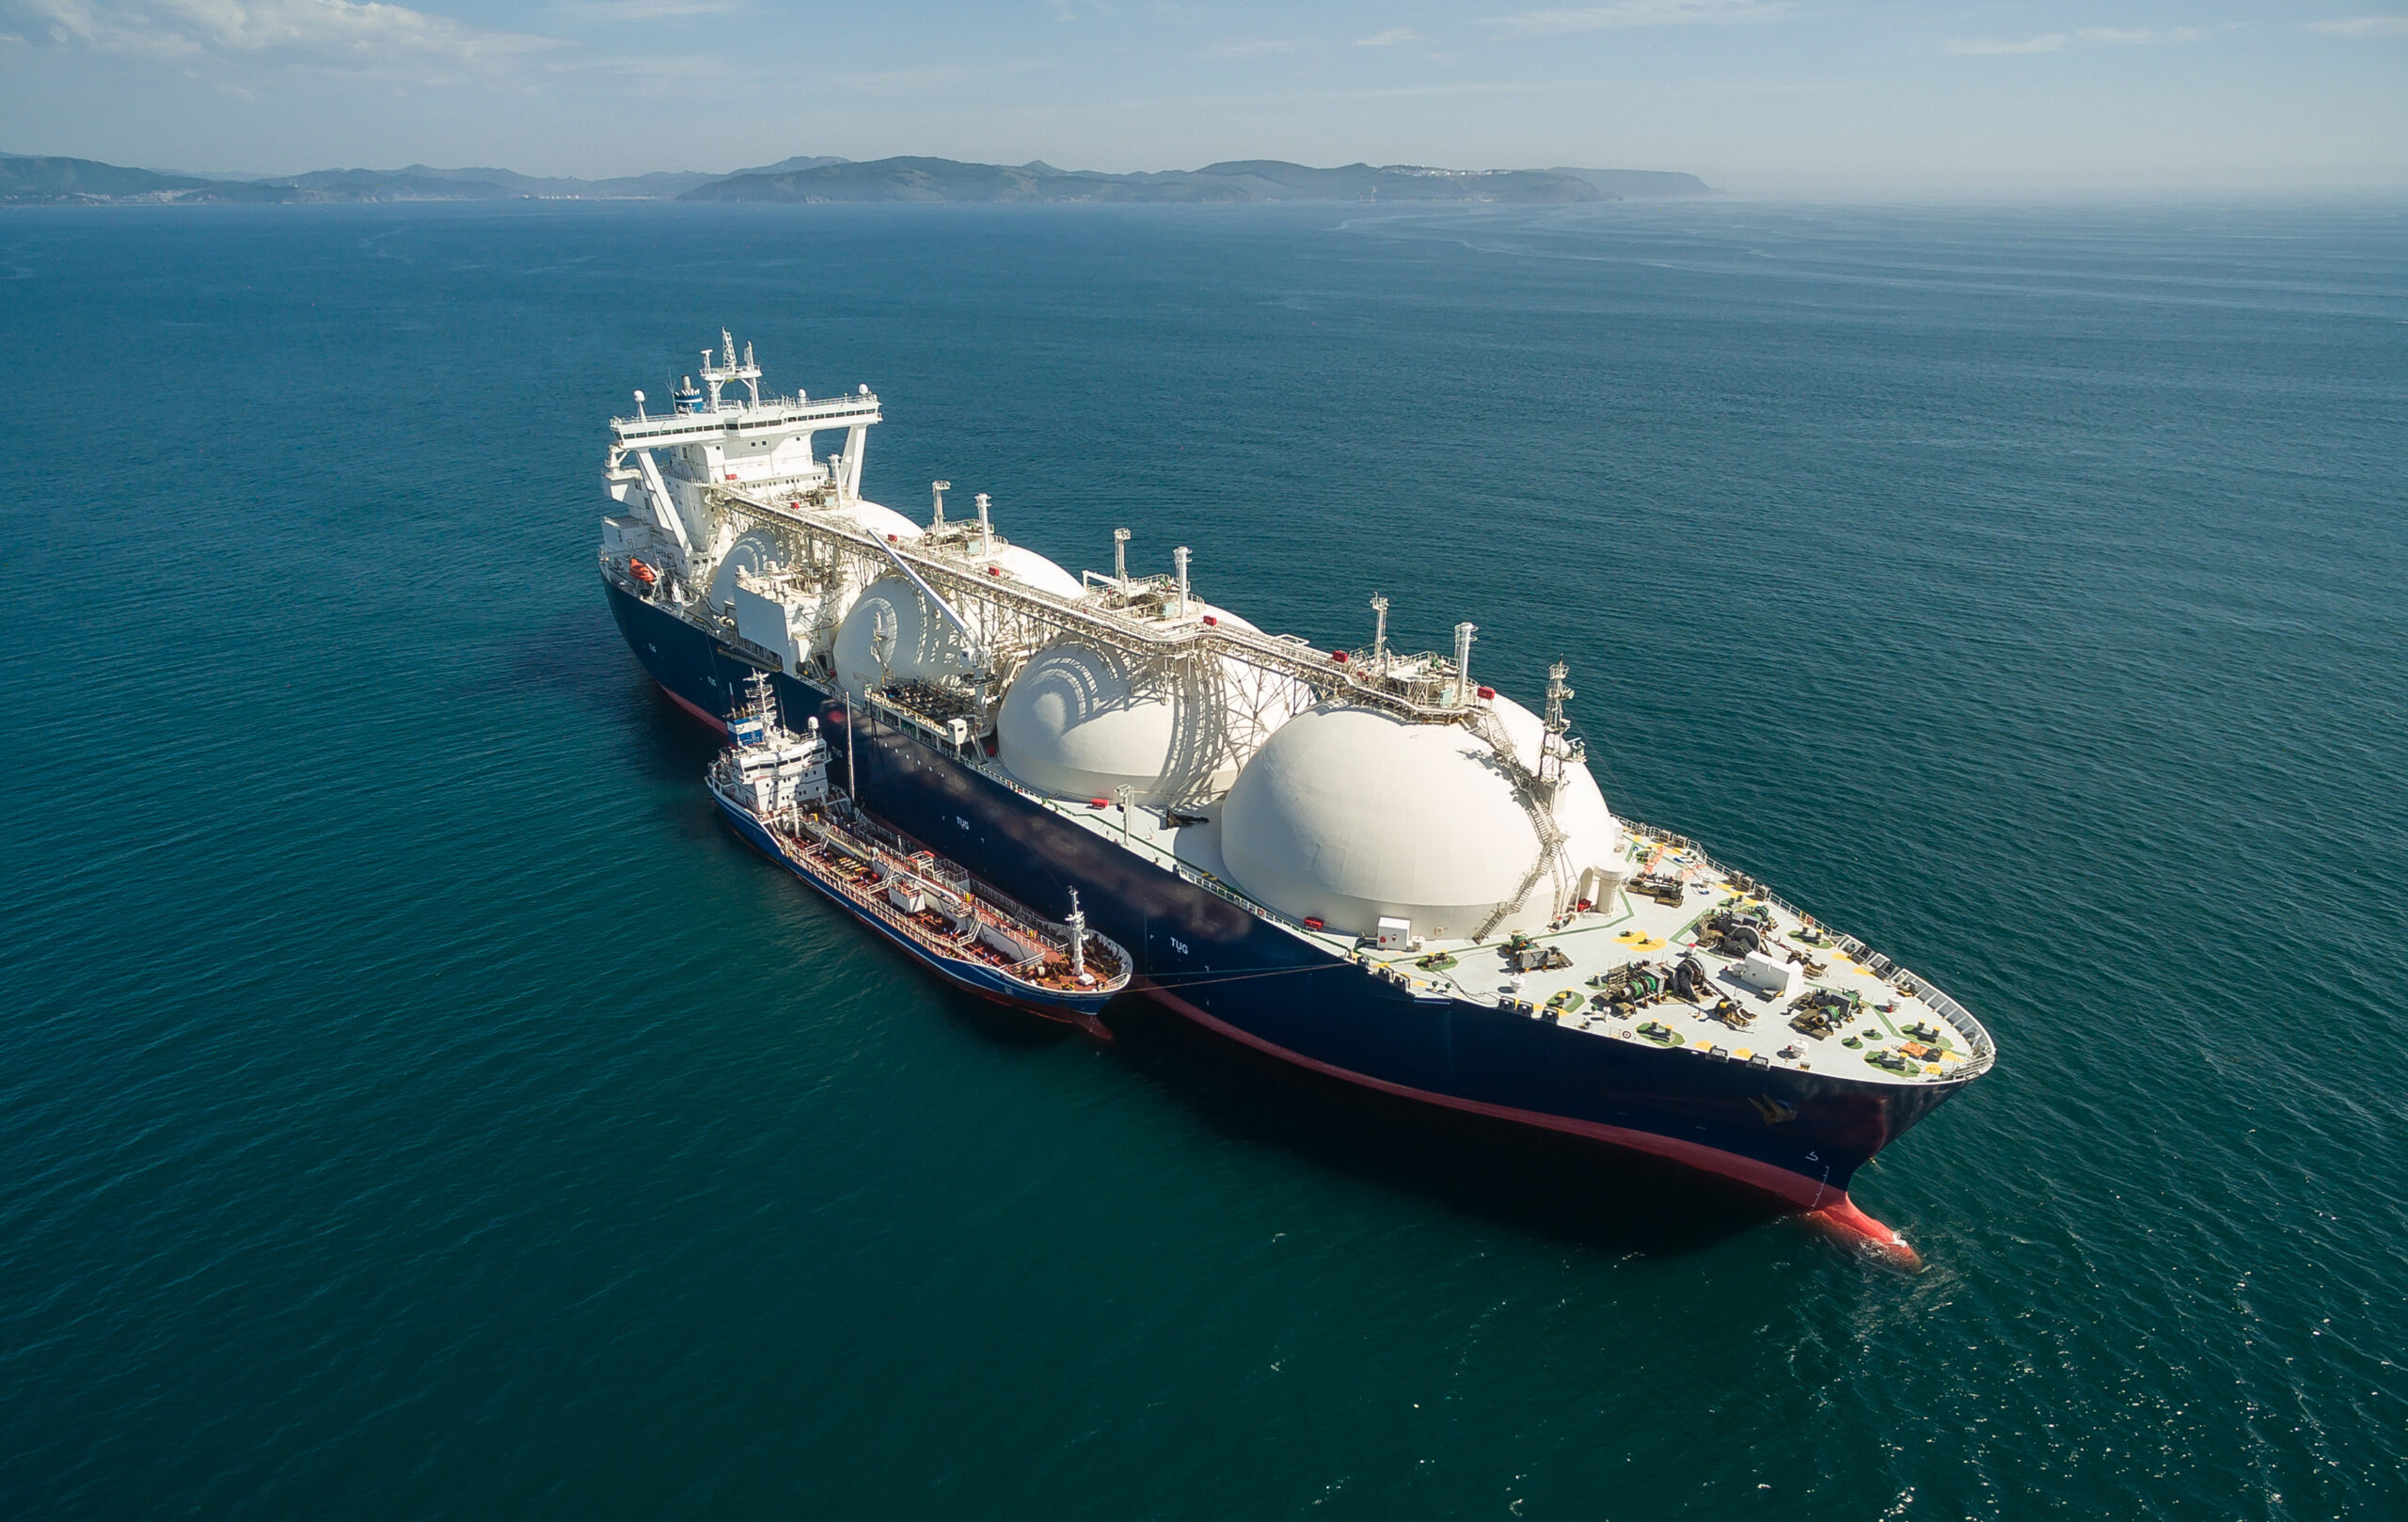
(c) Russia is no longer a reliable supplier. Russia’s use of energy supply as a political tool has convinced European buyers to find new sources, as PPI’s Paul Bledsoe very presciently advised three months before the invasion of Ukraine. American liquefied natural gas (LNG) is the logical replacement on security grounds, and a lower-methane emissions option as well). Louisiana in particular, home to two of the U.S.’ seven LNG terminals, has seen its exports double in two years; Gov. Edwards, noting that “market forces disrupting the world economy are creating a historic opportunity for our state,” plans a set of new infrastructure investments to help make the shift permanent.
Taken together, the figures reveal an incipient revolution in world energy trade. At 16.8% of American merchandise exports in 2021, and 18.1% through June of 2022, energy is already well above the 89-year-old record set in the Hoover administration. (At 13.2%, or $208 million of that year’s Depression-shrunken $1.58 billion in total U.S. exports.) Internationally, having surpassed Russia and Saudi Arabia last year, the U.S. is the world’s largest energy* exporter for the first time in a century. The dollar figures look like this:
The European Union’s Eurostat on energy imports from Russia (though only through 2021).
Sweden’s Energy Ministry reviews vulnerability to Russian energy coercion, March 2022.
ABOUT ED
Ed Gresser is Vice President and Director for Trade and Global Markets at PPI.
Ed returns to PPI after working for the think tank from 2001-2011. He most recently served as the Assistant U.S. Trade Representative for Trade Policy and Economics at the Office of the United States Trade Representative (USTR). In this position, he led USTR’s economic research unit from 2015-2021, and chaired the 21-agency Trade Policy Staff Committee.
Ed began his career on Capitol Hill before serving USTR as Policy Advisor to USTR Charlene Barshefsky from 1998 to 2001. He then led PPI’s Trade and Global Markets Project from 2001 to 2011. After PPI, he co-founded and directed the independent think tank Progressive Economy until rejoining USTR in 2015. In 2013, the Washington International Trade Association presented him with its Lighthouse Award, awarded annually to an individual or group for significant contributions to trade policy.
Ed is the author of Freedom from Want: American Liberalism and the Global Economy (2007). He has published in a variety of journals and newspapers, and his research has been cited by leading academics and international organizations including the WTO, World Bank, and International Monetary Fund. He is a graduate of Stanford University and holds a Master’s Degree in International Affairs from Columbia Universities and a certificate from the Averell Harriman Institute for Advanced Study of the Soviet Union.
Kahn will be placed within the New Democrat Coalition for a one-year period to support NDC’s communications efforts
Today, the Progressive Policy Institute (PPI) announced Louie Kahn has been hired as its second Congressional Communications Fellow, supporting the office of the New Democrat Coalition (NDC). This is a year-long fellowship, which supports Congress’s most important ideological caucus.
“I am excited to join the New Dem team and look forward to strengthening my communication skills while helping advance the goals of the Coalition,” said Louie Kahn. “As I continue pursuing a Master’s degree in Public Policy, I am eager to learn more about the inner workings of the legislative process and work where the fields of policy and communications intersect.”
PPI’s Congressional Fellowship program provides fellows with a unique opportunity to gain valuable Capitol Hill experience and learn more about the legislative process by working within the NDC. As a Communications Fellow, Kahn will report directly to NDC staff and work to support its communications team by helping draft press releases, plan public events, create social media content, and more. Prior to being selected for this fellowship, Kahn worked as a Digital Communications Fellow at PPI. He is currently studying to earn his Masters Degree in Public Policy at The George Washington University.
The Progressive Policy Institute (PPI) is a catalyst for policy innovation and political reform based in Washington, D.C. Its mission is to create radically pragmatic ideas for moving America beyond ideological and partisan deadlock. Learn more about PPI by visiting progressivepolicy.org.
The New Democrat Coalition is comprised of 99 forward-thinking House Democrats committed to pro-economic growth, pro-innovation, and fiscally responsible policies. Learn more about the Coalition and its members by visiting newdemocratcoalition.house.gov.
More than 100 election deniers have won Republican primaries across the country this year. It’s a woeful reminder that former President Trump’s seditious assault on U.S. democracy didn’t end with his followers’ failed coup attempt on Jan. 6, 2021.
This ominous trend makes the midterm elections much more than a referendum on President Biden’s job performance. But Republican extremism isn’t the only threat to our democracy.
A more subtle but corrosive danger is nosediving public confidence in the federal government’s ability to function effectively. According to the Pew Research Center, only 19 percent of Americans say they trust Washington to do the right thing “most of the time.” That’s near the historic low point in public confidence since Pew started measuring it in 1958.
At the same time, solid majorities of Americans believe government should play a “major role” in tackling national problems. Their qualms about government are practical, not ideological; centering more on its performance than its size.
The American Rescue Plan Act (ARP) passed in March 2021 provided $525 billion in COVID-19 relief to states and local governments, including $350 billion in Fiscal Recovery Funds (FRF) to prevent budget constraints from forcing public services cuts as they did after the 2008 recession. However, many states have ended up with budget surpluses as the economic situation has improved and are now debating the best uses for extra revenue, with some deciding to finance inflationary policies such as tax cuts and stimulus checks. States that are not doing so already should shift their uses of FRF to long-term investment and COVID-19 relief, which will not worsen inflation or create budgetary burdens in future years.
When the ARP was passed, states were given flexibility with funding use, but there were a few federal strings attached. These included prohibitions on making tax cuts above a certain size, funding public employee pensions, and paying off existing debts. However, many states have fought against the prohibition on tax cuts, with attorneys general in 21 states attempting to overturn it. State officials claim that tax cuts will provide consumers with additional resources to compensate for rising prices, but these tax cuts will only worsen inflation rates as people effectively bid up prices. No doubt tax cuts are popular, but states shouldn’t be using federal relief dollars to pump up demand, thereby contributing to a worsening inflationary cycle.
Tax cuts will also damage the states’ long-term fiscal health. After the 2008 recession, states faced funding shortfalls that resulted in public service cuts. This is precisely what the federal government sought to avoid with the ARP. State tax cuts will undermine this goal because some states have constitutional obstacles to raising taxes, like referenda or supermajority requirements, that make it harder politically to reverse tax cuts than to enact them. As a result, states are increasingly likely to face revenue shortfalls once ARP funding is exhausted.
Although Republican-controlled states are leading the tax-cutting craze, other states are pursuing inflationary policies as well. For example, California Governor Gavin Newsom (D) has proposed giving Californians $400 for every car owned by the household to defray sky-high gas prices. By insulating people from gas price spikes, this proposal would boost demand, putting upward pressure on prices just as they are beginning to fall back to earth. This proposal also comes with a high opportunity cost. As PPI’s Ben Ritz wrote recently for Forbes, the cost of this new fuel subsidy could pay for COVID-19 tests, vaccines, and treatments for the entire nation.
Meanwhile, the Republican-controlled government in Georgia approved stimulus checks of up to $500 for constituents, and Florida Governor Ron DeSantis (R) has supported a planned gas tax suspension in October, which would cost $200 million. Lawmakers on both sides of the aisle need to focus on their states’ fiscal well-being and keeping prices down instead of throwing federal dollars at their constituents.
The best way for states to help get inflation under control would be to pump the brakes on all un-offset spending for the foreseeable future. But since the federal government is requiring them to spend down their FRF within the next two years, and no governor is likely to leave that money on the table, states should focus on the most effective uses of funds which will improve long-term economic outcomes.
For example, states should start by fully funding public services if they are still experiencing revenue losses resulting from the pandemic. But because the ARP gave states far more money than they needed to fill budget shortfalls, relief funds will mostly need to be spent on new purposes. States should prioritize continuing the fight against COVID-19 infections, particularly as the highly contagious BA-5 variant spreads. More tests, treatments, and vaccines are needed, along with investments in medical facilities and equipment such as ventilators and PPE.
States could also use FRF for mental health and violence prevention programs. As of March 2022, the pandemic had caused a 25% increase in the prevalence of anxiety and depression as people faced fear, isolation, and grief. Increases in violence have also been observed, particularly in domestic violence against women who were isolated with their abusers, and in gun violence as structural inequities fueling gun violence worsened. Along with measures to fight COVID-19 infections, mental health and violence prevention programs can improve and even save lives, making them a worthwhile use of funding.
Another good use of FRF would be responding to pandemic-induced economic losses. Low-income households bore the brunt of COVID-19 deaths and job losses. They face the largest barriers to recovery and ought to be the focus of relief efforts. Investment in education is sorely needed to deal with steep learning losses for kids as well as many parents’ long absences from labor markets. Temporary expansions of tutoring and job apprenticeship programs can be scaled back more easily than tax cuts can be repealed.
Finally, states should use spare ARP funds to make one-time investments in infrastructure that will support economic growth for years to come. For example, business and school closings during the pandemic drove home the need for greater access to broadband. While the Infrastructure Investment and Jobs Act (IIJA) is providing funding for many new projects, ARP funding gives states the flexibility to meet the immediate needs of their communities without having to apply for specific grants. Investing in infrastructure, especially with one-time investments which will not create burdens in future years, will benefit citizens without harming states’ fiscal health or worsening inflation.
States should focus on projects that will not burden their budgets once FRF runs out and which will help citizens still battling the effects of the pandemic. Making investments in future economic growth and public service delivery, while continuing to fight COVID-19 infections, is a wiser course for states than burning through a one-time federal windfall.
FACT: Greenland is losing 280 billion tons of ice each year.
THE NUMBERS: Volumes of fresh water – Total worldwide: ~40.0 million cubic km
Antarctic ice sheets: ~24.7 million cubic km
Groundwater & permafrost: ~12.0 million cubic km
Greenland ice sheet: ~2.9 million cubic km
Glaciers and ice-caps: ~0.1 million cubic km
Lakes, ponds and rivers: ~0.1 million cubic km
WHAT THEY MEAN:
As Congress concludes its work on the “Inflation Reduction Act,” with its arrays of decarbonization and clean industry programs, a note from NASA’s climate program at Caltech:
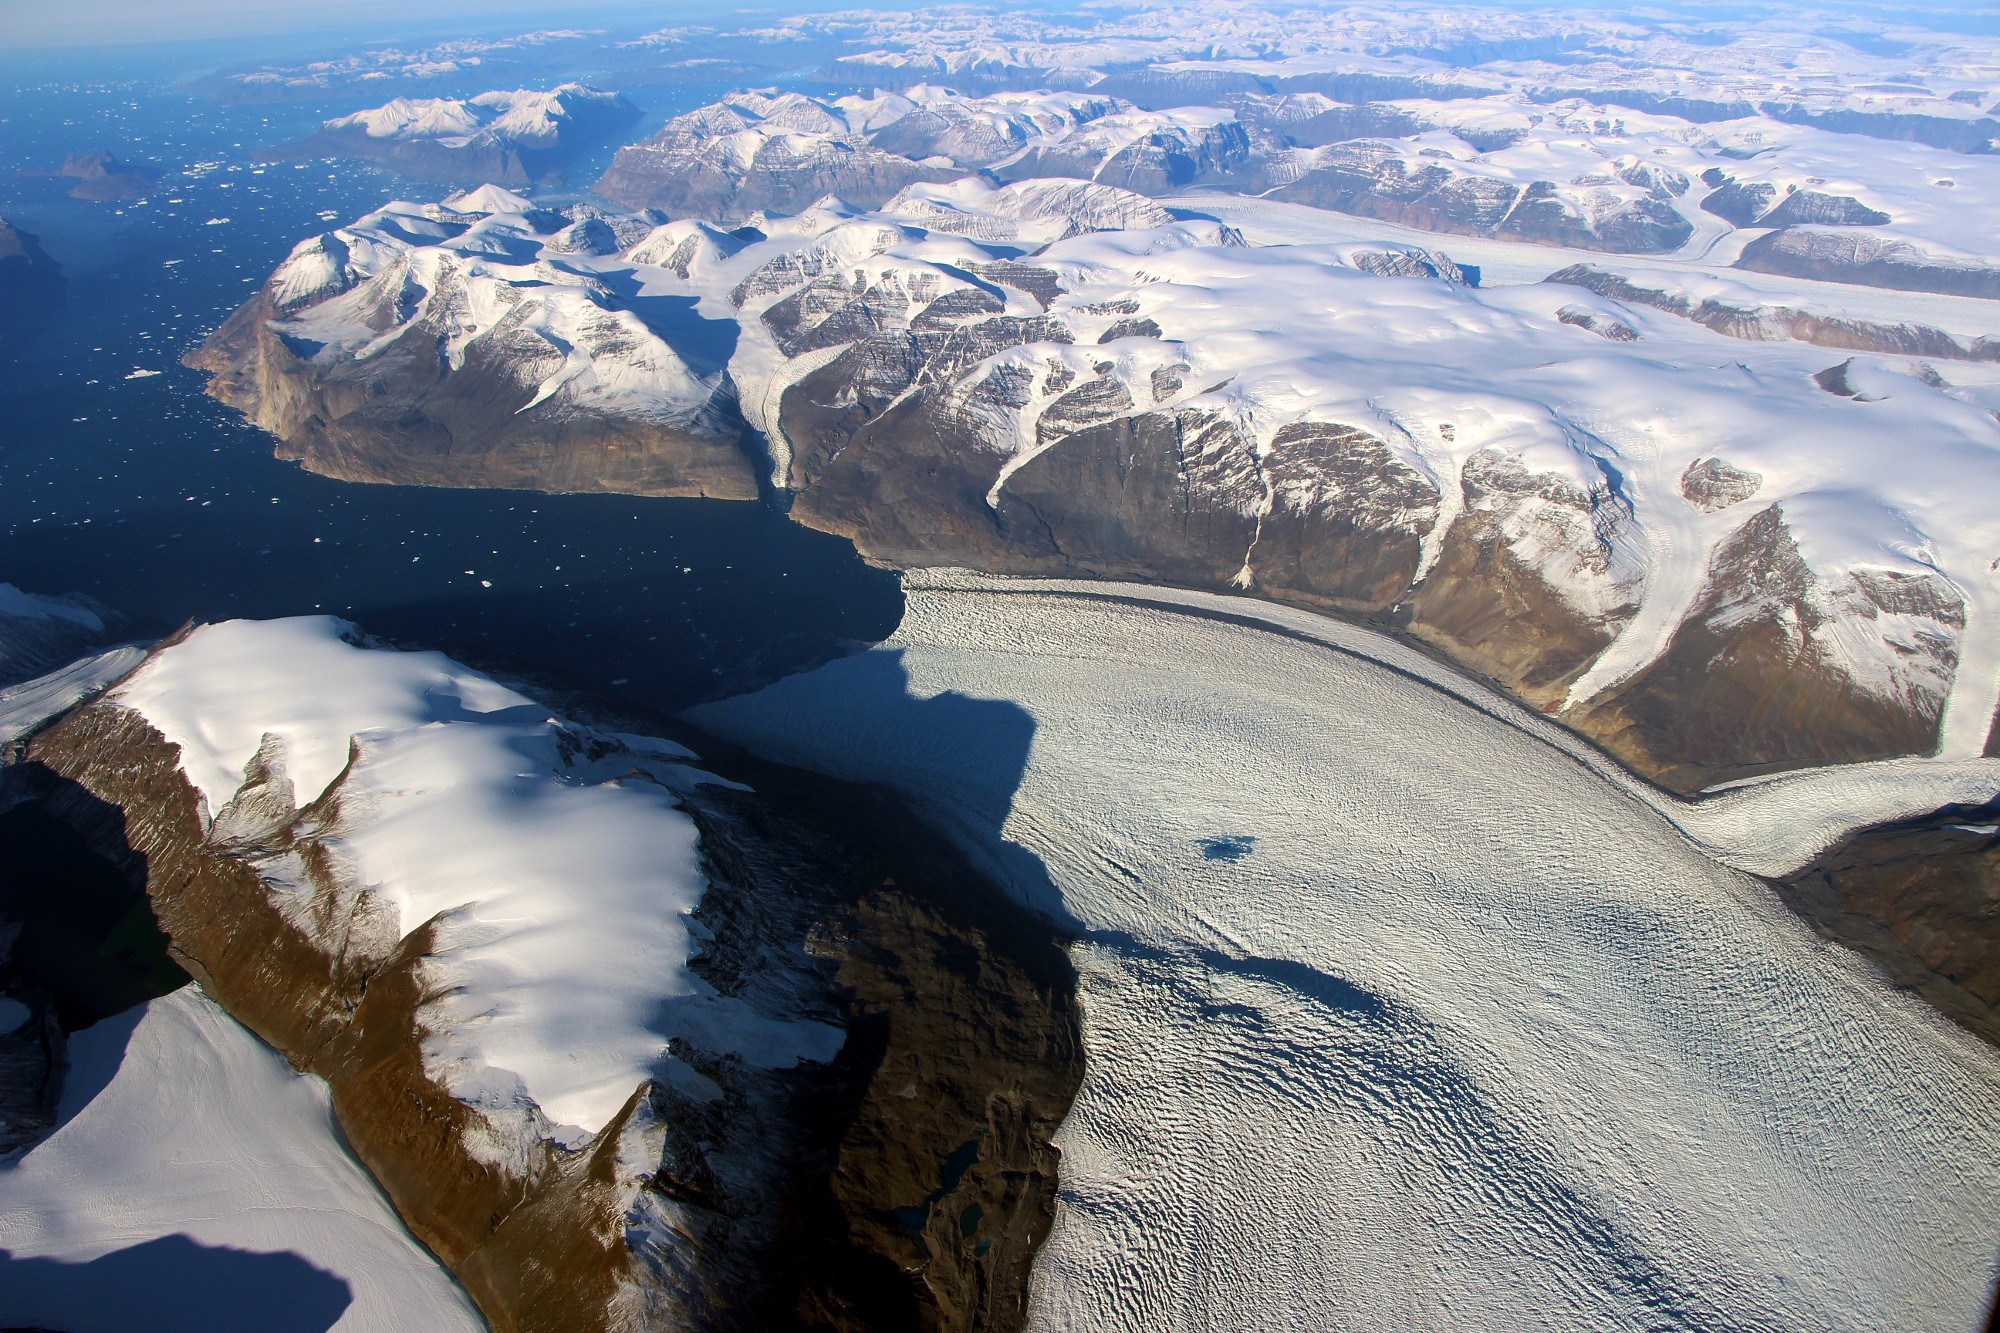
“The mass of the Greenland ice sheet has rapidly declined in the last several years due to surface melting and iceberg calving. Research based on observations from the Gravity Recovery and Climate Experiment (GRACE) satellites (2002-2017) and GRACE Follow-On (since 2018) indicates that between 2002 and 2021, Greenland shed approximately 280 gigatons of ice per year, causing global sea level to rise by 0.03 inches (0.8 millimeters) per year.”
How much water is this exactly? According to a rough estimate published by the U.S. Geological Survey, the world’s store of fresh water — all the glaciers, ice sheets, lakes, rivers, and groundwater combined — is about 40 million cubic kilometers by volume. About three fifths of this, or 24.7 cubic kms, is locked up in the 30-million-year-old Antarctic ice sheets. Ground water adds 12 million cubic kms. Greenland’s ice sheet — about 2.7 million years old and averaging a mile in height — holds about 2.9 million cubic kms. By volume and height, this makes the ice sheet something like the Mediterranean Sea suspended a few feet above the Arctic Ocean. Alternatively, Greenland holds about 15 times as much fresh water as the 0.2 million cubic kms of liquid in all the picturesque and historic lakes, rivers, and mountain glaciers of the Americas, Asia, Africa, Australia, Europe, and smaller islands combined.
How much, then, is 280 gigatons of ice? By one comparison, converted into liquid this would be about half the 530 gigatons of water flowing down the Mississippi River each year. By another, given that by arithmetic the Greenland ice sheet weighs about 2.9 quadrillion tons, losing 280 billion tons means that about 0.01% of it, or one ten-thousandth, is melting off each year. This is likely to accelerate: A recent survey published by the National Academy of Sciences estimates that expected warming through 2100 is likely to melt enough of it to raise sea levels by one meter, implying loss of about an eighth of the ice sheet or twice the above-ground fresh water outside Antarctica. Melting all of it would raise sea levels by about 24 feet, and require about 1000 years under current climate-change trajectory.* So, Congress’ action this week is perhaps not very timely, but it is also not too late.
* The presumably less likely case of an Antarctic ice-sheet melt would raise the seas by 190 feet.
Danish research program EastGrip is a 30-person team investigating the behavior of the ice sheet through radar, drilling for ice cores to a depth of 2500 meters (1.5 miles), and surface observations to understand past climate effects on ice sheets, chemical content at various levels, melting and internal ice flows, etc.
Proceedings of the National Academy of Sciences on likely future melting trends.
The National Snow and Ice Data Center’s “Greenland Ice Sheet Today” bulletin shows surface melting at “moderate” levels compared to 2020 and 2021, principally along the western/southern coastal strip with some on the far northern coast.
… and also from the NSIDC, a look at adaptation in southern Greenland polar bear populations.
And the U.S. Geological Survey counts the world’s fresh water.
Policy:
The Senate Democratic Caucus summarizes the Inflation Reduction Act’s energy and climate change provisions.
The White House’s Office of Science & Technology Policy announces Arctic policies.
And more about Greenland:
The world’s largest island and undisputed fresh-water superpower is roughly one-fifth the size of the United States, and 80% covered by ice. About 56,000 people — 6,000 Danes, 50,000 Inuit — live on the actually “green” bits. Administered by Denmark since 1721, in constitutional terms Greenland is a politically autonomous kingdom under the Danish monarchy, with a right in theory to declare independence. The odd interlude in which the Trump administration suddenly proposed to “buy” it four years ago rested on a complex set of concerns about access to potentially large mineral lodes (Greenland is thought to be home to an array of rare-earth metals useful in clean-energy manufacturing but potentially damaging to mine, as well as messy to mine; also gold, silver, zinc, tantalum, etc.) along with concerns about Arctic sea lanes and intelligence surveillance. For now, Greenland’s main industry is about $1 billion in cold-water fisheries for snow crab, cold-water shrimp, turbot, halibut, and other northern catch.
The Greenland government’s page, evidently only in Greenlandic (an Inuit language) and Danish.
Ed Gresser is Vice President and Director for Trade and Global Markets at PPI.
Ed returns to PPI after working for the think tank from 2001-2011. He most recently served as the Assistant U.S. Trade Representative for Trade Policy and Economics at the Office of the United States Trade Representative (USTR). In this position, he led USTR’s economic research unit from 2015-2021, and chaired the 21-agency Trade Policy Staff Committee.
Ed began his career on Capitol Hill before serving USTR as Policy Advisor to USTR Charlene Barshefsky from 1998 to 2001. He then led PPI’s Trade and Global Markets Project from 2001 to 2011. After PPI, he co-founded and directed the independent think tank Progressive Economy until rejoining USTR in 2015. In 2013, the Washington International Trade Association presented him with its Lighthouse Award, awarded annually to an individual or group for significant contributions to trade policy.
Ed is the author of Freedom from Want: American Liberalism and the Global Economy (2007). He has published in a variety of journals and newspapers, and his research has been cited by leading academics and international organizations including the WTO, World Bank, and International Monetary Fund. He is a graduate of Stanford University and holds a Master’s Degree in International Affairs from Columbia Universities and a certificate from the Averell Harriman Institute for Advanced Study of the Soviet Union.
Digital privacy laws are not ready for a post-Roe v. Wade future. New bills circulating on the Hill are an important step toward safeguarding Americans’ personal data, but they are not a panacea to protect women seeking an abortion or the friends and family members who might be supporting them, or even just know of their intentions.
It’s no secret that today, personal and health data about human preferences, location, characteristics and behavior are collected through phones, apps, websites, advertisements, internet sites and service providers; if a device is connected to the internet, it probably collects user data. These data are used to provide helpful information and services, but as the United States lacks universal digital privacy protections, firms are solely responsible for data privacy and security.
At the same time, law enforcement has wide latitude to purchase and request personal data from companies. They can obtain a court order about a particular crime and companies are obliged to provide information related to the crime, some companies have made special portals to more easily provide data. Even without a court order, law enforcement can purchase bulk data from data brokers about suspected crimes or general surveillance. These data can contain location information, internet searches queries, among other personal information. Companies can push back but with a court order or subpoena are obliged to comply with law enforcement.
Surveillance of this nature has historically enjoyed wide support as protection against terrorism and other societal harms. But the combination of prolific personal data collection and law enforcement surveillance are predicated on the assurance that data about everyday interactions and behaviors are not under scrutiny by law enforcement. The overturning of Roe v. Wade calls this trust into question.
The past two years have caused unprecedented economic disruption. The pandemic resulted in the displacement of workers and changed the way we work forever, in addition to creating new jobs through technological advancement.
These transformations have had serious workforce implications — changing the skills workers need to be relevant, leaving employers with unfilled positions, and altering the makeup of regional economies. Yet for some time, there was little action from federal policymakers to address these challenges. While many states, local governments, community colleges, workforce boards, and other eligible entities used their flexible stimulus funding to prioritize workforce-related efforts, federal policymakers continued to ignore the importance of investment in workforce development to help displaced workers pursue in-demand employment and help current workers navigate the new world of work.
Finally, the focus shifted with the passing of the American Rescue Plan Act (ARPA). As part of the bill, $3 billion was allocated to the Department of Commerce’s Economic Development Administration (EDA), providing funding to support community-led economic development efforts. EDA funding included the Good Jobs Challenge, a $500 million grant program to support workforce partnerships that provide education and training opportunities and comprehensive supports to jobseekers and workers while connecting employers with the talent they need to remain competitive.
Last week, the EDA announced the 32 awardees of the Good Jobs Challenge, representing diverse geographical regions across the country. The projects focus on 15 industries that grantees want to grow and support, including agriculture and food production, energy and resilience, health care, manufacturing, and information technology.
While this is an exciting investment, the money designated to this program pales in comparison to other COVID recovery efforts focused on colleges and college-bound students. Through higher education emergency relief efforts across two administrations and two sessions of Congress, about $77 billion was distributed to aid the nation’s higher education institutions. While this money was critical to support the basic needs of students, it also demonstrates the disparity between college and non-college opportunity in this nation.
The Good Jobs Challenge is a much-needed investment that finally gets money out the door to support the unique workforce needs of communities and options outside of traditional college. It also offers a new model of public investment that is flexible, encourages a comprehensive approach to skill development, and puts employers at the center of the equation.
None of this work can be done effectively without employers. The Good Jobs Challenge aims to bring industry together with training providers, community-based organizations, and other key stakeholders to build demand-driven pathways to good jobs. The project plans to do this through public-private partnerships, leveraging public investment to incentivize employers to participate in regional workforce efforts in a robust way. Awarded projects already have employer commitment to support curriculum development, co-delivery of training, mentorship, match investments, earn and learn opportunities, and hiring commitments. Projects also prioritize sector strategies, ensuring there is a collective approach to these workforce efforts within each industry. This helps small and midsize employers participate who often don’t have the resources or capacity to offer these opportunities on their own, but are vital to regional economies, especially in small towns and rural areas.
This grant program not only better supports employers, but also looks out for working Americans. For years, working Americans — specifically those without a college degree — have faced downward mobility. This trend has only worsened, requiring increased attention from federal policymakers. The Good Jobs Challenge is a step in the right direction. Awardees are not only developing critical talent development and career support strategies for these individuals, but they are also offering comprehensive wraparound services, prioritizing services like child care, transportation, language support, mentoring and career counseling. These are critical policies to ensure working Americans get the skills and support needed for economic advancement.
The Good Jobs announcement comes at a good time. With states and communities implementing the Investing in Infrastructure and Jobs Act (IIJA) and our nation still dealing with severe labor shortages across critical industries, communities need a plan to help Americans re-enter the workforce and advance in their careers. PPI is pleased to see a federal grant program that integrates industry throughout every step of the process while also supporting the holistic needs of jobseekers and workers. We are also happy to see a more flexible and modern approach to financing workforce development efforts, prioritizing public-private partnerships and innovative strategies that serve the unique economic needs of American communities
PPI looks forward to seeing what the Good Jobs grantees accomplish. We hope to see more equitable funding for workforce-related pathways in the future and to see federal policy replicate this pragmatic approach to public investment.
Ben Ritz, Director of the Center for Funding America’s Future at the Progressive Policy Institute (PPI) released the following statement:
“The Progressive Policy Institute applauds Senate Democrats for passing the Inflation Reduction Act of 2022. This historic bill will help combat the climate crisis and promote American energy security with the largest investment in clean energy ever. The health care provisions will reduce costs for millions of families. New resources to help the IRS crack down on tax cheats will reverse the defunding of our tax police and ensure all Americans pay their fair share. And the bill would not only cover the cost of these policies, it would also reduce deficits by more than a quarter trillion dollars over the coming decade, which will help bring inflation under control.
“As is the case for most bills, the Inflation Reduction Act is not perfect. Its deficit reduction depends on a flawed plan to outsource tax policy to the Financial Accounting Standards Board, a private organization that solely exists to serve the information needs of investors rather than determine an economically efficient tax base. Other, better revenue-raisers were dropped, leaving the bill’s modest savings unable to offset the deficit increases created by legislation Congress passed just last month. And we’re sorry that many other progressive priorities we advocated for throughout the reconciliation process, such as closing the Medicaid coverage gap, could not be included.
“But the final bill is still far better than the mishmash of half-baked social programs and irresponsible budget gimmicks that many on the left were pushing earlier in the reconciliation process. PPI is proud of the role our Reconciling with Reality framework and analysis of various proposals played in shaping this historic legislation. We thank Senator Manchin, Leader Schumer, Speaker Pelosi, President Biden, and all the other lawmakers whose leadership contributed to this great outcome.
“The Inflation Reduction Act, together with the Bipartisan Infrastructure Law and the CHIPS and Science Act, represents the largest increase in public investment since the Johnson administration – it is a historic accomplishment for Democratic leaders in Washington. Now we urge them to finish the job by passing the permitting reform legislation they’ve promised to cut red tape, maximize taxpayers’ bang for their buck, and get these critical investments built in a timely manner. We also hope that additional legislation and executive orders they pursue later this year will build upon rather than squander the Inflation Reduction Act’s hard-earned deficit reduction.”
The Progressive Policy Institute (PPI) is a catalyst for policy innovation and political reform based in Washington, D.C. Its mission is to create radically pragmatic ideas for moving America beyond ideological and partisan deadlock. Learn more about PPI by visiting progressivepolicy.org.
FACT: Over 100 million people worldwide have been forcibly displaced from their homes.
THE NUMBERS: UNHCR’s annual counts of refugees, internally displaced people, asylum seekers, and others forced from their homes – 2022 103 million
2021 89 million
2020 82 million
2016 65 million
2012 42 million
WHAT THEY MEAN:
From Matthew 2:13, the “Flight to Egypt” story:
“An angel of the Lord appeared to Joseph in a dream and said, “Rise, take the child and his mother, and flee to Egypt, and remain there till I tell you; for Herod is about to search for the child, to destroy him.” And he rose and took the child and his mother by night, and departed to Egypt, and remained there until the death of Herod.”
In modern legal terms, the family would be “refugees”, under the relevant 1951 U.N. Convention: people who have crossed a national border “owing to a well-founded fear of being persecuted for reasons of race, religion, nationality, membership of a particular social group or political opinion,” and cannot safely return home. The passage does not recount the family’s reception in Egypt, then a Roman province, though the implication is that they found a place to live and a temporary livelihood. An announcement from the University of Maryland’s Rosham Center for Persian Studies (a 15-year-old center for Persian language and cultural study) provides a modern parallel, combining government support and policy with non-profit charities and individual volunteerism:
“Afghan refugees are currently the largest refugee population in the D.C.-Maryland-Virginia area served by the International Rescue Committee. While making the difficult adjustment to life in a new country they frequently struggle with a variety of problems, including social isolation/integration into the community, developing English language skills, and learning about local community resources and American culture. UMD students chosen to participate in the ARA Program as ARA interns help our new Afghan neighbors during their transition into their new life in America while themselves benefiting from the opportunity to learn more about Afghan Persian culture and the Dari dialect of Persian spoken in Afghanistan. ARA interns also receive training in refugee care from the IRC and additional training in Afghan culture and Dari (Persian) from Roshan-UMD faculty.”
Background: The U.N. High Commission on Refugees (UNHCR) keeps an annual count of refugees, along with “internally displaced” people (i.e., those forced to leave home for similar reasons but who have not crossed an international border), and several other categories* of people forced from homes by violence or threat of persecution. The steadily rising tallies over the last decade, and the acceleration of their growth in the last five years, are a human index of deteriorating world peace and security:
In 2012, UNHCR counted 41.8 million ‘forcibly displaced’ people, including 10.5 million refugees, 26.4 million internally displaced people, 10.5 million cross-border refugees, and 5.8 million in other classifications.
By the end of 2016, this count had risen to 65 million, including 17 million refugees, 40 million internally displaced people, and 8 million other.
Five years later, at the end of 2021, the count was at 89 million, pushed up by a series of state breakdowns and civil wars: overthrows of elected governments in Afghanistan and Burma, Russian military intervention in Syria, civil wars in Ethiopia and Yemen, economic collapse in Venezuela. UNHCR’s end-2021 “Global Trends” report finds that children made up 40% of this total, or 36.5 million boys and girls.
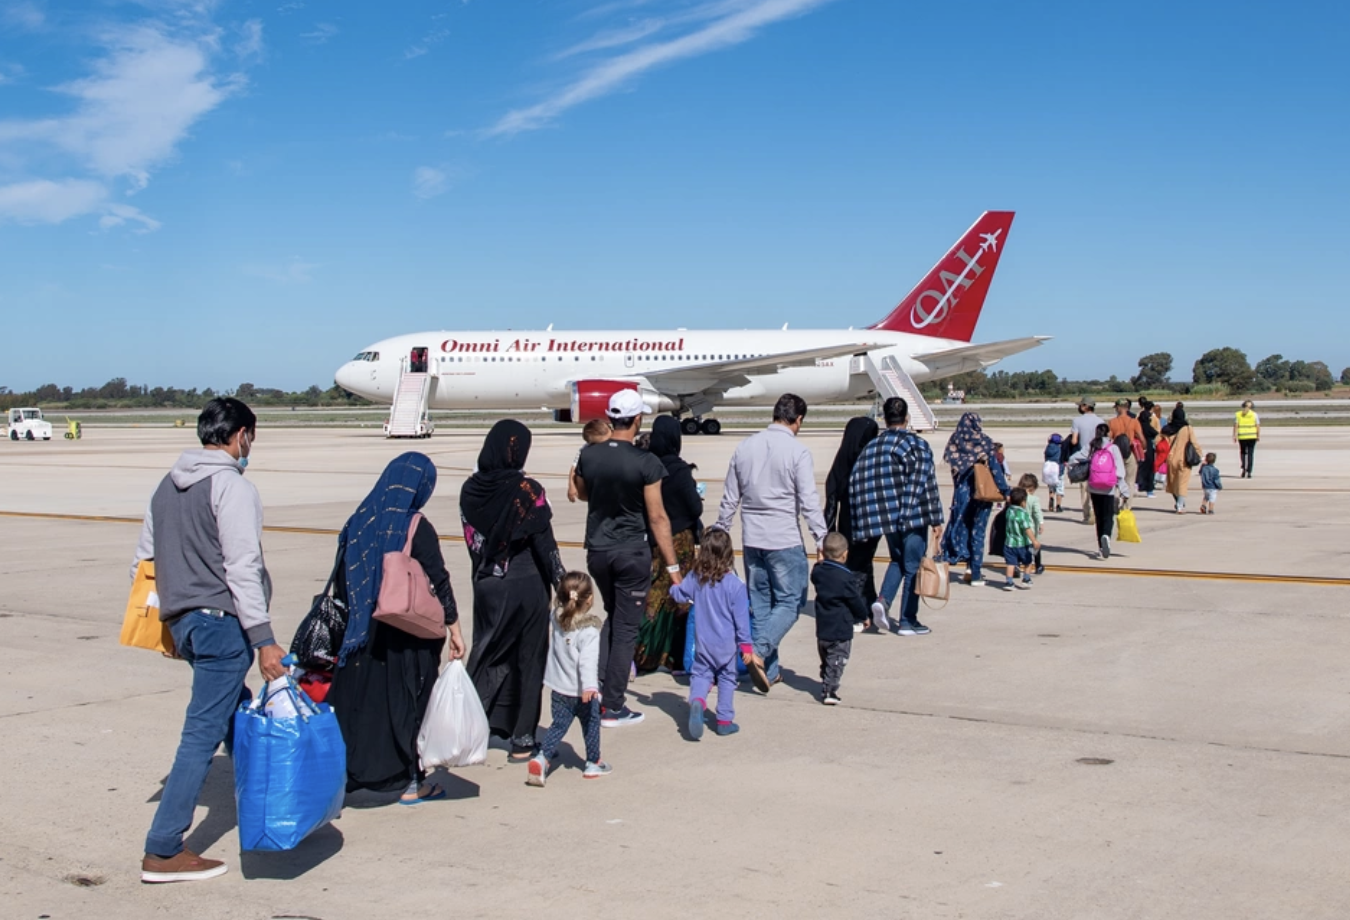
By mid-2022, the Russian invasion of Ukraine had raised the total above 100 million for the first time, with 4.6 million Ukrainians now refugees and another 6.5 million internally displaced, along with an additional 367,000 in Myanmar and 270,000 in Burkina Faso.
Parallel to this is a second story of tenuous hope for shelter and resettlement. Six countries now host nearly half the world’s refugees: Turkey with 3.8 million, Colombia with 1.8 million, Pakistan and Uganda with 1.5 million each, Germany and Poland with 1.3 million each. In the United States, roughly three million Americans (including two currently serving Members of Congress) came to the U.S. as refugees, and are now permanent residents or citizens. From the turn of the century to 2016, the State Department was admitting 27,000-85,000 refugees per year for resettlement, which was roughly 3% to 8% of net immigration, depending on the year. The Trump administration cut admissions to 11,411 in FY2021, the lowest level since passage of the 1980 U.S. law defining refugee eligibility. The count has rebounded a bit since, with 15,100 arriving from the beginning of the Fiscal Year in September 2021 through June 2022, including the Afghans now acclimatizing at the University. In parallel with this, the Justice Department runs a “Temporary Protected Status” program, with stays of deportation and work authorization (though not citizenship) for about 400,000 nationals of 15 countries.
* Other classifications in UNHCR’s count of forcibly displaced people include Palestinians in the U.N. Relief and Works Administration’s jurisdiction, asylum seekers, and Venezuelans displaced abroad.
FUTURE READINGS:
Flight
UNHCR reports over 100 million people forcibly displaced from homes worldwide.
… also notes 20-year trends, main source countries, countries with the largest incoming populations, and more.
The Justice Department’s Temporary Protected Status data.
The State Department’s refugee resettlement program site.
… and State Dept data on refugee resettlement from FY2000 through FY2022 (through June). The largest arriving groups for the first nine months of FY2022: 3,735 from Congo (DROC), 3,525 from Syria, 1,308 from Sudan, 1,129 from Burma, 1,028 from Ukraine, and 846 from Afghanistan.
D.C.’s African refugee community runs a family support and job center for newly arrived Ethiopian, Eritrean, Syrian and others.
ABOUT ED
Ed Gresser is Vice President and Director for Trade and Global Markets at PPI.
Ed returns to PPI after working for the think tank from 2001-2011. He most recently served as the Assistant U.S. Trade Representative for Trade Policy and Economics at the Office of the United States Trade Representative (USTR). In this position, he led USTR’s economic research unit from 2015-2021, and chaired the 21-agency Trade Policy Staff Committee.
Ed began his career on Capitol Hill before serving USTR as Policy Advisor to USTR Charlene Barshefsky from 1998 to 2001. He then led PPI’s Trade and Global Markets Project from 2001 to 2011. After PPI, he co-founded and directed the independent think tank Progressive Economy until rejoining USTR in 2015. In 2013, the Washington International Trade Association presented him with its Lighthouse Award, awarded annually to an individual or group for significant contributions to trade policy.
Ed is the author of Freedom from Want: American Liberalism and the Global Economy (2007). He has published in a variety of journals and newspapers, and his research has been cited by leading academics and international organizations including the WTO, World Bank, and International Monetary Fund. He is a graduate of Stanford University and holds a Master’s Degree in International Affairs from Columbia Universities and a certificate from the Averell Harriman Institute for Advanced Study of the Soviet Union.
Indisputably inspiring, the National Aeronautics and Space Administration (NASA) released its first photos from the James Webb Telescope this month. These breathtaking images proved the telescope’s successes in clarity and range over the former purveyor of these galaxies, the 1990 Hubble Telescope, and demonstrated our growing awareness of the universe. Yet some still doubt the allocation of federal funds for this exploration, not grasping that federally-funded space exploration promotes innovation, intergovernmental collaboration, and a stronger STEM workforce.
The Webb Launch shows the American people what international collaboration can look like. A joint effort with the European Space Agency (ESA), the launch upholds the Biden administration’s commitment to peaceful international relations in space. Launches require intergovernmental and private sector collaboration through various federal agencies, state and private universities, and contracts with businesses or nonprofit organizations.
Those with concerns regarding costs claim privately-funded missions as solutions. These concerns neglect the fact that NASA receives less than 1% of the federal budget, and as astrophysicist Neil DeGrasse Tyson argues, private companies may avoid more risky projects that won’t prove valuable to investors. The House Subcommittee on Space understands the importance of public investment in exploration and hopes to advance NASA’s economic efficiency in the next decade through increased resources for synchronized manned missions, robotics, and research and development operations. Taking on risks, promoting competition in the private sector, and inspiring patriotism necessitate public financial commitment to space travel.
In a time of uncertainty, the Webb launch and imaging exhibit positive impacts of federal funding and cooperation. Further funding for space exploration and improving its efficiency inspires trust in government as it continues to foster innovation, collaboration, and STEM education.
Asian countries consume nearly half of the world’s energy and 70% of the world’s coal. China burns more coal than all other countries combined and plans to build an additional 80 new coal plants in coming years. The United States Energy Information Administration (EIA) projects that heavy coal use will continue in many parts of Asia throughout 2050 even in a “low demand” scenario.1 Asia’s dependence on coal works at cross purposes with the global consensus to limit warming to under 2 degrees Celsius as set forth in the Paris climate agreement, as well as pledges by major Asian countries to cut their carbon emissions.
For example, China has pledged to achieve carbon neutrality before 2060.2 India set a similar net-zero emissions goal by 2070.3 Since Asia emits well over half of the world’s annual greenhouse gas emissions, any realistic strategy to bend down the global emissions curve relies on reducing Asian emissions deeply over time.4 The construction of new coal plants — which typically operate for 40 years or more — raises serious doubts about the climate commitments of leading Asian nations. China’s annual greenhouse gas emissions alone are now more than 30% of the global total, greater than all developed nations combined. Asia’s large and growing countries must transition to a cleaner fuel base to stand a chance at meeting their climate targets while sustaining economic growth. In addition, Asia’s reliance on coal also undermines efforts to reduce local air pollution, which led to over 30 million premature deaths in China alone between 2010 and 2016.5 How can Asia reduce its coal use while also ensuring continued prosperity and sustainability across the continent? Substituting cleaner-burning natural gas for coal offers one key strategy to cut emissions deeply, but only if Asian countries recognize that natural gas is not created equally from a climate change perspective.
For example, Russia and the United States both increasingly export natural gas to Asia. However, studies show that the United States produces natural gas that has far lower lifecycle greenhouse gas emissions than Russian gas. That’s due to America’s greater performance on all three dimensions of effective methane control: (1) measurement, (2) validation, and (3) policies.
In fact, this paper will show that:
Due to its very high fugitive emissions of methane, Russian gas delivered through pipelines to China emits slightly higher lifecycle greenhouse gas emissions than Chinese coal itself based on this best available data. Thus, any pretense by China that using Russian gas reduces overall greenhouse gas emissions is false.
This fact undermines the climate change rationale of the recently announced new, second major natural gas pipeline project from Russia to China. Increased Chinese imports of Russian gas will only subvert Asian and global climate protection goals.
In contrast, due to lower lifecycle emissions of methane, U.S. liquefied natural gas delivered to China has on average 30% lower lifecycle greenhouse gas emissions than does Chinese coal.
On this basis, we argue that Asia should not only increase its use of natural gas to displace coal, but do so particularly by purchasing liquified natural gas (LNG) imports from the United States and other lower methane emitting sources, rather than sourcing natural gas from Russia.6 We find that lower methane emissions gas systems give the United States a significant competitive advantage versus other sources of gas as Asian countries shift from coal to gas to cut their carbon emissions.
But these U.S. advantages will only continue if the federal government and domestic energy companies work together to lower methane emissions from its production, transportation, and exportation of natural gas. We urge the Biden administration to set an explicit national goal to work toward making America the cleanest natural gas producer in the world. Not only would that boost U.S. LNG exports, it would also pressure other exporting countries to reduce their methane and lifecycle emissions if they want to be remain competitive.
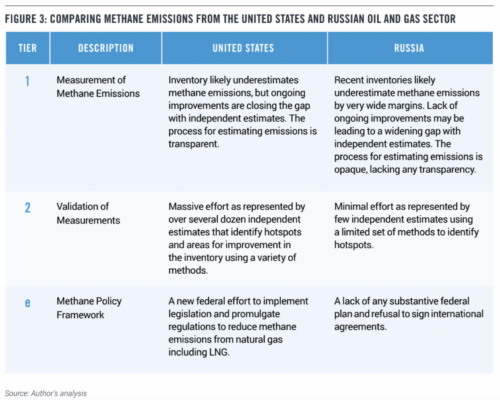
This paper offers a three-tier framework for a comprehensive comparison of methane emissions by Russia and the United States. We explore how each country measures its methane emissions, the extent and effectiveness of third-party validation of emissions estimates, and the role that policy frameworks play in creating incentives for cleaning up gas production.
We note that Russia’s obsession with secrecy makes a comprehensive comparison of methane emissions between the United States and Russia difficult. The bottom line is that Russia’s insistent lack of transparency compared to the U.S. means Russian emissions are likely far higher even than the existing estimates used in the paper. We also note that from an economic and national security perspective, the U.S. has an opportunity to partner with key Asian nations in providing cleaner natural gas while reducing the influence of petro-states like Russia. This is imperative is an especially crucial given Russia’s invasion of Ukraine and other expansionist policies. However, this is not the main focus of this paper.
All these factors suggest that it is strongly in the U.S. and global climate protection interest for America to continue to expand its LNG exports into Asia, while making sure U.S. regulations drive down methane emissions to work toward being the world’s cleanest producer of natural gas. This report will offer a series of specific recommendations for how to accomplish these goals.
INTRODUCTION
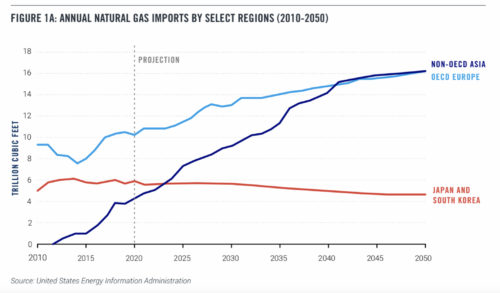
Natural gas consumption in Asia has risen steadily in recent years, a trend expected to increase more dramatically to meet Asia’s projected increase in energy consumption over the next thirty years, as displayed in Table 1a and 1b. Economic growth in the region, particularly in China and India, is expected to drive demand for a wide range of energy sources, including natural gas. In addition, calls for cleaner sources of energy has motivated commitments by governments in the region to begin shifting away from coal and towards natural gas and renewable energy.
This vision was directly reflected in China’s 2016- 2020 “energy revolution” plan, which featured growth in natural gas as part of its “three-pillar approach” to sustainable energy. Specifically, the plan included increasing the share of natural gas in primary energy consumption to 10% by 2020 and 15% by 2030 and in urban dwellings to 50-55% by 2020 and 70% by 2030.7 8Natural gas continues to feature prominently in China’s 14th Five-Year Plan, spanning years 2021 through 2025,9 and will continue to do so in light of China’s carbon neutrality by 2060 pledge.10 India is following a similar trajectory, with a recent announcement committing to net-zero carbon emissions by 2070.11 In line with this new ambitious policy direction, India has set out to increase the share of natural gas in the country’s energy mix from just over 6% at present to 15% by just 2030.12
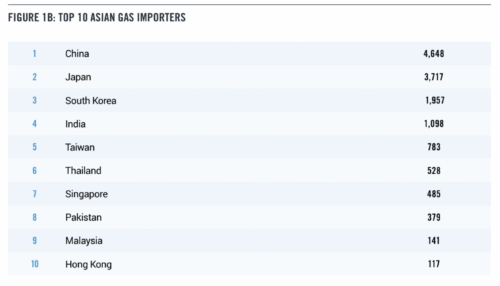
Due to limited domestic supply of natural gas in Asia, natural gas imports are also projected to increase steeply, roughly quadrupling from 4.1 trillion cubic feet (Tcf) in 2020 to 16.1 Tcf in 2050.13 China and India are projected to receive roughly half of these dramatically increased imports.14 Liquified natural gas (LNG) imports specifically are similarly projected to increase over this time period, representing as much as 72.5% of the total demand for natural gas in the Asia-Pacific region by 2050.15 This is especially the case for India, which has experienced a decline in domestic natural gas production. Indeed, India has been the fourth largest importer of LNG since 2011 and continues to rely on these imports, which represented 50% of the country’s natural gas supply in 2019.16
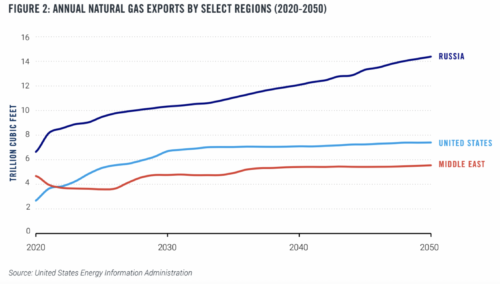
Three of the world’s largest natural gas producing regions (the United States, Russia, and Middle Eastern exporters) are expected to increase natural gas production to meet growing demands in Asia, as displayed in Figure 2. However, at least prior to its invasion of Ukraine, Russian production of natural gas (which may reach 14 Tcf by 2050) has been expected to significantly outpace exportation from other regions, positioning Russia to become the largest net exporter of natural gas through 2050.17 And while these estimates were made prior to the EU’s announced embargo on Russian gas, and are likely therefore to be too high, the EU is still importing gas from Russia, as are other nations.
Crucially, Russia has already taken steps to secure its natural gas foothold in China even as its market in Europe is now threatened by its invasion of Ukraine. The Power of Siberia-1 pipeline, which began operating in 2019, is Russia’s first natural gas pipeline to China. The $400 billion contract, the largest contract in the history of Russia’s natural gas company Gazprom, calls for Russia to supply China with 38 billion cubic meters of natural gas annually for 30 years. The impact for China is also significant, with the amount of natural gas supplied enabling China to displace coal in China’s northwest region over that period.18 Russia’s President Vladimir Putin and China’s President Xi recently held a high profile event during the Beijing Winter Olympics at which they announced an additional agreement calling for another Russian gas pipeline to China, known as the Power of Siberia-2 pipeline, which is expected to have an export capacity of 50 Bcm per year19 and is scheduled to commence operations in 2030. At the February 2022 event in Beijing, Russia and China announced another 30- year contract to supply 10 billion cubic meters of natural gas to China through this new pipeline.20
Russia has also begun making a natural gas footprint in India. Although India currently only accounts for 0.2% of Russia’s natural gas exports,21 India recently entered into a 20-year contract with Russia to supply it with 2.5 million tons of LNG.22 Both countries have expressed commitments to deepening their ties and boosting LNG activity.23
As with Russia, net exports of natural gas from the United States are expected to spike through 2050. The United States just recently, in late 2021, became the world’s largest LNG exporter. Asia has been the largest destination for U.S. LNG exports since 2020, with South Korea, China, and Japan being the largest buyers in both 2020 and 2021, although the recent pledge by President Biden to supply more U.S. LNG to Europe to displace Russian gas suggests that both Europe and Asia will be receiving greater U.S. LNG shipments in coming years.
While Japan has been the largest LNG importer in the world for the past 50 years, China is poised to surpass Japan to facilitate its transition away from coal.24 The year 2021 marked this transition, as Japanese LNG imports fell 4 million tons short that of China. The U.S. recently surpassed Qatar and Malaysia as the second largest source of LNG imports to China, after Australia. The United States further cemented its relationship with this import partner in the third quarter of 2021, when China signed four long-term LNG contracts with leading U.S. LNG producers following a Chinese government directive to secure LNG at any price.25, 26
While India has historically received most of its LNG from Qatar due its geographic proximity, India is still one of the primary destinations of U.S. LNG, ranking seventh in 2019. New commercial contracts with U.S. LNG companies will continue to sustain this relationship.
COMPARING NATURAL GAS FROM THE UNITED STATES AND RUSSIA
Russia’s invasion of Ukraine jolted the European Union out of its complacency surrounding energy imports, exposing how the EU addiction to Russian gas has been funding Putin’s malign regime at ever greater levels, in the hundreds of billions of dollars annually, even since Russia’s 2015 annexation of Crimea. Apart from the wide-ranging geopolitical costs of the EU reliance on Russian oil and gas, the invasion of Ukraine is also suddenly forcing the EU to recognize the huge additional methane emissions of Russian gas, contributing to the EU determination to cut its dependency on Russian natural gas imports.
Asia should follow suit, on both ethical grounds to protest Russia’s unlawful invasions, but also on environmental grounds. Without a dramatic fuel shift from coal to cleaner natural gas, Asian countries have no plausible way to meet their climate commitments.
Natural gas emits about half the carbon dioxide emissions as coal when combusted. However, natural gas producers emit significant amounts of greenhouse gas in the form of methane by venting, inefficient flaring, and fugitive emissions through leaks in wells, transportation in pipelines and equipment.27 These emissions have a disproportionately large impact on the climate because the primary component of natural gas, methane, warms the atmosphere 86 more times per molecule than carbon dioxide emissions over a 20-year timeframe.28 Therefore, high fugitive methane emissions can more than offset the climate gains of switching to natural gas from coal. Studies show that gas is more climate friendly than coal only so long as methane emissions are kept below 2.7% of gas production, although some estimates range to more like 3.5% leakage rates.29, 30
In the context of Asia, natural gas imports with high methane leakage rates result in higher carbon emissions than anticipated, and in some cases, are no better from a climatic perspective than continuing the use of coal. Ultimately, Asia should not purchase any natural gas that does not have low enough methane emissions to provide climatic benefits over coal.
Moreover, Asia should prioritize the lowest verifiable methane emitting option from a lifecycle perspective, over any other natural gas alternative. Without Asia’s leadership in cutting emissions of coal and using lower-emitting natural gas, it will be difficult for the planet to stay on track for a 2 degrees Celsius goal. As this paper will discuss, leakage rates vary considerably based on the geographic location of the natural gas source, including across and within national boundaries. Therefore, comparing the climatic benefits or costs of exports of natural gas from the United States and Russia into Asia requires significant analysis.
This paper addresses the unique opportunity and associated challenges for Asia to substitute coal with low-leakage natural gas, specifically, LNG sourced from the United States. This cleaner natural gas will not only allow Asia to deliver on its policy commitments, but will also reap real and significant benefits for the climate as well as for human health, both of which have been severely threatened by decades of coal use throughout most of Asia. The decisions Asian countries make today to secure their future gas supply have enormous bearing on both their economic and social development and on climate change. Where they source their gas from is crucial to ensure high-quality natural gas imports with low leakage rates for methane emissions.
This paper is organized around a three-tiered framework for assessing the climate impact of natural gas exports from the United States and Russia. Section 3 introduces and discusses this framework at length with a comparison between the United States and Russia. Section 4 offers policy recommendations for Asia and the United States
Measuring methane emissions from the natural gas lifecycle is notoriously difficult. Methane emissions can happen anywhere along the supply chain from initial production to final consumption. In addition, a small minority of leaks often explains the vast majority of any observed emissions, thereby earning the moniker of “super” or “ultra” emitting sources. For these and other reasons, there are wide uncertainties in many estimates of methane emissions, making comparing national emissions inventories alone a necessary yet insufficient step in assessing the climatic impact of different natural gas sources. Countries also put varying degrees of diligence and skill into validating national emissions. Finally, countries adopt very different policies and incentives to encourage the reduction of methane emissions. More specifically, we conceptualize three tiers of comparison as follows:
Government Emissions Inventories: Countries collect and maintain their own national data on emissions, sometimes including methane emissions from the oil and gas sector, but the accuracy of this data varies widely. In addition, countries periodically submit national inventories to the United Nations for assessment under the Framework for Climate Change. This tier ranks the accuracy of the measurements provided by national data or inventories.
Third-Party Validation Efforts: Over the last decade, academics, and nonprofits started inventing new methodologies for measuring methane emissions from the oil and gas sector to test the validity of government data. The overall level of effort put into validating government inventories by these third-parties, the effectiveness of their methods, and the results of their findings are all taken into consideration under this tier.
Methane Policy Mix: Countries adopt widely varying policies for reducing methane emissions from the oil and gas sector. Clearly, while measuring and validating emissions are pertinent for current methane emissions, a country’s policy mix largely determines the level of its future methane emissions. Therefore, this tier accounts for the trajectory of methane emissions. We also report on recent political announcements that shed light on the future direction of each country’s methane emissions trajectory.
Figure 3 summarizes our main results from applying this conceptual framework to LNG exports from the United States and natural gas exports from Russia. While there is ample room for improvement in both countries, the United States clearly offers a strong relative advantage by offering a lower carbon natural gas product in the form of LNG exports. In particular, U.S. measurement of methane emissions is more accurate, the validations of those measurements are more rigorous, and the methane policy framework is more aggressive. We believe these realities confer a substantial competitive advantage on U.S. natural gas.
At the same time, we recognize that geopolitics will sometimes supersede climate protection considerations. But if climate and geopolitical considerations are not given appropriate value, Russia could wind up being the key gas supplier to what some are calling the “axis of autocracy” — countries with rulers who may favor Russia against free and democratic nations. Since Russia’s invasion of Ukraine, this group has clearly included not only China, but in some cases India. But for Asian countries struggling to grow and do their part to slow down the overheating of our planet, the evidence points overwhelmingly to the superiority of cleaner U.S. gas. These nations must be called to account on the negative climate implications of using Russian gas, especially given the increasing availability and price competitiveness of lower emitting LNG alternatives from the U.S.
Finally, recommending imports of cleaner natural gas as baseload power and heating in Asia to displace higher-emitting natural gas sources and coal should be in way no detract from aggressive efforts among Asian nations to expand production of renewable energy, nuclear power, hydrogen and other near-zero emitting sources.
Government Emissions Data
In both the United States and Russia, government emissions inventories have historically likely underestimated methane emissions from the oil and gas sector compared to independent estimates, which the next section discusses in detail. A central, but not the only, reason for this is that these inventories rely on bottom-up measurements, which make assumptions regarding the quantity of equipment used (known as “activity factors”) and their emission rates (known as “default factors”) that are inherently prone to underestimation. Therefore, government emissions inventories should be taken with a grain of salt.
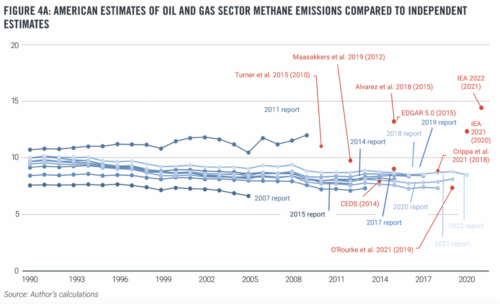
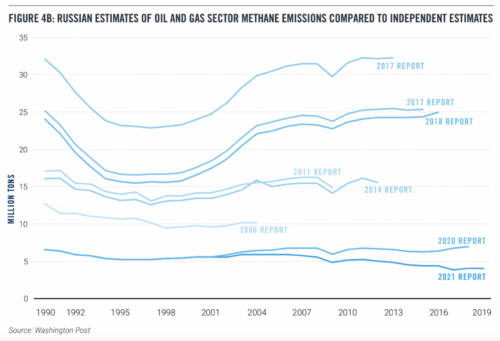
Figure 4 shows government inventories of methane emissions from the oil and gas sector compared to a selection of recent independent estimates (denoted as yellow triangles) as well as how those inventories changed over time (denoted by the dotted lines). On the first dimension, Figure 4 shows (a) that Russia initially overestimated emissions before significantly underestimating them, leading to a widening gap between government inventories and independent estimates. It also shows (b) that the United States likely underestimates emissions but that the gap between government inventories and independent estimates is quickly closing, with several academic studies roughly agreeing with the government inventories. In both cases, the notable exception outlier is IEA (2021) which accounts for ultra-emitters, an analysis that we describe in detail later in this report.
Regarding changes in government inventories over time, a recent investigation by The Washington Post shows that Russia has repeatedly and arbitrarily lowered its estimates for methane emissions from its oil and gas sector. As displayed in Figure 4A, these estimates have dropped by nearly an order of magnitude over the last 15 years with frequent revisions. According to the Post investigation, experts believe that Russia is massively underestimating its methane emissions.31 Similarly, Russia’s own estimates of methane emissions from the oil and gas sector are remarkably low in relative terms. For example, Gazprom reported a methane leakage rate of three-tenths of one percent in 2015, a number widely viewed as unbelievably low by experts,32 while the United States reported a 1.54% methane leakage rate in 2017.33 Taken together, the trend of constant downward revisions and remarkably low leakage rates immediately raises deep suspicion over the quality of Russia’s emissions inventory.
Beyond the estimates from the annual inventories, the process for making estimations is drastically different between the United States and Russia. For example, as displayed in Figure 4B, the United States also lowered its estimate for methane emissions from its oil and gas sector over the last 15 years, although to a much lesser degree than Russia. Importantly, these changes are much more gradual and accompanied by a coherent and public technical explanation in the Environmental Protection Agency’s (EPA) annual greenhouse gas inventory report. As part of this reporting process, the EPA invites and responds to public feedback — including from academics, nonprofits, and businesses — on its methodology and potential updates. On the other hand, to our knowledge, Russia does not have any such a transparent process. As such, there is no plausible explanation for why Russian estimates change so drastically or frequently, except political expediency. In addition, the Post reports that Russia does not impose substantial fines for noncompliance and that third-party audit reports in Russia cannot be trusted.34
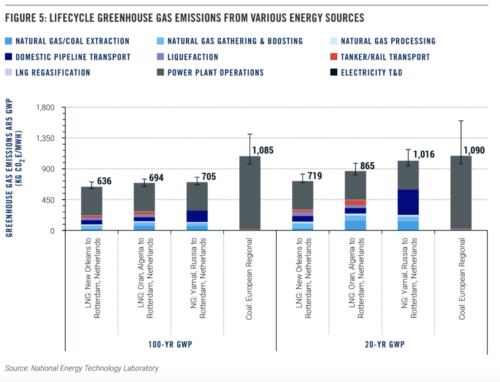
Based on the United States Greenhouse Gas Inventory and Reporting Programs, the National Energy Technology Laboratory conducted a comprehensive study comparing the lifecycle greenhouse gas emissions from different sources of energy. As illustrated in Figure 5, the study finds Russian gas piped to China has up to 5% more greenhouse gas emissions (GHGs) than Chinese coal based on a 20-year global warming potential. In contrast, liquefied natural gas (LNG) shipped to China from the United States has only 72% of the GHGs compared to Chinese coal based on a 20-year global warming potential. From a 100-year global warming potential perspective, Russian gas piped to China has about 11% more GHGs compared to United States LNG shipped to China.35, 36.
A major caveat is that, within each country, there is massive variance in leakage rates. In particular, both the United States and Russia have localized “super” or “ultra” emitting sources, as discussed in detail by a recent academic article published in the journal Science. 37 Within these regions, researchers have observed spikes in methane leakage well in excess of what would make natural gas a reasonable substitute for coal from a climatic perspective. For example, a recent study in the United States estimates that methane emissions leakage rates from the Permian Basin, a major producing region in Texas, were 3.7% of production in 2018 and 2019, suggesting a significant disadvantage from using natural gas from this region over coal.38 Approaches that account for ultra-emitting sources, such as IEA (2021), will therefore tend to yield higher estimates of methane emissions. This speaks to the importance of independent estimates, which we will turn to next.
Third-Party Validation Efforts
Independent actors, including academic and environmental organizations, are another vital source of data about methane emissions from country to country. As described in detail in Appendix 1, we focus primarily on collecting independent estimates across the two countries that are comparable. These approaches primarily rely on either “top-down” satellite-based studies or “bottom-up” emissions factor studies. Particularly in the United States, there are dozens of excluded studies that use airplanes, trucks, sensors, and in-person assessments to provide detailed geographical estimates of methane emissions. These methodologies require a certain level of governmental or corporate permission to study methane emissions and, to our knowledge, this permission tends to be granted in the United States and not granted in Russia. This is one of the reasons why we know so much more about methane emissions in the United States compared to Russia.
In an effort to make reliable comparisons, we have focused only on studies that employ the same methodology to ascertain national-level estimates in the United States and Russia. Our analysis reveals that the average leakage rate reported in Russia is 2.80% (ranging between 1.54 and 4.14%), substantially higher than the 1.74% average rate in the United States, (ranging more narrowly from 1.12 and 2.19%.)
Most recently, the International Energy Agency recently launched a Methane Tracker Database.39 This initiative aims to blend country-level inventories with satellite-based measurements to track methane emissions over time. It also complements the International Methane Observatory (IMO), which is expected to increase the quality of methane estimates overall.40 We calculate a methane leakage rate originating from this database equal to 2.19% for the United States and 3.02% for Russia in 2020, making Russia’s methane emissions nearly 40% higher than those from the United States. Again, the uncertainties around Russia’s methane emissions are much greater, since there are many more independent estimates conducted in the United States.
Previous academic efforts to estimate country-level methane emissions from oil and gas reflect similar trends. An article published in Atmospheric Chemistry and Physics estimates methane leakage rates of 2.11% in the United States and 2.49% in Russia for 2012.41 Another academic article published in 2017 by the journal Environmental Research Letters estimates methane leakage rates of 1.57% in the United States and 3.42% in Russia for 2012. We were unable to find any third-party country-level estimate that estimates the United States emitting at a higher methane leakage rate than Russia.42
There is also a distinction between the overall effort put in by third-parties, such as academics and nonprofits, in validating government emissions inventories. In the United States, these researchers have produced well over several dozen major studies estimating methane leakage ratios at different geographies and scopes spanning the last decade. Importantly, there is a diverse array of methods including airplane, drone, sensor, and satellite data.
In contrast, there is far less activity in Russia, with only a handful of academic studies independently estimating methane emissions. Those typically find that inventories are underestimated. For example, a 2021 article published in the journal Atmospheric Environment employs satellite imagery to estimate methane emissions from one particular region in Russia that are much higher than official figures. The authors identify widespread flaring, even though this activity was supposed to be illegal, and argue that more satellite imagery is required to validate Russia’s underestimated national data.43 Taken together, not only are third-party validation efforts more commonplace in the United States, but those validation efforts that allow for comparisons with Russia show lower comparative methane leakage rates for the United States. This means that validation efforts are stronger in the United States when compared to Russia. Of course, both countries should improve further on facilitating validation efforts, since there are large gaps between estimates from government inventories and independent estimates at local and national scales in both countries.
Methane Control Policies
We are not aware of any significant policies in Russia to incentivize reductions in methane emissions. Moreover, while President Putin has called for cuts to methane emissions, Russia has not signed onto any of the recent international efforts to reduce methane emissions including, for example, the Global Methane Pledge launched by the United States and the European Union.44 For these reasons, we are unable to credit Russia with any effective policy for mitigating methane emissions.
In contrast, the United States has recently furthered its effort to reduce methane emissions from the oil and gas sector as part of its Methane Emissions Reduction Plan.45 Importantly, the United States Environmental Protection Agency is updating rules for new and existing oil and gas sources, which it estimates will reduce methane emissions by approximately 75% from covered sources. These sources will include those previously unregulated including oil wells with associated gas.
Bipartisan infrastructure legislation that President Biden signed into law also contains $16 billion in new funding to cap old or existing wells and mines that leak methane. In addition, the Bureau of Land Management will further reduce venting, flaring, and leaks on public lands and waters. This is notable because one of the main hotspots for methane emissions in the United States, the Permian Basin in New Mexico, would be subject to these regulations.
Finally, the Department of Transportation’s Pipeline and Hazardous Materials Safety Administration (PHMSA) is implementing the bipartisan PIPES Act, passed in December 2020, with the potential to reduce 20 million metric tons of carbon dioxide emissions per year by reducing or eliminating leaks or ruptures of oil and gas pipelines. Interestingly, PHMSA is proposing a rule this year to strengthen standards for LNG facilities, particularly from large scale incidents and storage tanks.
Policy Recommendations – Key Actions by Major Stakeholders
1. Asian governments should phase down and then halt the importation of Russian gas based on climate change, humanitarian, and geopolitical grounds.
2. Asian nations should also suspend and cancel the construction of natural gas pipelines from Russia since they increase lifecycle greenhouse gas emissions and are therefore inconsistent with climate goals.
3. In particular, China should cancel a proposed new gas pipeline from Russia (the so-called “Power of Siberia 2”) given its high lifecycle emissions.
4. Asian nations should construct LNG infrastructure to facilitate imports from countries with lower methane emissions, including the United States.
5. Asian countries that have carbon prices (including China, Japan, and South Korea) should, in time, consider adding a greenhouse gas import tax that regulates natural gas imports based on their lifecycle methane emissions. Carbon prices can and should be redesigned to give priority to low leakage natural gas.
6. Major greenhouse gas emitting Asian countries, especially China and India, who have not already done so should join the U.S., EU, and over 100 countries in the Global Methane Pledge to cut methane emissions from all national sources by 30% by 2030. It is notable that Russia has not joined this Pledge.
7. U.S. lawmakers and regulators (at the federal and state levels) should continue improving management of methane emissions — including measurement, validation, and policy frameworks — to work toward achieving the lowest leakage rates of any gas-producing and gas-exporting country in the world. U.S. regulators should specifically improve measurements of methane emissions by incorporating new methods, including satellites and other airborne measurements. A strong national inventory will bolster the effectiveness of any policy aimed at reducing methane emissions. U.S. regulators should pay special attention to ultra-emitters among oil and gas producers, including small producers and those in the Permian Basin.
While more aggressive regulation is necessary, the U.S. government should also use incentives and fees to challenge domestic oil and gas producers to a “race to the top” when it comes to controlling methane emissions. Several U.S. LNG exporting companies have taken measures in this direction, including “tagging” or disclosing the full lifecycle emissions of its LNG export cargoes in 2023, and new efforts to capture and store carbon at one of its U.S. export terminals.
In order to make greater amounts of natural gas available for export both Europe and Asia and to improve global climate outcomes and geopolitics while limiting domestic price, the United States must also expand the production of additional clean energy sources including renewable energy, nuclear power, geothermal and related technologies including electricity storage, carbon capture and storage, direct air capture and other advanced energy. As the Progressive Policy Institute noted in its previous reports from 2020 and 2021 on the role of natural gas in cutting domestic greenhouse emissions and those in Europe, the U.S. should enact $325 billion pending legislation to dramatically expand clean energy tax incentives this year, as well as invest in increase domestic production of gas, including expanding gas pipelines as needed.
Both gas exporting and importing governments should challenge oil and gas companies to show steady progress in reducing their methane emissions, including by encouraging companies to consider bundling their LNG shipments with carbon offsets that would enable exporters to achieve lower carbon status over the long-run, while ensuring offsets are high-quality. In time, importing nations are likely to reward these efforts with greater demand for low-emissions gas delivery.
International climate oversight bodies (including U.N. Framework Convention on Climate Change and International Panel of Climate Change) should strongly encourage all nations to provide accurate data on actual methane emissions from all sources, including oil and gas production. These organizations and IEA should also continue deploying methodologies capable of improving estimates of methane emissions in all countries, and particularly emphasize remote measurements in countries, such as Russia, that do not have robust independent estimates or transparent public processes for estimating inventories. Parties to the Paris Agreement are required to submit nationally determined contributions (NDCs), and the UNFCCC Secretariat should require each Party’s national climate plans to include plans to cut methane emissions from oil and natural gas, whether through production, exports and/or imports.
Independent third-party entities, such as nongovernmental organizations, should continue to conduct research into Russian methane emissions to fill the data gap that inhibits a thorough understanding of the magnitude of the emissions.
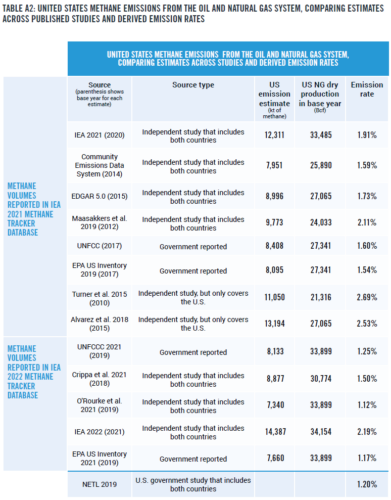
Appendix: Estimates of Russia and Untied States Oil and Gas System Methane Emissions from Existing Studies/Inventories and Derived Emissions Rates
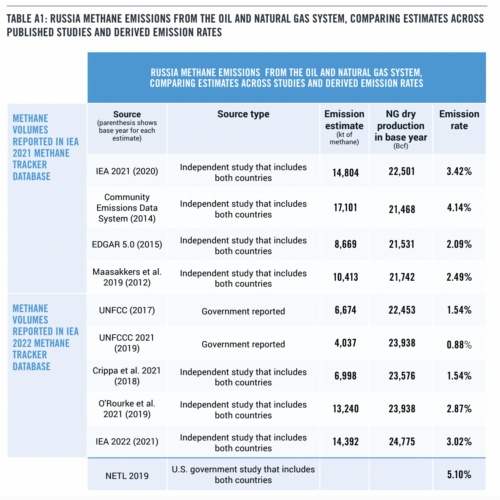
Reported volumes of estimated methane emissions across sources come from the International Energy Agency (IEA) 2021 Methane Tracker Database and the IEA 2022 Methane Tracker Database that compiled estimates across published studies and inventories.46,47 The authors retrieved the data compiled by the IEA 2021 database in February 2022 and the data from additional studies reported by the IEA 2022 database in April 2022. IEA 2021 interactive figures reported what year the reported emissions covered and both IEA 2021 and 2022 databases report volume breakdowns by the segments of the oil and gas systems that were included in each study (e.g., upstream oil, upstream gas, downstream gas). As such, all estimated methane emission volumes included in our tables are the reported numbers for national totals across the entire oil and gas systems.
To calculate a derived percent of the country’s natural gas production lost as methane emissions based on the findings from each study, the authors divide the IEA 2021 and IEA 2022 compiled methane emission volumes by the total dry natural gas production volumes for the respective countries and base years reported by U.S. Energy Information Administration (EIA) datasets. Production data for both Russia and the U.S. comes from EIA’s International data set for all years of interest except for one. The U.S. volume for 2021 comes from EIA’s dry production data series.48 Before dividing, we convert the reported kt of methane for each source to billion cubic feet (assuming 1 kiloton of methane equals 0.051921 billion cubic feet of methane).
For example, Maasakkers et al 2019 estimate that in 2012 Russia emitted 10,413 kt (or 541 Bcf) of methane from across the country’s oil and gas system.49 EIA reports that in 2012 Russia produced 21,742 Bcf of dry natural gas. The authors then calculate the emission rate by dividing the total methane from Russia’s oil and gas systems in 2012 as estimated by Maasakkers et al 2019 by the Russian dry natural gas volume reported by EIA for 2012 (541/21,742= 2.49%).
NETL 2019 calculate the cradle through delivery emission rate of Russia natural gas via pipeline to Shanghai as 5.1% and of U.S. LNG to Shanghai, assuming gas comes from Appalachia, as 1.2% (see exhibit 6-8).50 This study may underestimate LNG methane emissions because NETL 2019 assumes Appalachian upstream methane emissions for its U.S. LNG calculation that may be lower than the upstream methane emissions for other major natural gas regions in the United States.
Paul Bledsoe is a strategic adviser for PPI, working on intersection of U.S. and global energy, climate, and economic policy. He is also a Professorial Lecturer at American University’s Center for Environmental Policy. Paul served as communications director of the White House Climate Change Task Force under President Clinton, as special assistant to U.S. Interior Secretary Bruce Babbitt, and communications director of the U.S. Senate Committee on Finance under former Chairman Daniel Patrick Moynihan.
He was formerly senior policy advisor to the Presidential Commission on the BP Oil Spill, director of strategy for the National Commission on Energy Policy, and a teaching fellow at Oxford University’s School of Geography and the Environment. Paul has been a leading figure in shaping two major climate agreements — the Paris Climate Agreement of 2015 and the Kigali Agreement to phase out HFCs of 2016. He writes often on climate and energy in the New York Times, Washington Post, Financial Times, Politico, USA Today, LA Times, The Hill and other leading publications. Paul received a B.A. with honors and a M.A from Ohio State University.
Clayton Munnings is a widely published environmental economist with over three dozen scholar articles and policy papers focused on carbon pricing and methane emission policies. He holds an A.S. from Monroe Community College, a B.S. from Cornell University, and an M.S. from UC Berkeley. He is completing his PhD at UC Berkeley with a focus on novel methods to create and identify high-quality carbon offsets.
Clayton currently serves as Strategic Advisor to the International Emissions Trading Association, Expert to Perspective GmbH’s International Initiative for Development of Article 6 Methodology Tools, and Board Member at Eartshot Now. He operates a consulting firm that provides advice to countries, corporations, and startups abating greenhouse gas emissions through carbon pricing, climate finance, and carbon offsets.
He has written climate laws for top-emitting countries, built carbon offset quality assurance frameworks for large companies, and designed investment strategies for novel approaches to climate finance. Previously, Clayton held roles as Researcher and Portfolio Manager at Kepos Capital LP, Economist in the Executive Office of the California Air Resources Board, Senior Research Associate at Resources for the Future, Short Term Consultant at the World Bank, and Youth Delegate to the UNFCCC for SustainUS.
REFERENCES
1. “International Energy Outlook,” United States Energy Information Administration, October 2021, https://www.eia.gov/outlooks/ieo/.
5. Fengchao Liang et al., “The 17-y Spatiotemporal Trend of PM 2.5 and Its Mortality Burden in China,” Proceedings of the National Academy of Sciences 117, no. 41 (2020): pp. 25601-25608, https://doi.org/10.1073/pnas.1919641117.
28. Intergovernmental Panel on Climate Change, “Anthropogenic and Natural Radiative Forcing,” In Climate Change 2013 – The Physical Science Basis: Working Group I Contribution to the Fifth Assessment Report of the Intergovernmental Panel on Climate Change, 659–740. Cambridge: Cambridge University Press, 2014. doi:10.1017/CBO9781107415324.018.
29. Ramón A. Alvarez et al., “Greater Focus Needed on Methane Leakage from Natural Gas Infrastructure,” Proceedings of the National Academy of Sciences 109, no. 17 (April 2012): pp. 6435-6440, https://doi.org/10.1073/pnas.1202407109.
37. T. Lauvaux et al., “Global Assessment of Oil and Gas Methane Ultra-Emitters,” Science 375, no. 6580 (April 2022): pp. 557-561, https://doi.org/10.1126/science.abj4351.
38. Yuzhong Zhang et al., “Quantifying Methane Emissions from the Largest Oil-Producing Basin in the United States from Space,” Science Advances 6, no. 17 (2020), https://doi.org/10.1126/sciadv.aaz5120.
41. Joannes D. Maasakkers et al., “Global Distribution of Methane Emissions, Emission Trends, and OH Concentrations and Trends Inferred from an Inversion of GOSAT Satellite Data for 2010–2015,” Atmospheric Chemistry and Physics 19, no. 11 (2019): pp. 7859-7881, https://doi.org/10.5194/acp-19-7859-2019.
42. Lena Höglund-Isaksson, “Bottom-up Simulations of Methane and Ethane Emissions from Global Oil and Gas Systems 1980 to 2012,” Environmental Research Letters 12, no. 2 (2017): p. 024007, https://doi.org/10.1088/1748-9326/aa583e.
43. Iolanda Ialongo et al., “Satellite-Based Estimates of Nitrogen Oxide and Methane Emissions from Gas Flaring and Oil Production Activities in Sakha Republic, Russia,” Atmospheric Environment: X 11 (2021): p. 100114, https://doi.org/10.1016/j.aeaoa.2021.100114.
A new report authored by the Progressive Policy Institute’s Paul Bledsoe and environmental economist Clayton Munnings finds that China and other Asian nations are rapidly moving toward natural gas to displace coal — but their efforts will not yield significant climate benefits if they don’t cut imports of high-methane leaking Russian gas. The report, which is the second in a series of papers on natural gas, is entitled “The Role of Natural Gas in Reducing Asia’s Greenhouse Gas Emissions.”
PPI argues Asian countries can reduce coal by substituting cleaner-burning liquefied natural gas (LNG), but must acknowledge that Russian gas piped to China emits higher emissions than Chinese coal. Thus, any pretense by China that using Russian gas reduces its overall emissions is false. This warning comes as Russian President Putin and Chinese President Xi announced a new proposal for a gas pipeline from Russia to China, called the “Power of Siberia 2.”
United States LNG delivered to China has, on average, 30% lower lifecycle greenhouse gas emissions than Chinese coal. The report authors argue that Asia should purchase LNG imports from the U.S. and other lower methane emitting sources, rather than sourcing dirty natural gas from Russia. Current purchases of oil and gas by China, India and other Asian countries are a major source of revenue for the Kremlin’s war on Ukraine.
“Not only are China and India funding Putin’s war machine by purchasing natural gas from the Kremlin,they are also increasing climate emissions, since Russian gas has higher lifecycle greenhouse gas emissions than coal due to massive Russian leaks of methane,” said Paul Bledsoe, Strategic Adviser for the Progressive Policy Institute. “It’s time the global climate community held China, India and other buyers of Russian gas accountable for the huge geopolitical and climate costs of their continuing purchase of Putin’s gas.”
“Asian countries importing gas should purchase liquified natural gas from the United States rather than piped natural gas from Russia based on comparative greenhouse gas emissions alone. This superior climate performance of liquified natural gas will increase if the United States continues to focus on measuring, verifying, and reducing methane emissions,” said Clayton Munnings.
Select key policy recommendations from the report include:
1. Asian governments should phase down and then halt the importation of Russian gas based on climate change, humanitarian, and geopolitical grounds.
2. Asian nations should also suspend and cancel the construction of natural gas pipelines from Russia since they increase lifecycle greenhouse gas emissions and are therefore inconsistent with climate goals.
3. In particular, China should cancel a proposed new gas pipeline from Russia (the so-called “Power of Siberia 2”) given its high lifecycle emissions.
4. Asian nations should construct LNG infrastructure to facilitate imports from countries with lower methane emissions, including the United States.
5. Asian countries that have carbon prices (including China, Japan, and South Korea) should, in time, consider adding a greenhouse gas import tax that regulates natural gas imports based on their lifecycle methane emissions. Carbon prices can and should be redesigned to give priority to low leakage natural gas.
6. Major greenhouse gas emitting Asian countries, especially China and India, who have not already done so should join the U.S., EU, and over 100 countries in the Global Methane Pledge to cut methane emissions from all national sources by 30% by 2030. It is notable that Russia has not joined this Pledge.
7. U.S. lawmakers and regulators (at the federal and state levels) should continue improving management of methane emissions — including measurement, validation, and policy frameworks — to work toward achieving the lowest leakage rates of any gas-producing and gas-exporting country in the world. U.S. regulators should specifically improve measurements of methane emissions by incorporating new methods, including satellites and other airborne measurements. A strong national inventory will bolster the effectiveness of any policy aimed at reducing methane emissions. U.S. regulators should pay special attention to ultra-emitters among oil and gas producers, including small producers and those in the Permian Basin.
Mr. Bledsoe’s first report, published prior to the Russian invasion of Ukraine in December 2021, focused on the European Union’s huge reliance on high-methane emitting Russian gas, which undermines the EU’s climate goals and provides the Kremlin a financial and political upper hand against the EU and its allies. Read the first report here.
Paul Bledsoe is a strategic adviser at the Progressive Policy Institute and a professorial lecturer at American University’s Center for Environmental Policy. He served on the White House Climate Change Task Force under President Clinton, at the U.S. Department of the Interior, as a staff member at the Senate Finance Committee and for several members of the U.S. House of Representatives. Read his full biography here.
Clayton Munnings is a widely published environmental economist with over three dozen scholar articles and policy papers focused on carbon pricing and methane emission policies. He currently serves as Strategic Advisor to the International Emissions Trading Association, Expert to Perspective GmbH’s International Initiative for Development of Article 6 Methodology Tools, and Board Member at Eartshot Now. He operates a consulting firm that provides advice to countries, corporations, and startups abating greenhouse gas emissions through carbon pricing, climate finance, and carbon offsets.
The Progressive Policy Institute (PPI) is a catalyst for policy innovation and political reform based in Washington, D.C., with offices in Brussels and Berlin. Its mission is to create radically pragmatic ideas for moving America beyond ideological and partisan deadlock. Learn more about PPI by visiting progressivepolicy.org.
Friedrich Nietzsche’s famous quote that “what doesn’t kill you only makes you stronger” is only true, at least in politics, if you learn from your mistakes. And last year was a teachable moment for Democrats.
Democratic leaders missed huge opportunities on election reform (including the all-important Electoral Count Act), climate change, police reform, the right kind of immigration reform and much else, all because their eyes were too big, packages were too ambitious and most of all because they refused to say “no” to the extremist purity tests of the party’s hard left. Build Back Better was sacrificed on that altar.
Success requires tapering untested grandiosities and selling commonsense ideas to the 70% or so of the public that reject the extremes of the hard right and the hard left.
Six months after invading Ukraine, not much has gone right for Russian strongman Vladimir Putin. But it’s dangerous for despots to admit defeat, so he’s doubling down on death and destruction in hopes of salvaging something he can call a win.
Having failed to topple Ukraine’s government or overwhelm its highly motivated defense forces on the ground, Putin is settling into a grinding war of attrition, featuring World War II-style leveling of cities and terror attacks on civilians.
His aim is to seize more land along Ukraine’s eastern and southern borders that adjoins territories already contested by pro-Russian separatists following Putin’s 2014 incursion. U.S. officials expect Moscow to declare its intent to “annex” the conquered terrain, just as it did with Crimea.
In this way, Putin would have something to show Russians for the horrendous butcher’s bill he’s running up. CIA director Bill Burns last week estimated that 15,000 Russian soldiers have been killed so far and as many as 45,000 have been wounded.
Since Ukraine is fiercely resisting its piecemeal dismemberment and occupation by Russia, the fighting could continue indefinitely. Putin shows no interest in negotiating an end to the war, either because he still believes he can break Ukraine, or, more likely, because he thinks a military stalemate works in his favor.
This calculation rests on unflattering assessments of the West’s strategic stamina. As long as the NATO countries keep supplying Kiev with weapons and financial support and enforcing suffocating sanctions on Russia’s economy, Ukraine probably can hold out against its bigger and heavily armed neighbor.
Dr. Michael Mandel, Vice President and Chief Economist and Taylor Maag, Director of Workforce Development at the Progressive Policy Institute (PPI) released the following statement on the passage of the Chips and Science Act:
“PPI applauds the Biden administration and Congress for the bipartisan passage of the Chips and Science Act. This historic legislation will bolster domestic semiconductor manufacturing and provide targeted support in science and technology innovation to strengthen our global competitiveness. This bill will be essential as the U.S. moves into a future with less dependence on Chinese chip production.
“Chips not only impacts America’s self sufficiency and national security but it also impacts the American workforce. This policy will create jobs in key industries, support American supply chains and grow America’s highly skilled science, technology, engineering and mathematics (STEM) workforce. PPI supports federal policymakers’ commitment to creating education and training opportunities while diversifying STEM talent pipelines.
“PPI congratulates President Biden and Congress for working across the aisle and securing a win for American manufacturing.”
Dr. Michael Mandel is Vice President and Chief Economist at the Progressive Policy Institute in Washington DC and senior fellow at the Mack Institute for Innovation Management at the Wharton School (UPenn).
Taylor Maag is the Director of Workforce Development Policy at PPI. Taylor focuses on developing policy solutions that strengthen our nation’s workforce, ensuring employers have the talent they need to remain competitive and people have the skills and critical supports necessary to succeed in today and tomorrow’s economy.
The Progressive Policy Institute (PPI) is a catalyst for policy innovation and political reform based in Washington, D.C. Its mission is to create radically pragmatic ideas for moving America beyond ideological and partisan deadlock. Learn more about PPI by visiting progressivepolicy.org.
The Progressive Policy Institute (PPI) released the following statement on the Inflation Reduction Act of 2022:
“PPI applauds Senator Joe Manchin and Majority Leader Chuck Schumer for returning to the negotiating table and agreeing on a historic reconciliation bill that would invest in clean energy, lower the cost of health care, and modestly reduce federal budget deficits. This bill advances precisely the kind of pro-growth, innovative climate policy that PPI has been calling for throughout the process and that America needs. It will not only spur new investments, create jobs, reduce emissions, and critically lower the cost of living for millions of Americans, but also strengthen our country’s economic future for generations to come.
“This deal is a major step forward for Congressional Democrats and the American people, and while it does not include as many legislative priorities as the original framework, PPI is encouraged to see a few well-funded programs that will result in transformational change rather than a broad progressive wish list. We are also encouraged that the deal includes a plan for taking up additional legislation to reform federal permitting processes later this year, which has long been a PPI priority.
“This package isn’t perfect. It doesn’t close the Medicaid coverage gap, or permanently fix the ACA subsidy cliff. More deficit reduction would have strengthened the legislation’s inflation-fighting potential. But the perfect cannot be the enemy of the good, especially when Democrats have an ideologically diverse caucus with no votes to spare in the Senate. Democrats should take the win now and continue to work on making further progress in these areas next Congress.
“Together with the CHIPS and Science Act and the bipartisan infrastructure law, the Inflation Reduction Act of 2022 will cement President Biden’s legacy of the largest increase in domestic public investment in modern history. Democrats in both chambers should act quickly and decisively to advance these bills and secure a stronger future for all Americans.”
The Progressive Policy Institute (PPI) is a catalyst for policy innovation and political reform based in Washington, D.C. Its mission is to create radically pragmatic ideas for moving America beyond ideological and partisan deadlock. Learn more about PPI by visiting progressivepolicy.org.