Photo identification is necessary for modern life. However, more than 21 million Americans do not possess valid ID, and those without home addresses cannot register for state driver’s licenses. Without that physical license, a person can’t get a job, receive aid or health care, vote, or represent themselves in court. Luckily, IDs aren’t the only way to prove identity. Those born in the US have official paper trails through birth certificates and social security cards. To lose these documents and to obtain new copies require paying a fee or appearing in court. How can legislators ensure documents are accessible and protected? The City of Austin Innovation Office’s LifeFiles initiative offers a unique and scalable approach to inclusive documents.
LifeFiles distinguishes itself from global digital ID programs in its decentralized administration and accessibility. In its initial prototype funded by Bloomberg, LifeFiles sought to help people experiencing homelessness gain autonomy over identity documents by creating an official, digital repository of documents like birth certificates. Using a web application, the program was designed for all levels of tech literacy and access: First, by making it accessible from any computer and second, by offering multi-modal sign in methods, password, biometrics, social attestation, or a security question to unlock the documents. Initial testing enabled official free notarization of uploaded documents using blockchain so the digital repository could be used in government settings like applying for a driver’s license or for food and social welfare benefits.
LifeFiles is open source and never collects user data. It uses a combination of blockchain and encryption to secure user documents. Blockchain technology creates an encrypted hash to ensure secure notarization. Then, public-private key infrastructure shares documents, giving an identity verifier the ability to check the blockchain ledger to guarantee authenticity. Decentralized identifier technology (DID) allows these official documents to be accessed via web browser without having a record of identifying information saved in that browser. Technological alternatives to LifeFiles without DID are less secure.
Though piloted as an inclusion tool, digital documents are universally advantageous. User-controlled release of identifying data and encryption make LifeFiles secure and private. The system may also lessen the paperwork burden for individuals and governments through official, centralized, digital storage of essential documents. LifeFiles researchers concluded the program may eventually lower the costs of administering IDs.
The city of Austin’s Chief Innovation Officer, Daniel Culotta, suggests the program could function nationally. Without further grant funding, LifeFiles halted its testing of prototype documents, but the code is still publicly available for replication and scaling. If the government administers the program, onboarding is as simple as volunteer-led document uploading clinics.
This pilot has potential to be adopted by many states and localities. Currently there are 47 states including Washington DC where digital notarization is legal. Eventually, widespread adoption of digitized records will save money, and digital copies of birth certificates at the time of birth will prevent the loss of important records later on, all with users’ autonomy over their identities.
LifeFiles is an open-source response to the difficulties citizens face when they lose important documents. If states fully support this approach, it could aid more than 20 million Americans in controlling their identity and accessing services.
* Estimates from Cisco’s Visual Networking Index, 2017 and earlier reports.
WHAT THEY MEAN:
It is a quarter-century since WTO members approved a “moratorium” on applying tariffs to electronic transmissions, at “MC-2” — the second Ministerial conference — in the spring of 1998. Last June, a quarter-century later, the twelfth Ministerial conference extended this once again, with another decision point at the 13th Ministerial conference likely in late 2023. In the intervening years:
The world’s internet user community has grown from 147 million (of whom 77 million were American) to 5.3 billion or two-thirds of the world’s people in mid-2022.
The digital economy has grown to about 15.5% of global GDP, equivalent to $16 trillion, a figure close to the $18 trillion Chinese and EU economies.
The scale of information flowing across telecom networks, according to estimates in Cisco’s now-slightly-dated Virtual Networking Initiative, rose about 4-million-fold, from 100 terabytes to a likely 396 exabytes per month.
The cost of transferring information has dropped by a likely 99%, as fiber-optics replaced copper submarine cables and low-altitude satellites proliferated.
Debate over the “moratorium” this spring centered on growth, development, and taxation: How does the economic and social value of rising information flows match up against the revenue poor-country governments could take by taxing these information flows (while in doing so slowing their growth). Here is a small human case for the choice WTO members have made so far:
Cambodia’s 800,000 garment workers, mostly young women from rural towns and villages, have been the country’s engine of industrial development over the past generation. At the national minimum wage for garment factories, they earn $194 and up monthly, which is about 50% above Cambodia’s $1,591 per capita income at paycheck time. But they lose some of this, and assume personal risks that workers in middle-income and rich countries don’t, because they are mostly paid in cash and have great difficulty finding safe places to put their money.
Visiting factories around Phnom Penh a decade ago, the Trade Fact series editor noticed that almost all the line workers at sewing machines were wearing silver necklaces, earrings, and bangles. Experts and factory managers explained that this was not a fashion choice, but the best among a poor set of savings options. Since rural Cambodia lacked an effective birth certificate or ID system, workers could not open bank accounts and took wages in cash. To avoid carrying lots of paper money around, or trying to hide it in their (usually shared) apartments, they would visit pawn shops and buy small pieces of jewelry, essentially ‘wearing’ their savings until the holidays. Then they would resell the jewelry at a small loss in order to bring remittance money and presents to their families. In financial-services jargon, this is a negative-interest savings account, but the best choice available since it is physically safer than others.
World Bank researchers now see the falling cost and eased availability of financial information transfer — the ability to move data cheaply and securely, combined with worker’s widespread adoption of smartphones with low-cost monthly data plans — beginning to change this system. For a one-time fee of $5,900, a Cambodian garment factory can contract with a bank or telecom company to replace cash payouts with automatic digital deposit that workers can access through phones and ATMs with unique pins. This in turn will enable a worker to earn interest and develop credit rather than losing part of her wages to pawnshops, and send remittances home digitally rather than carrying a purseful of cash on a bus.
This local case has analogues throughout the low-income world as data flows grow cheaper and reach more countries: financial inclusion for informal-sector workers, telemedicine for rural areas, weather and soil bulletins for farmers, and other support for the poor. More generally, World Bank researchers believe that raising access to mobile digital service by 10% in low-income countries raises per capita income by 2% (and in sub-Saharan Africa by a somewhat higher 2.5%). The WTO members will be arguing these matters as they prepare for “MC-13” sometime late in 2023 or early 2024. Arguments for slowing this growth by taxing it, however attractive to accountants in Finance ministries, need to be weighed against larger-scale potential loss in development and daily life.
FUTURE READINGS:
Digital growth and policy
What does “grow from 100 terabytes per month in 1998 to 396 exabytes in 2022” mean? A “byte” is eight binary digits, enough information to form one letter. Prefixes run as follows: kilo represents 1,000, mega 1 million, giga 1 billion, tera 1 trillion, peta 1 quadrillion, exa 1 quintillion, and zetta 1 sextillion. Yotta comes next, but has not yet been achieved by anything human. Thus, the 396 exabytes thought to be transmitted each month this year are about 4 million times more information than the 100 monthly terabytes of 1998. By analogy, the ratio of digital information flows in 1998 to those of 2022 is about the same as the ratio of the 2 million trees in and around Washington D.C., to the 3 trillion trees thought to be alive and growing on Planet Earth.
The White House electronic commerce report, from the Clinton administration in 1997, argues that “Unnecessary regulation of [Internet-based] commercial activities will distort development of the electronic marketplace by decreasing the supply and raising the cost of products and services for consumers the world over. … Accordingly, governments should refrain from imposing new and unnecessary regulations, bureaucratic procedures, or taxes and tariffs on commercial activities that take place via the Internet..
Ed Gresser is Vice President and Director for Trade and Global Markets at PPI.
Ed returns to PPI after working for the think tank from 2001-2011. He most recently served as the Assistant U.S. Trade Representative for Trade Policy and Economics at the Office of the United States Trade Representative (USTR). In this position, he led USTR’s economic research unit from 2015-2021, and chaired the 21-agency Trade Policy Staff Committee.
Ed began his career on Capitol Hill before serving USTR as Policy Advisor to USTR Charlene Barshefsky from 1998 to 2001. He then led PPI’s Trade and Global Markets Project from 2001 to 2011. After PPI, he co-founded and directed the independent think tank Progressive Economy until rejoining USTR in 2015. In 2013, the Washington International Trade Association presented him with its Lighthouse Award, awarded annually to an individual or group for significant contributions to trade policy.
Ed is the author of Freedom from Want: American Liberalism and the Global Economy (2007). He has published in a variety of journals and newspapers, and his research has been cited by leading academics and international organizations including the WTO, World Bank, and International Monetary Fund. He is a graduate of Stanford University and holds a Master’s Degree in International Affairs from Columbia Universities and a certificate from the Averell Harriman Institute for Advanced Study of the Soviet Union.
Earlier this month, a bipartisan group of representatives and senators released a discussion draft of a federal digital privacy bill: the American Data Privacy and Protection Act. It has now moved out of committee and, if passed, would create new legal rights for all Americans regarding the collection, access, and security of their personal data.
This is not the only consumer privacy bill considered by Congress, and there may be others. As written, this bill would align the United States with other nations, such as the European Union, that have thus far set global standards for digital privacy. Introduced in 2018, the European Union’s digital privacy law filled an important gap in regulating consumer privacy. Four years on, the data revealing how the law interacts with innovation and whether it succeeds in its goal of protecting consumers is still unclear. This should give US lawmakers pause to potentially explore more creative solutions for digital privacy.
The Progressive Policy Institute released a comparative report providing a general framework for analyzing privacy legislation across three separate but interrelated layers: legal access, security, and innovation.
Legal access defines what rights individuals have to see, access, update, and delete their data. Security describes the technical responsibilities for protecting collected data. And the third level, innovation, addresses how the laws interact with economic growth.
How does the new bill fit into these layers?
1. Legal Rights
If passed, the ADPPA would codify a set of data collection and access rights for all Americans who share data with private companies. It’s important to note that ADPPA does not apply to government collection or storing of personal data. As noted in PPI’s report analyzing countries’ privacy legislation, Canada, the European Union, and the United Kingdom put some controls on government use of data, but China did not.
ADPPA requires firms that collect consumer data to gain clear “affirmative express consent.” Consent for data disclosure is firmly rooted in the European Union’s landmark data protection law, the General Data Protection Regulation. It is typically solicited via checkboxes on web pages, and the bill requires clear, plain language description of data collection needs. Specifically highlighted in the bill is the right for consumers to opt-out of targeted advertising and a prohibition of targeted advertising to children.
Once the data is collected, ADPPA states that individuals have the right to access, correct, delete, and transfer data about themselves, with private companies; China and the European Union provide similar access rights to citizens. How to exercise these rights must be clearly stated in easy-to-read privacy policies.
Overall, the bill provides very similar data rights as other countries.
2. Security
Global privacy laws typically address security as a principle and design feature, the U.S. bill follows this trend. Without being overly prescriptive, as digital security is highly technical and evolving, it directs data collectors to implement a risk-based approach depending on the level of sensitivity of the data collected. High-risk data includes biometric or genetic information, passport or social security numbers, and private communications like text messages or email.
In line with other data privacy laws around the world, ADPPA requires large data collectors to appoint a data protection officer and to first conduct a data protection impact assessment, which is a plan for data security and risk.
Additional security and privacy measures recommend data minimization (an essential pillar of the GDPR), or restricting data collection to specific uses and deleting data after use. Data minimization is important because if data is not collected or not stored, it can’t be improperly used or exposed. (they direct not recommend, and i write measures and only add one additional measure. Is this bill simply a copy of the GDPR, does it try to be the same thing in the American context. How it relates to the ADPPA discussion.)
3. Innovation
It’s challenging to predict how a privacy law like ADPPA will impact digital innovation. Crucially, a federal privacy law will provide clear guidance for online companies that serve Americans across multiple states. In the current system, where states are passing digital privacy laws only for their residents, a federal law would ease compliance burdens on firms.
Similar to the GDPR, the bill exempts researchers, journalists, and small data holders except for those who derive 50%of their revenue from data sales. However, it does not clarify whether research conducted by big firms for platform improvements or marketing is exempt. The bill’s right to opt-out of targeted advertising and data transfers, which include data sales, may negatively impact certain industries like advertising and data brokers. Additionally, the bill recommends a study for a universal opt-out portal, which could be an innovation, but also could bankrupt the industries that rely on that data.
These provisions have broad implications for the data economy and should be evaluated carefully. Notably missing from the bill are recommendations for studies of other privacy-preserving technologies or security technologies. To assess the full impacts on innovation it requests an economic impact study five years after the enactment of the Act.
Conclusion
This draft bill is the newest of many privacy bills to be considered by Congress. Many of its provisions mirror the GDPR, as many global privacy laws do, with a major exception that this law does not apply to government data collection.
A key point of consideration for American legislators as they consider this bill is that it replicates many statutes from the GDPR. Enacted in 2018, we still don’t yet know the full impact of regulations like the GDPR on long-term digital innovation or whether its consumer protections are effective, but more information is coming out all the time. A new study from the University of Oxford in 2022 found that small business profits were most affected by the GDPR regulation. A National Bureau of Economic Research study found that the GDPR decreased the number of apps on the Google Play app store and depressed new entrants into the app market. As of the writing of this post, this author found no data detailing the state of data breaches since the introduction of the GDPR.
It’s undoubted that consumers deserve enhanced transparency and protection of their personal data online. If ADPPA passes, it would provide new data collection and protection rights for Americans which is an essential step toward digital privacy. But remember that the United States has a unique and strong innovation culture that is not necessarily well-reflected in the GDPR and other similar global privacy legislation. Those approaches shouldn’t be the only model being considered by lawmakers to enhance digital privacy. Congress has the opportunity to use existing research and data on alternative privacy-protecting technologies and ideas to set new global standards.
The passage of the Infrastructure Investment and Jobs Act (IIJA) in November marked the first large investment in American infrastructure in decades. The $1.2 trillion law includes over $550 billion in sorely needed new spending for areas including broadband, transportation, and sustainability. The Biden administration has prioritized quick implementation, but tools for accountability and efficiency have been lacking. To prevent misuse or wasting of funds, more centralized sources of information about current projects should be available to public entities, private sector investors, and citizens. Actions to increase accountability and efficiency will improve public confidence in the administration and ensure funds are being used for their intended purposes.
So far, around $110 billion in funding has been released and over 4,000 infrastructure projects are underway. Two recent projects include the Airport Terminal Program, which just announced $1 billion for improving terminals in 85 airports nationwide, and the Internet for All initiative, which provides funding for broadband infrastructure. The rapid action taken to implement the IIJA reflects the White House’s awareness of the law’s transformative potential. Mitch Landrieu, White House Senior Advisor and Infrastructure Implementation Coordinator, told CBS, “If we can … learn how to do big things again, which we are confident that we can do, it’s gonna be a wonderful thing to see.”
The Biden administration has demonstrated a desire to improve accountability and efficiency after the rapid dispersal of COVID-19 relief funds resulted in waste and fraud. The Office of Management and Budget (OMB) issued a guidance memorandum to executive branch agencies directing them to work closely with Inspectors General and OMB during IIJA implementation. This collaboration should result in the evaluation of risks in implementation plans to reduce the potential for costly disruptions. In May, the White House released a Permitting Action Plan outlining the administration’s strategy for making sure environmental reviews and permitting processes are effective, efficient, and transparent, illustrating the administration’s determination to accelerate permitting processes to avoid expensive delays.
The White House has also created a Permitting Dashboard to allow the public to keep track of approved projects, adding another level of accountability. Additionally, in May, the administration released the Bipartisan Infrastructure Law Technical Assistance Guide to help communities and entities across the country access and employ infrastructure funding. These actions are good first steps for promoting transparency and efficiency because they show the American people what actions have been taken and provide resources to streamline implementation.
But there is still room for improvement. A main goal of the administration should be to centralize information about how IIJA funding is being spent and what funding opportunities are currently available. This interactive map released by the White House for the six-month anniversary of the law’s passage is useful for cursory examinations of funding outlays, but only provides information about total funding for each state and the percentage of funding spent on each of three main categories: Transportation; Climate, Energy, & Environment; and Other.
This map could be a powerful tool if it contained details about specific programs to assure the public that their taxpayer dollars are being spent wisely. Public accountability is essential and could keep state and local governments on track. For instance, one announced program is the Carbon Reduction Program (CRP), which provides states with funding for projects designed to reduce carbon dioxide emissions from on-road sources. However, this program allows states to transfer up to 50% of CRP funds to another state apportionment from the Department of Transportation, meaning outcomes from the CRP could vary greatly depending on state priorities. Transparency about each state’s use of CRP funding could ensure governments are held accountable for using this money as it was intended.
The Biden administration should also take steps to centralize information about available funding so eligible entities do not miss opportunities. With programs spanning multiple executive branch departments, it is difficult to track every program being announced. One tool, the Grants.gov database, is not operating as efficiently as it could be. When “Infrastructure Investment and Jobs Act” is selected in this database, few funding opportunities come up even though there are many more IIJA-funded projects elsewhere in the database. The federal government is therefore running the risk of communities missing out on much needed funding by categorizing projects incorrectly.
While technical assistance is being made available as stated in the White House guide, it is also important that outreach to stakeholders is increased. For instance, individuals and households often qualify for internet service discounts through the Affordable Connectivity Program (ACP) because they are eligible for SNAP, Medicaid, WIC, Pell Grants, or another assistance program, but there does not appear to have been any ACP information distributed through these programs to participants. Private sector inclusion in project planning and management also needs to be enhanced so the most efficient technologies and construction methods are utilized. Helping communities leverage private sector investment can ensure that even projects that are not part of competitive funding programs meet high standards for future performance.
The IIJA represents a meaningful investment in America’s future, but to reach its full potential, the federal government needs to consolidate information about its implementation. This will allow all stakeholders, from individuals to states, to hold the government and other entities accountable and access opportunities to better their communities.
Monkeypox virus has long been endemic — meaning there is a continuous baseline level of infection — in West and Central Africa. But nine weeks ago, the virus left the continent and began spreading in Europe and now the U.S. There are now at least 13,000 cases across 60 countries and three reported deaths. In the U.S. alone there are almost 2,300 cases and unfortunately, it seems that the public health infrastructure and the Centers for Disease Control and Prevention (CDC) are demonstrating some the same pitfalls of the early days of COVID. Experts say that the window to contain the disease is closing.
The monkeypox virus presents itself with fever, body aches, chills, and fatigue, and if it is a more severe infection, rashes, and lesions. It spreads person-to-person through direct contact with the rash, respiratory droplets, and through touching contaminated clothing or linens. It has a long infectious period of roughly 2-4 weeks. Though the symptoms can resolve themselves, it can be highly uncomfortable and is a greater threat to immunocompromised people, children, and pregnant women. There have been no reported deaths outside of Africa but right on the heels of a multiyear, deadly, global pandemic, how is the U.S. repeating several of the same errors as it did during the early days of COVID?
Too little testing: Until recently, monkeypox testing was limited to a small number of government-run labs that are a part of the CDC’s Laboratory Response Network. This meant that providers were required to complete bureaucratic paperwork to receive permission to order a test. This slowed testing in the initial days of the outbreak. However, in recent days, five commercial labs have begun offering monkeypox testing which should help alleviate testing backlogs. Unfortunately, it may be too late to stop the virus from spreading: the virus is already spreading undetected in many communities as indicated by exceptionally high positivity rates — the rate at which those who are tested are positive. And for many of the confirmed cases, health officials don’t know how the person caught the virus. Those infected haven’t traveled or knowingly been in contact with another infected person.
Not enough vaccines: Unlike the onset of the COVID-19 pandemic, there are two vaccines that are effective (roughly 85% efficacy) at preventing monkeypox. First, there is an older smallpox vaccine which also works against the virus — however, it has a high risk of side effects and can’t be used on people who have HIV or are pregnant. Then there is a newer smallpox vaccine that also works on monkeypox, without the risks of the older vaccine. Though the U.S. has ordered nearly 7 million doses, it has struggled to expedite the acquisition and distribution process. In fact, 1 million doses that have already been purchased have been held up in a manufacturing facility in Denmark awaiting on FDA clearance. The CDC estimates that roughly 1.5 million American men are eligible for the vaccine based on their guidance.
As states and localities have received a slow drip of vaccines, appointments have been gobbled up faster than they can be set up. New York City, learning from lessons of COVID-19, has decided to give as many first doses as they can and worry about the follow up doses later. This goes against FDA guidance but is the type of response that is warranted in an emergency.
Limited access to treatments: An FDA approved smallpox antiviral drug, TPOXX, is presumed to work on monkeypox, but will require physicians to obtain special permission to use it on their monkeypox patients. The bureaucratic application process creates further delays in treating patients suffering from the symptoms of monkeypox: lesions, headaches and sometimes debilitating pain.
It’s important to note that this virus isn’t COVID-19. It’s not a novel, deadly virus without treatments or vaccines. There is no need for widespread masking or shutdowns. Indeed, the United States government has been forward looking enough to order monkeypox/smallpox vaccines and stockpile treatments, but now that the virus has presented itself, the government can’t seem to efficiently deliver on the last mile of getting the therapeutics to patients.
COVID-19 and monkeypox illustrate that the threat of diseases is ongoing — pathogens will continue to emerge and pose a threat to the public. It’s paramount that the U.S. invest in the pandemic preparedness infrastructure to meet demand as I outlined in an earlier paper. It’s time for the government to learn from its missteps and invest in the public health system, such as on the ground clinics, as well as supply chain infrastructure, and to embrace greater flexibility when combating novel threats.
FACT: 4.85 billion people have been vaccinated against COVID-19 worldwide
THE NUMBERS: Vaccination rates for adults, by world income group*
Upper-middle income countries 78%
High-income countries 73%
United States 67%
World 61%
Lower-middle income countries 55%
Low-income countries 19%
Source: Ourworldindata.org for percentages by income level. World Bank definitions for these classifications are above $13,205 in Gross National Income per capita for ‘high-income, $4,206 – $13,204 for upper-middle income, $1,086 – $4,205 for lower-middle income, and under $1,085 for low-income.
WHAT THEY MEAN:
The world’s first COVID vaccine jab, delivered by nurse May Parsons, went to a 91-year-old Margaret Keenan at University Hospital Coventry in England, on December 8, 2020. That was 331 days after the first publication of the coronavirus’ DNA sequence. With another 589 days have gone by since Ms. Keenan’s first shot, where do we stand?
According to the Johns Hopkins University Coronavirus Information Center, health care providers like Ms. Parsons have given 11.84 billion vaccine shots worldwide. This has “fully vaccinated” 4.84 billion people, or 61% of the world’s population. (“Fully vaccinated” by JHU’s definition: two mRNA shots or one Johnson and Johnson shot.) A study last month conducted by the British medical journal The Lancet calculates that these vaccinations have cut worldwide COVID-19 deaths by a range from 14.4 million to 19.8 million, in the context of an epidemic of 565 million known cases and 6.4 million known deaths. Each day the total rises a bit, as providers administer about 9 million more shots. This is a remarkable, even stunning, achievement of government and private-sector science, transnational manufacturing and logistics, and health-provider delivery. But it remains an achievement with gaps; and these may grow more important as new variants emerge and immunity conferred through early vaccination fades.
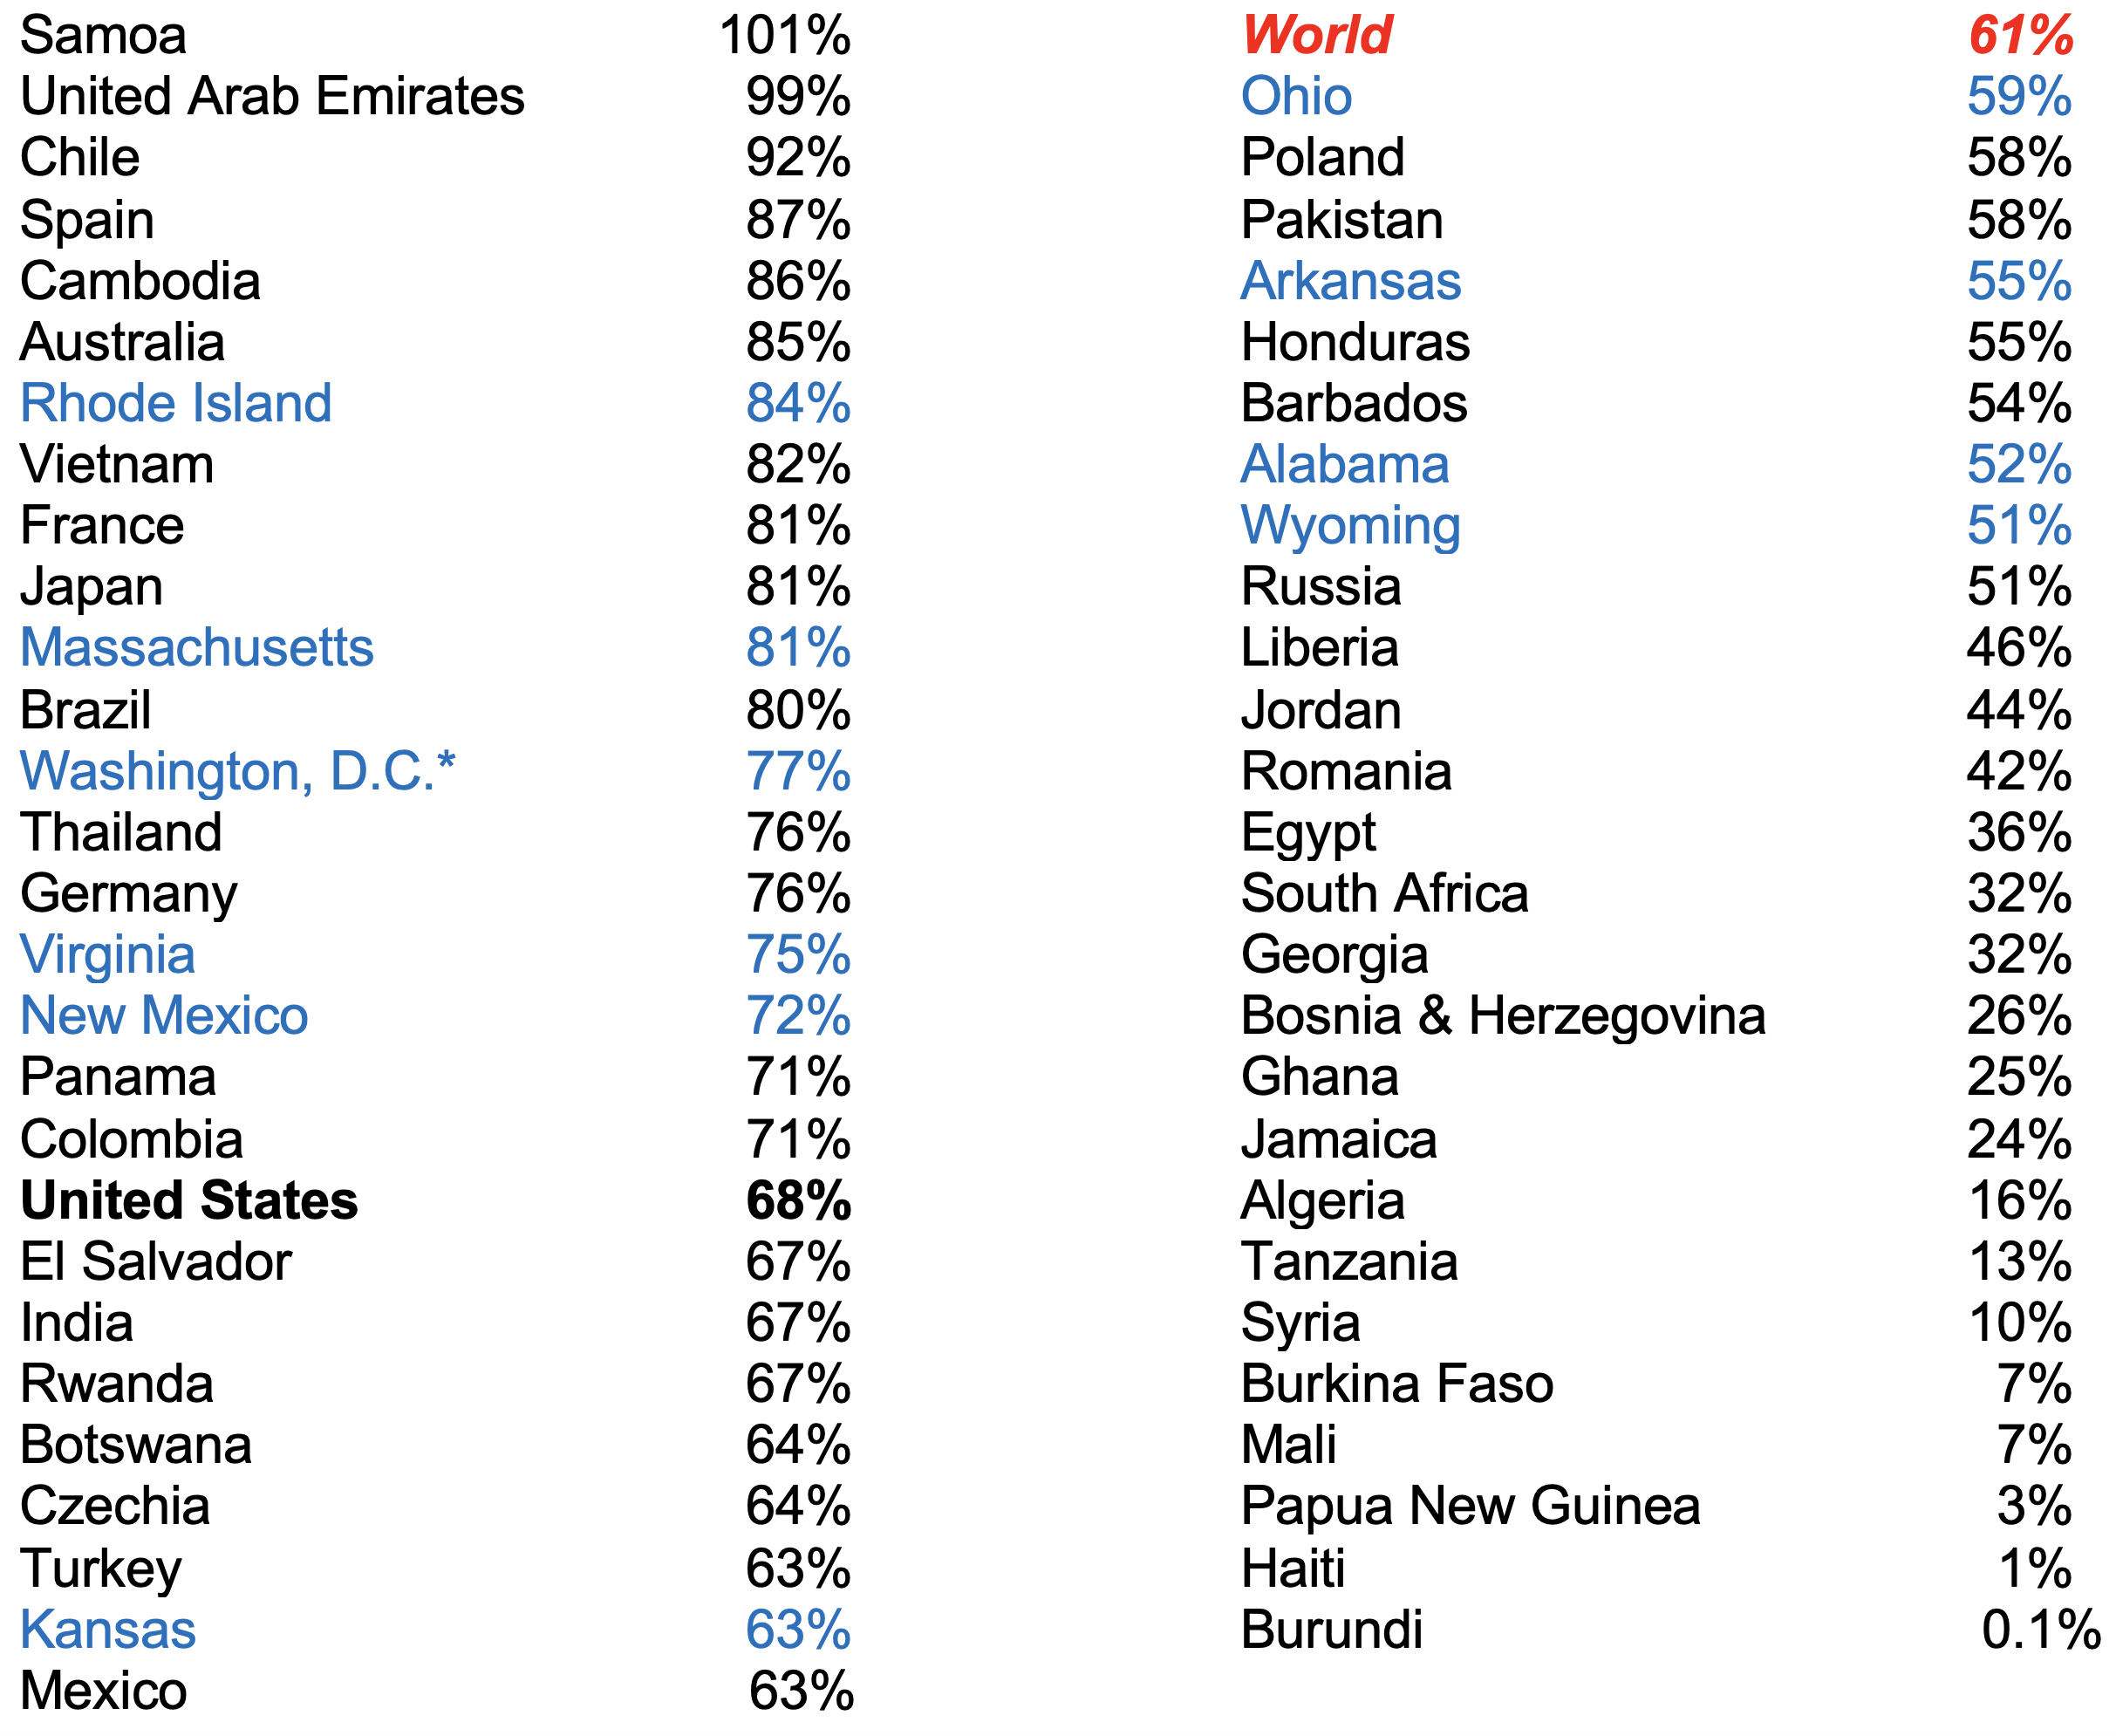
One gap is that of income. People in rich and upper-middle income countries are somewhat more likely to be vaccinated than people in lower-middle-income countries, and low-income countries are far behind both. Low-income countries also appear to be relatively more reliant on Chinese- and Russian-produced vaccines that offer lower levels of protection than U.S./European vaccines. There are also some gaps by region – vaccination rates appear relatively high in South America, East Asia, ASEAN, the Pacific Islands and western Europe, and relatively low in southern and eastern Europe, the Middle East, the Caribbean, South Asia, and Africa. These general patterns have many exceptions — low-income Asian countries including Cambodia and Bhutan are near the top of the vaccination-rate tables, for example — and some countries in very similar circumstances report quite different results. As an extreme case, the world-low vaccination rate in JHU’s table is Burundi’s 0.1% of the population (13,800 of 12 million people); next-door Rwanda is at 65%, essentially the same as the United States.
The U.S. in a way mirrors the international pattern, with vaccination rates by state varying widely, and modestly correlating with state median income levels, political divisions, and larger geography. New England, where vaccination rates are in the 75% to 84% range, is comparable to the rates in Japan, France, and Australia, and taken as a distinct region would be near the top of the high-income spectrum. D.C., Hawaii, Puerto Rico, New York and New Jersey are also in the top ten. The “least vaccinated” group includes Wyoming and a set of deep South states; here, rates are in the 51%-55% range and at par with lower-middle income countries such as Tajikistan, Bolivia, and Honduras (and upper-middle income Russia). Explanations for relatively high U.S. state rates of vaccination may include lower public “vaccine hesitance”, strong outreach from state governments, high health-provider-to-population ratios and low levels of uninsured people. Explanations for lower rates, the reverse.
A table illustrates, with vaccination levels in sample countries and U.S. states drawn from the Johns Hopkins University Coronavirus Information Center:
Much, then, achieved. But with 3 billion still unvaccinated around the world, mortality counts still at 15,000 weekly, new variants emerging every few months, and many early vaccination recipients needing booster shots, much still to do.
* Using the District’s own 77% count; JHU has a perplexing 100% rate for D.C.
FUTURE READINGS:
TheLancet calculates that vaccinations have saved between 14.4 million and 19.8 million lives
Data on vaccination rates, new cases, death rates by country and U.S. state, etc.
Ourworldindata.org has an interactive site allowing selection of particular countries and regions.
Johns Hopkins U. Coronavirus Information Center reports 6.4 million deaths among 560 million cases since December 2020. The mortality count has diminished to a still-high 12,000 deaths per week worldwide, from levels in the range of 50,000-100,000 deaths per week from mid-2020 through late 2021.
At home:
Rhode Island’s 84% vaccination rate is the highest in the U.S.
Washington, D.C., is at 77% by its own count; the JHU list somehow credits the District with a 100% vaccination rate. Either way, one of the top U.S. vaccination performers. Mayor Muriel Bowser explains vax requirements.
The Centers for Disease Control and Prevention COVID-19 site.
Overseas:
USAID outlines its COVID aid program in low- and middle-income countries.
The WTO explains the state of debate on intellectual property rules and COVID.
The African Union outlines vaccination trends and policies in Africa.
And the OECD reviews the supply chains that produce and deliver vaccines.
ABOUT ED
Ed Gresser is Vice President and Director for Trade and Global Markets at PPI.
Ed returns to PPI after working for the think tank from 2001-2011. He most recently served as the Assistant U.S. Trade Representative for Trade Policy and Economics at the Office of the United States Trade Representative (USTR). In this position, he led USTR’s economic research unit from 2015-2021, and chaired the 21-agency Trade Policy Staff Committee.
Ed began his career on Capitol Hill before serving USTR as Policy Advisor to USTR Charlene Barshefsky from 1998 to 2001. He then led PPI’s Trade and Global Markets Project from 2001 to 2011. After PPI, he co-founded and directed the independent think tank Progressive Economy until rejoining USTR in 2015. In 2013, the Washington International Trade Association presented him with its Lighthouse Award, awarded annually to an individual or group for significant contributions to trade policy.
Ed is the author of Freedom from Want: American Liberalism and the Global Economy (2007). He has published in a variety of journals and newspapers, and his research has been cited by leading academics and international organizations including the WTO, World Bank, and International Monetary Fund. He is a graduate of Stanford University and holds a Master’s Degree in International Affairs from Columbia Universities and a certificate from the Averell Harriman Institute for Advanced Study of the Soviet Union.
Today, Taylor Maag, Director of Workforce Development Policy at the Progressive Policy Institute, released the following statement of support for the bipartisan ISA Student Protection Act of 2022, which will support enhanced accountability and transparency in higher education financing while ensuring stronger consumer protections and regulations.
“The Progressive Policy Institute has long supported Income-Share Agreements as a bold and innovative model for financing postsecondary education and training. These models can help nudge institutions and providers toward greater accountability for results and promote equitable access to higher education. The ISA Student Protection Act of 2022, recently introduced by Senators Warner, Young, Coons and Rubio, builds off of previous versions of the bill to ensure ISA models are of higher quality — ensuring greater transparency for students and providers as well as stronger consumer protections. PPI applauds this effort to fix higher education financing and supports the bill’s commitment to expand postsecondary opportunities for today’s students, while ensuring the necessary protections for their success.”
The Progressive Policy Institute (PPI) is a catalyst for policy innovation and political reform based in Washington, D.C. Its mission is to create radically pragmatic ideas for moving America beyond ideological and partisan deadlock. Learn more about PPI by visiting progressivepolicy.org.
Does Germany struggle with homelessness the same way cities like Denver do? What can the U.S. learn from Germany in regard to improvements to public transportation infrastructure? In the Fall of 2019, the Progressive Policy Institute (PPI) partnered with Das Progressive Zentrum (DPZ) and Alfred Herrhausen Gesellschaft (AHG) for a new project titled “New Urban Progress: Transatlantic Dialogue on the Future of Work,
Democracy, and Well-being” which is aimed at fostering metro innovation and democratic renewal in the spirit of transatlantic dialogue. The organizations joined forces and convened a group of fellows consisting of public servants, policy experts, and community activists from Germany and the United States for a collaboration that involves two international tours, four conferences, and ten cities, all while the twenty project fellows study how we can reimagine transatlantic relations and positively impact cities on both sides of the Atlantic.
Neel Brown, Managing Director at the Progressive Policy Institute sits down with Maria Willett, Chief of Staff to Mayor Bryan K. Barnett of Rochester Hills, Michigan and Steffen Haake, Senior Consultant at Dataport who are both New Urban Progress fellows and offer their thoughts on what they learned from the fellowship. Learn more about the Progressive Policy Institute and the New Urban Progress project. Learn more about Das Progressive Zentrum. Learn more about Alfred Herrhausen Gesellschaft.
Congratulations are in order to thousands of public charter-school parents, educators and advocates who lifted their voices in opposition to the U.S. Education Department’s proposed changes to the federal Charter School Program. Thanks to their relentless advocacy, the finalized rules adopted recently are more rational and slightly less burdensome than the bull-in-a-china-shop scheme the department unveiled in March.
Congress established the CSP in 1994 to provide federal support for children who are poorly served by traditional public schools. The CSP benefited from the support of every presidential administration since—until Joe Biden. Although the program represents a minuscule fraction of the federal education budget, the returns on that investment have been high: The millions of dollars in grants the CSP awards each year enable thousands of new public charter schools to open or to add additional campuses. The vast majority of these schools are located in urban centers, where they serve mostly low-income and minority children.
The department’s proposed rules would have required a public charter school seeking a CSP grant to form a partnership with a traditional public school—in other words, with a competitor. The grant-seeking public charter school would also have had to prove the “need” for a new school based solely on enrollment levels in the traditional schools in the district—ignoring that charter schools serve many purposes beyond the relief of overcrowding. The school also would have had to prove its student population would be “diverse.” Never mind that many traditional schools aren’t. This last demand overlooks both the realities of the U.S. housing market and the desire of some minority communities, such as Native Americans, to establish culturally relevant schools that serve specific student populations with unique needs.
Ben Ritz, Director of the Center for Funding America’s Future project at the Progressive Policy Institute (PPI) released the following statement:
“Earlier this week, PPI encouraged Congressional Democrats to give high priority to passing the U.S. Innovation and Competition Act (USICA) and a reconciliation bill that includes significant deficit reduction and clean energy provisions. Unfortunately, media accounts suggest that both initiatives are shrinking.
“We shared Sen. Manchin’s concerns about the original reconciliation bill’s overreaching and likely impact on inflation. But walking away from a bill with roughly half a trillion dollars of deficit reduction and significant investments in increasing energy supply would squander the best chance Congress has to help the Federal Reserve rein in rising prices. We hope he and Sen. Schumer will not give up on negotiating a compromise on these components of a reconciliation bill.
“Pro-growth Democrats who want to see the United States outcompete China also should be concerned about reports of a plan to vote next week on a bill that only includes funding for semiconductor subsidies. Losing government R&D funds and other key provisions in the U.S. Innovation and Competition Act (USICA) would be an enormous setback for America’s innovation and scientific prowess.
“We understand that Senate Minority Leader Mitch McConnell’s blindly partisan decision to withhold Republican support from a conferenced innovation bill complicates its path to passage. But retreating to a CHIPS-only approach would unnecessarily doom many higher priority pro-innovation policies. Instead, we urge Speaker Pelosi to put the full Senate-passed USICA on the floor for a vote in the House to circumvent McConnell’s obstructionism.
“Democrats must not snatch defeat from the jaws of victory.”
The Progressive Policy Institute (PPI) is a catalyst for policy innovation and political reform based in Washington, D.C. Its mission is to create radically pragmatic ideas for moving America beyond ideological and partisan deadlock. Learn more about PPI by visiting progressivepolicy.org.
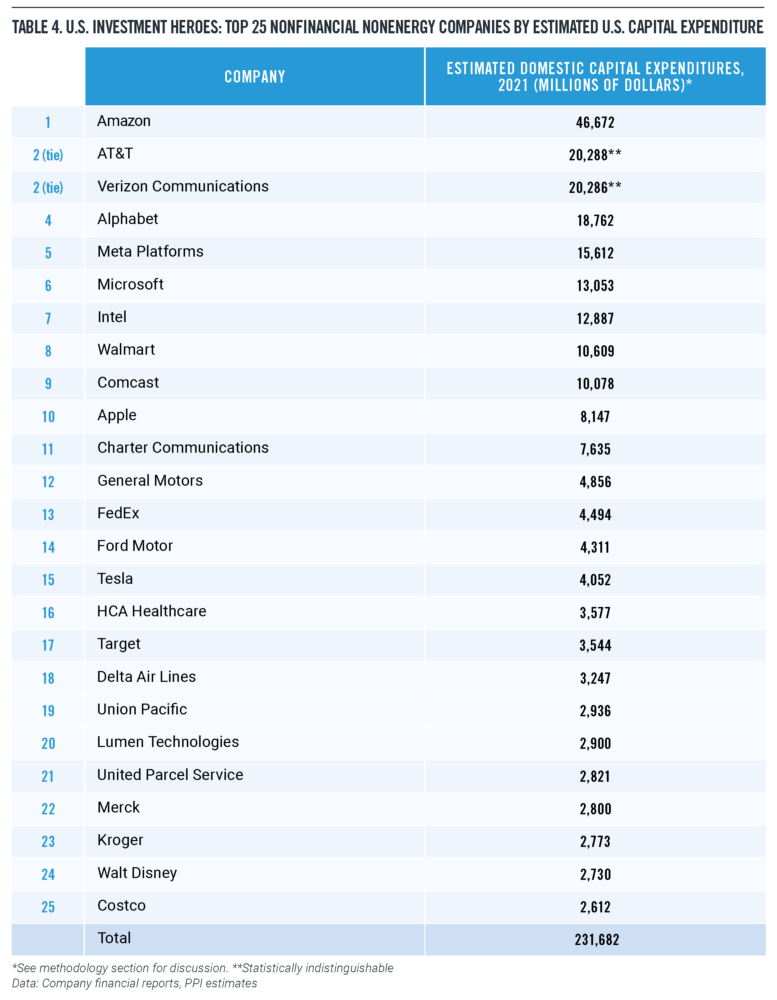
Today, the Progressive Policy Institute(PPI) released its annual Investment Heroes report, which shows companies with high and sustained capital investment in the United States have helped hold down price increases in the digital sector throughout the past year of otherwise record inflation. The report, titled “Investment Heroes: Fighting Inflation with Capital Investment”is authored by Dr. Michael Mandel, Vice President and Chief Economist at PPI, and Jordan Shapiro, Data and Economic Analyst at PPI.
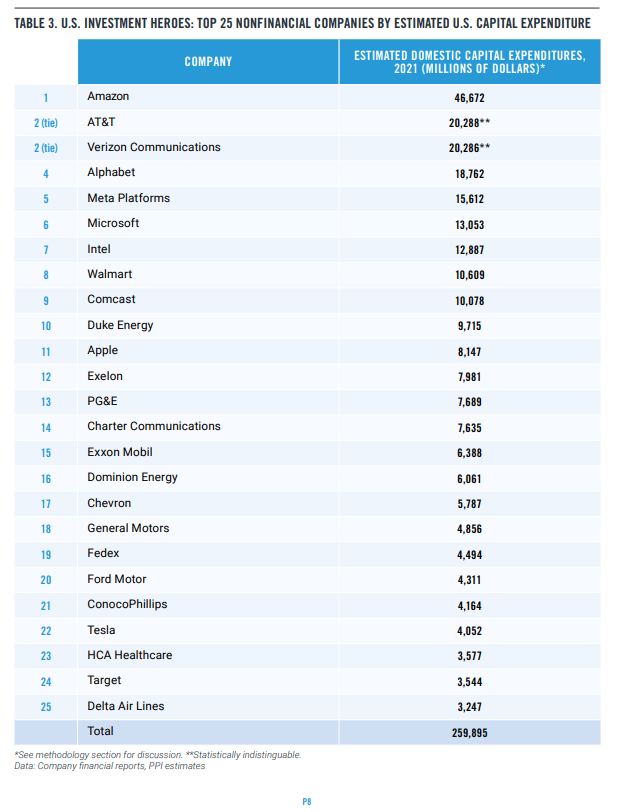
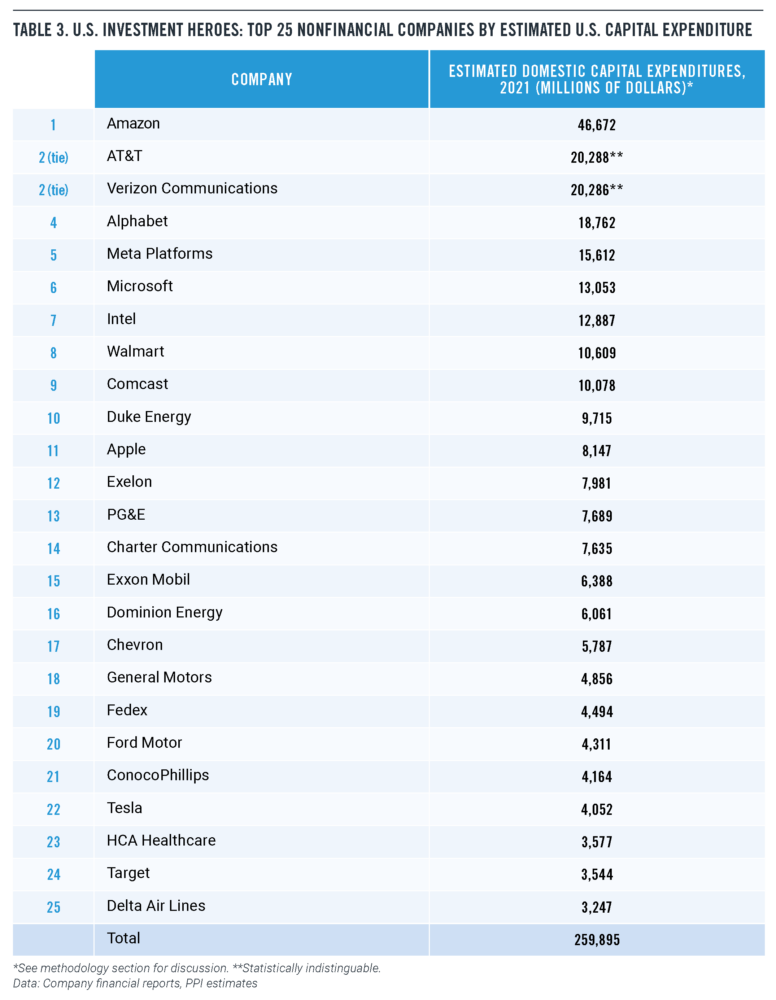
Nine of the 11 companies topping this year’s Investment Heroes list are in tech, broadband, or e-commerce. Amazon invested an amazing $46.7 billion in the U.S. in 2021, according to PPI estimates. AT&T and Verizon tied for second place at $20.3 billion, and Alphabet invested $18.7 billion in the U.S. in 2021.
PPI has created a unique methodology using publicly available financial statements from non-financial Fortune 200 companies to independently identify the top companies that were investing in the United States. These companies — our “Investment Heroes” — have helped to create good jobs, boost capacity, and reduce inflation as we recover from the aftershocks of the COVID-19 pandemic.
“Policymakers should praise and encourage those companies who invest in the United States, keep prices low, and reduce vulnerability against future shocks. That’s a clearcut win for consumers, workers, and the American economy,” write report authors Dr. Michael Mandel and Jordan Shapiro.
“Conversely, government leaders can’t pursue policies that reduce or discourage domestic capital investment and then complain when we don’t have enough capacity to meet our changing needs at an affordable price, whether it’s energy or semiconductor chips or anything else. In particular, it’s perplexing that Congress is putting so much energy into tech antitrust, when the sector has been a low-inflation, high-investment star performer,” the authors conclude.
See the full list of PPI’s 2022 Investment Heroes:
Read and download the full report here:
The Progressive Policy Institute (PPI) is a catalyst for policy innovation and political reform based in Washington, D.C. Its mission is to create radically pragmatic ideas for moving America beyond ideological and partisan deadlock. Learn more about PPI by visiting progressivepolicy.org.
The theme of this year’s Investment Heroes report is the powerful link between high investment and low inflation. Every year, the Progressive Policy Institute (PPI) analyzes the financial reports of large U.S. companies and ranks them by their capital investment in the United States. Nine of the top 11 companies on this year’s Investment Heroes list are in tech, broadband, or e-commerce industries. Amazon is at the top of the list, investing $46.7 billion in the United States in 2021 according to estimates by PPI. Tied for second are AT&T and Verizon, followed by Alphabet, Meta Platforms, Microsoft, Intel, Walmart, Comcast, Duke Energy, and Apple.
But here’s an important point for policymakers: As shown in a recent PPI paper, inflation in these digital industries has been extraordinarily low.1 High and sustained investment in new equipment and technology has created enough capacity to hold down most price increases in the digital sector, even as inflation has soared in other parts of the economy. For example, the price of wireless services at the consumer level was down by 0.7% in the year ending May 2022. In the year ending May 2022, the price of online advertising by internet publishing and web search portals only rose 0.6%.2
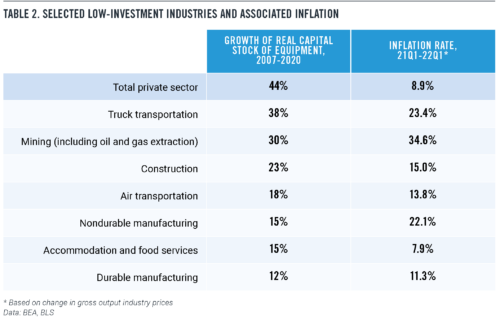
Policymakers should note that the link between investment and inflation works in the other direction as well: Low-investment industries are typically supply-constrained and more likely to boost prices when hit by an unexpected shock. Indeed, low-investment industries — including most of manufacturing, construction, trucking, air transportation, accommodations and food service, and mining — have all shown moderate to high inflation rates. And it’s generally agreed that domestic capital investment in the semiconductor industry has lagged, one of the few sectors of the digital economy contributing to inflation.3
For better or for worse, the case of the oil and natural gas industry illustrates the ways that low investment can lead to higher inflation.
Domestic investment in oil and gas drilling and exploration peaked in 2014 and collapsed by nearly two-thirds by 2016, according to data from the Bureau of Economic Analysis (BEA), as oil and gas companies faced a combination of low prices, pressures to use less fossil fuels for environmental reasons, and problems of pipeline and refinery capacity. And even though several energy production companies are still on our Investment Heroes list, their domestic capital outlays have continued to fall in the face of clear signals discouraging investment in fossil fuels. Exxon Mobil, in particular, decreased its U.S. capital spending by 43% from $11.2 billion in 2020 to $6.4 billion in 2021. This left the U.S. vulnerable to rising oil and gas demand and the unexpected shock of Russia’s invasion of Ukraine.
The key word here is “vulnerable.” No one is denying that free trade and globalization helped hold down prices for years. But when globalization is accompanied by a lack of domestic investment, the result is an inevitable increase in vulnerability and a loss of resilience. American workers become more vulnerable to foreign competition and downward pressure on real wages; American consumers become more vulnerable to domestic and international shocks and higher inflation; the country as a whole becomes more vulnerable from a national security perspective.
The policy and political implications are clear: Policymakers should praise and encourage those companies who invest in the United States, keep prices low, and reduce vulnerability against future shocks. That’s a clearcut win for consumers, workers, and the American economy. In some cases, like the semiconductor industry, it may be appropriate to use government funds to support domestic investment.
Conversely, government leaders can’t pursue policies that reduce or discourage domestic capital investment and then complain when we don’t have enough capacity to meet our changing needs at an affordable price, whether it’s energy or semiconductor chips or anything else. In particular, it is perplexing that Congress is putting so much energy into tech antitrust, when the sector has been a low-inflation, high-investment star performer. We would be better off as a country if other industries followed the tech/ecommerce/broadband lead and invested in America.
THE LINK BETWEEN INVESTMENT AND INFLATION
Over the past four years, Amazon, the top company on our list this year, has invested more than $115 billion in the United States, according to PPI estimates. This level of capital spending has powered unprecedented job creation, as Amazon operates e-commerce fulfillment centers across the country, and now employs more than 1.1 million workers in the United States.4
But perhaps equally important to U.S. consumers, Amazon’s investments in new logistics capacity have also helped keep down inflation, despite pandemic-related shocks. According to the Bureau of Labor Statistics (BLS), margins in “electronic and mail-order shopping” have shrunk by 6.4% in the year ending May 2022, compared to a 9.3% increase in margins for retail overall.5 Narrower margins for e-commerce means lower prices for consumers who shop online.
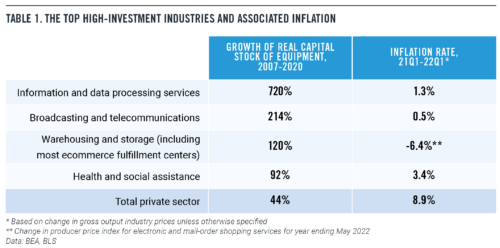
Indeed, tech, broadband, and ecommerce have all shown extraordinarily high long-term growth in their stock of productive capital (Table 1). For example, from 2007 to 2020, the stock of productive equipment in the information and data processing services rose by 720%, compared to a 44% increase for the private sector as a whole. The second biggest percentage gain was in the telecommunications and broadcasting industry, and the third biggest percentage gain was in the warehousing industry, which reflects the growth of e-commerce fulfillment centers.
At the same time, the tech, broadband and e-commerce industries have shown extraordinarily low rates of price increases during this inflationary surge. In addition to the shrinking margins in e-commerce already mentioned, the price of broadband access is down by 0.2% at the producer price level in the year ending May 2022. Overall, prices in the telecommunications and broadcasting industry have only risen by 0.5% in the year ending the first quarter of 2022, according to the BEA, despite everyone’s increased need for broadband and wireless connections. Prices in the information and data processing industry, which includes most internet companies, are up by only 1.3% in the year ending with the first quarter of 2022.
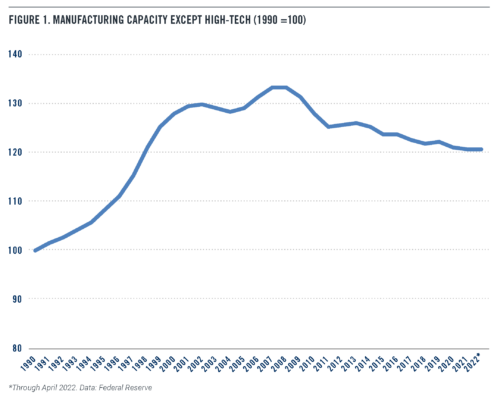
On the other hand, low-investment industries are more likely to be prone to inflation. Consider the paper and wood product industries. Since the pandemic began, Americans have been bedeviled by a series of seemingly inexplicable shortages of paper products, running from the great toilet paper gap of early 2020, to more recent shortages of disposable coffee cups6 and tampons.7 The shortages become less surprising when you realize that paper product companies have reduced their domestic manufacturing capacity by 17% since the beginning of the financial crisis in 2007. Capacity in the domestic wood product manufacturing industry is down 23% over the same period.8
Moreover, anyone who studied the economics of supply and demand in college won’t be surprised that prices rose in the paper and wood industries as paper mills closed and capacity shrank. Producer prices in the paper industry have soared by 16% over the past year. And since the pandemic began, producer prices in the wood industry are up a startling 67%.
And the disinvestment continues. Consider paper-making giant Georgia-Pacific, part of privately-owned Koch Industries. In March 2022, GP executives announced that they were shutting down a paper mill in Green Bay, Wisconsin, that had been making tissues and toilet paper since 1901.9 This followed a string of other paper mills and related manufacturing facilities that Georgia-Pacific’s managers had closed in recent years, including GP’s January 2021 announcement that it was shutting a Dixie Cup factory in Easton, Pennsylvania.10 GP has announced specific investments, but the private company is not required to release its overall capital investment figures publicly.
Overall, domestic manufacturing capacity, outside of high-tech, peaked in 2007, and since then has fallen by almost 10% (Figure 1). Over the same period, consumer purchases of goods, outside of high-tech, are up about 45%. With this growing mismatch between supply and demand, the U.S. has become ever more vulnerable to shocks in the global trading system.
Similarly, domestic iron and steel product capacity peaked in 2009, and since then has fallen by 25%, including a continued decline during the pandemic. Not surprisingly, the domestic price of steel has skyrocketed, because there is much less domestic capacity that can be brought online when needed.
When we look outside of manufacturing, we see the same pattern: For example, the stock of equipment such as airplanes owned by the air transportation industry rose by only 18% from 2007 to 2020, far slower than the 44% gain for the private sector as a whole.11 Not surprisingly, producer prices charged by the airline industry, including passengers and freight, jumped by 27% in the year ending May 2022 to their highest levels ever.
THE BIG PICTURE
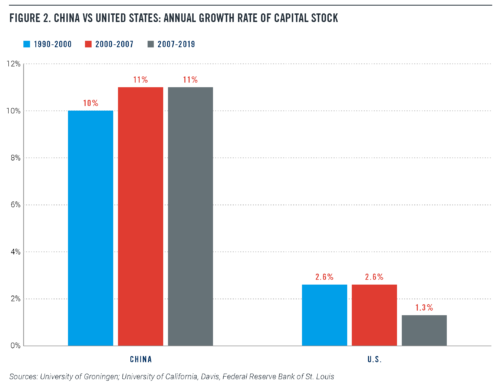
The United States entered the pandemic struggling with a capital investment drought that had lasted more than a decade. During the financial crisis of 2008-2009, domestic nonresidential investment in structures and equipment plunged as a share of gross domestic product, and never really recovered. As a result, the rate of U.S. capital stock growth fell in half, going from an average annual rate of 2.6% from 1990 to 2007, to only 1.3% from 2007 to 2019.
Meanwhile the capital stock in China has been growing at an 11% annual rate. As long as global supply chains worked well, the U.S. domestic investment shortfall didn’t matter too much to consumers (though it did matter to U.S. workers whose productivity and real wages weren’t rising). Inflation was low, held down by a flood of cheap goods coming out of China, the rest of East Asia and Europe.
However, this capital investment drought set up the conditions under which the United States has become more vulnerable to inflation, just like a dried-out forest is ready to burst into flames from an errant spark or lightning strike. Any kind of a shock — like the pandemic, supply chain disruptions, armed conflicts — can translate into price increases.
But some companies have been fighting the prevailing trend of capital spending weakness. Since 2012, PPI has provided unique estimates of domestic capital spending for individual major U.S. companies. Currently, accounting rules do not require companies to report their U.S. capital spending separately. To fill this gap in the data, we created a methodology using publicly available financial statements from non-financial Fortune 200 companies to identify the top companies that were investing in the United States.
We call these companies “Investment Heroes” because their capital spending is helping to create good jobs, boost capacity, and reduce inflation across the country. In 2021, the 25 companies on our list invested $260 billion in the U.S. This year’s list includes 10 tech, broadband, and e-commerce companies; seven energy production and distribution companies; two transportation companies; three automotive companies; two retail companies; and one health care company (Table 3). Later in this paper, we discuss the methodology that we use to estimate these figures.
Let’s look at each company on the list individually:
1. Amazon’s 2021 estimated U.S. capital spending was $46.7 billion, a 38% increase compared to its already impressive 2020 total. Principally, its increase in spending was directed toward augmenting the capacity of its fulfillment centers and growing its cloud services.
2. (tie) AT&T was tied for second with Verizon, spending an estimated $20.3 billion in the U.S. in 2021, up from $17.8 billion in 2020 (adjusted for the change in methodology described below). Its U.S. investment focused on expanding its network capacity.
2. (tie) Verizon Communications, tied for second with AT&T, increased its domestic capital expenditures to $20.3 billion in 2021, up from $18.2 billion in 2020 (adjusted for the change in methodology described below). The company continued to invest in adding capacity and density to its 4G network while building out its 5G network.
4. We estimate that Alphabet invested $18.8 billion dollars on U.S. capital expenditures in 2021. The company directed its investments toward technical infrastructure including servers, network equipment, and data center construction as well as office facilities and building improvements.
5. Meta Platforms came in fifth this year with an estimated $15.6 billion in U.S. capital spending. The social media company continues to invest in data center capacity, servers, network infrastructure, and office facilities. In 2021, the company increased metaverse-related investments.
6. Sixth is Microsoft with an estimated $13.1 billion in domestic capital spending based on its July 2021 10-K, the most recent available. The software company continues to invest in new facilities, data centers, computer systems for research and development, and its cloud offerings.
7. Intel slightly increased its domestic capital expenditure in 2021 to $12.9 billion, up from our estimate of $12.5 billion in 2020. Intel started work on two new fabs in Arizona, and announced investments in Ohio and New Mexico.
8. Walmart spent a reported $10.6 billion on U.S. capital expenditures in its fiscal year ending January 31, 2022, up sharply from $7.8 billion the previous fiscal year. Its investments were principally directed toward supply chain and customer service improvements. In addition, the company invested in online grocery services and selected Spartanburg County, South Carolina, as the location for its new hightech grocery distribution center.12
9. We estimate in 2021 that Comcast invested $10.1 billion in the U.S. Increases in capital spending were directed toward scalable infrastructure and line extensions.
10. Duke Energy invested $9.7 billion, slightly less than its 2020 figure. The decrease in spending was due to lower investment in the commercial renewables segment.
11. Apple is eleventh on this year’s list, investing an estimated $8.1 billion, a 37% increase in domestic capital spending from the previous year. Our estimates are based on Apple’s October 2021 10-K, which is the most recent annual report. The company began plans for a North Carolina campus with 3,000 employees.13
12. Exelon spent $8.0 billion on capital investments in 2021, a slight decrease from 2020.
13. PG&E invested $7.7 billion in 2021, about even with 2020 levels. In 2021, the company announced the beginning of a decade of spending to bury its powerlines as a wildfire prevention strategy.23
14. Fourteenth on the list is Charter Communications with domestic capital expenditures of $7.6 billion, a slight increase from the 2020 figure of $7.4 billion. The increase is due to payments for scalable infrastructure and network upgrades.
15. Exxon Mobil decreased its U.S. capital spending by 43% from $11.2 billion in 2020 to $6.4 billion in 2021. The company decreased its upstream, downstream, and chemical spending. In 2022, the company announced plans for a carbon capture and storage project in Baytown, Texas.
16. Dominion Energy invested $6.1 billion on U.S. capital expenditures, a slight decrease from $6.3 billion in 2020. Dominion is involved in the construction of an American-built wind turbine installation vessel.
17. Chevron’s reported U.S. capital expenditure in 2021 was $5.8 billion, a slight decrease from $6.1 billion in 2020.
18. General Motors invested $4.9 billion dollars in the U.S. in 2021 according to our estimates, a 28% increase from 2020. The company has announced large investments in electric vehicles and battery plants.
19. FedEx’s domestic capital expenditures in 2021 were estimated at $4.5 billion, a very small decrease from our 2020 estimate, based on its July 2021 10-K. The company’s capital spending was directed toward package handling and sorting as well as to aircraft and vehicle spending in their transportation segment.
20. The twentieth company on the list this year is Ford Motor with an estimated $4.3 billion in U.S. capital spending in 2021. The company announced new factories in Kentucky and Tennessee to support electric vehicle production.15
21. ConocoPhillips increased its U.S. capital spending by 41% in 2021 to $4.2 billion. Development activities included investment in the Permian, Eagle Ford, and Bakken regions.
22. Tesla is No. 22 with a big increase in estimated domestic capital spending to $4.1 billion. The increase is due to the construction of a Gigafactory in Texas and expansion of a factory in Fremont, California.
23. HCA Healthcare directed $3.6 billion to capital investments in 2021, an increase from 2020. HCA announced plans to build 3 new hospitals in Florida and 5 in Texas.
24. Target invested $3.5 billion in the United States this year, up 34%.The additional spending was targeted at store remodels, store reopening, and supply chain initiatives. In 2021, the company remodeled 145 stores around the country and expanded digital fulfillment capabilities.
25. The twenty-fifth company to make the list is Delta Airlines with an estimated $3.2 billion in U.S. capital expenditures in 2021. The airline’s capital spending was primarily related to aircraft and airport improvements, in mid-2021, it announced adding 30 new Airbus A321neo models to its fleet.16
METHODOLOGY
Our U.S. Investment Heroes ranking for 2022 follows the same methodology as our most recent report in 2021, with a few small tweaks. We started with the top 200 companies of the 2021 Fortune 500 list as our universe of companies, expanded from the previous 150 companies. We removed all financial companies and all insurance companies except health insurance companies. We also omitted the financing operations of non-finance companies when possible.
Except as noted, we use the global capital expenditure reported on the most recent 10-K through April 2022 as the starting point for the analysis. In this report, we refer to all estimates as “2021,” even if the fiscal year ended in 2022. Capital expenditures generally cover plant, equipment, and capitalized software costs. For energy production companies, capital expenditures can include exploration as well.
For wireless companies, we did not include their often sizable spending on purchases of wireless spectrum as part of capital expenditures, since that category is not counted as investment spending by the economists at the Bureau of Economic Analysis. Companies purchasing spectrum in 2021 notably includes Verizon (which paid $45.5 billion for the licenses it won in a February 2021 spectrum auction) and AT&T (which paid $22.9 billion for spectrum won at the same auction).
The companies in these rankings are all based in the United States. Non-U.S.-based companies were not included in this list because of data comparability issues, although there are many non-U.S. companies that invest in America. Notably, T-Mobile US, with more than $12 billion in purchases of property and equipment in 2021, would have made the Investment Heroes list if it was not owned by Deutsche Telekom.
For transportation companies, our report estimates the booked location of spending on capital expenditures for the company’s most recent fiscal year, rather than how much of those acquired assets are actually being used within the U.S.
Most multinational companies do not provide a breakdown of capital expenditures by country in their financial reports. However, PPI has developed a methodology for estimating U.S. capital expenditures based on the information provided in the companies’ annual 10-K statements and other financial documents. After developing our internal estimate, we contact the investor relations offices of the companies on our top 25 list to ask them to point us to any additional public information that might be relevant. Notwithstanding these queries, we acknowledge that the figures in this report are estimates based on limited information.
Our estimation procedure goes as follows:
If a company has no foreign operations, we allocated all capital spending to the United States.
If a company reported U.S. capital spending separately, we used that figure.
If a company did not report U.S. capital spending separately, but did report changes in global and U.S. long-lived assets or plant and equipment, we used that information plus depreciation to estimate domestic capital spending. As appropriate, we adjust for large acquisitions. That was not necessary this year.
If a company has small foreign operations that were not reported separately, or if the company’s net capital stock is falling, we allocated capital spending proportionally to domestic versus foreign assets, revenues, or employees.
Some adjustments of note:
For Amazon, the methodological issue was their extensive use of finance leases. We chose to specify global capital expenditures as purchases of property and equipment (net of proceeds from sales and incentives) plus principal repayments of finance leases. We then used reported changes in U.S. and non-U.S. property and equipment, net, and operating leases to allocate global capital expenditures, taking into account depreciation and removing the effect of operating leases.
Similarly, as part of our process for estimating domestic capital spending for Microsoft, Meta Platforms, UPS, and Kroger, we included principal repayments on finance leases reported on the company’s 10K, or amortization of finance leases based on 10K data, as part of capital spending.
In previous years for Verizon, we made a small adjustment for foreign operations, even though non-U.S. assets or revenues are not broken out in the company’s 10K. This year we made the judgment call to stop making that adjustment, which had the effect of somewhat increasing Verizon’s estimated domestic capital spending.
AT&T reported vendor-financed purchases of equipment separately from capital expenditures. We made the decision this year to add them back in. We allocated capital spending domestically in proportion to the U.S. share of net property, plant, and equipment.
In the case of Comcast, we allocated all of its cable operations and corporate capital expenditures, including cash paid for intangible assets such as capitalized software, to the U.S. NBC Universal’s capital expenditures was allocated to the U.S. in proportion to our estimate of the US share of NBC Universal’s revenues.
For consistency, we omitted capital spending by the finance arm of companies such as General Motors and Ford, which reflects the financing of leased equipment rather than actual direct investment.We then used our estimates to construct two lists, the main list (Table 3) and an additional list (Table 4) which omits non-energy companies. The second list is relevant because capital spending by energy exploration and extraction companies tend to fluctuate sharply with the price of energy.
5. Based on Producer Price Index data released by the Bureau of Labor Statistics on Jun 14, 2022.
6. Mike Pomranz, “Starbucks Is Struggling to Keep Stores Stocked with Coffee Cups,” Food & Wine, February 10, 2022, https://www. foodandwine.com/news/disposable-paper-cup-shortage-starbucks.
7. Taylor Telford, “Yes, There’s a Tampon Shortage. Here’s Why,” The Washington Post, June 13, 2022, https://www.washingtonpost.com/ business/2022/06/13/tampon-shortage-product-shortages-inflation-supply-chain/
10. “GP to Expand Dixie Capacity in Lexington, Ky.; Will Close Operations in Easton, Pa., End of 2021,” Georgia-Pacific News, https://news. gp.com/2021/01/gp-to-expand-dixie-capacity-in-lexington-ky-will-close-operations-in-easton-pa-end-of-2021
11. A sizable number of planes are owned by leasing companies. But even taking those into account, the capital stock of aircraft only rose by 26% over this period, well below the average for the private sector as a whole.
12. “Walmart Selects Spartanburg County for New, High-Tech Grocery Distribution Center,” South Carolina Office of the Governor Henry McMaster, October 19, 2021, https://governor.sc.gov/news/2021-10/walmart-selects-spartanburg-county-new-high-tech-grocerydistribution-center.
13. Stephen Nellis, “Apple to Establish North Carolina Campus, Increase U.S. Spending Targets,” Reuters, April 26, 2021, https://www. reuters.com/technology/apple-establish-north-carolina-campus-increase-us-spending-targets-2021-04-26/.
14. Bryan Pietsch, “After a Slew of Disastrous Wildfires, PG&E Will Bury 10,000 Miles of California Power Lines,” The Washington Post, July 22, 2021, https://www.washingtonpost.com/nation/2021/07/22/pge-power-lines-california-wildfires/.
15. Phoebe Wall Howard, “Ford to Build New Plants in Tennessee, Kentucky in $11 Billion Investment in Electric Vehicles,” Detroit Free Press, September 28, 2021, https://www.freep.com/story/money/cars/2021/09/28/ford-motor-company-electric-vehicle-plants-batterieskentucky-tennessee/5896095001/.
16. Woodrow Bellamy, “Delta Air Lines Expands Fleet with New Airbus A321neo Order,” Aviation Today, August 24, 2021, https://www. aviationtoday.com/2021/08/24/delta-air-lines-expands-fleet-new-airbus-a321neo-order/
Today’s surging oil and gas prices confront progressive climate activists with a discomfiting truth: Their campaign to vilify and suppress fossil fuel production has crashed headlong into Americans’ urgent appetite for affordable energy.
The green left is not happy with President Biden, who is pulling out all the stops to give Americans some temporary relief from punishingly high fuel prices. That includes jawboning U.S. oil companies to drill more, a widely panned proposal to suspend the federal gas tax and Thursday’s controversial visit to Saudi Arabia, whose leaders the White House has implored to boost production to stabilize world oil markets.
It’s true that high fuel prices are heightening the contradiction at the heart of the Biden administration’s climate and energy policies. If your overriding aim is to drive down consumption of fossil fuels, high prices are a good thing. But that’s a hard sell to working families struggling with $5 a gallon gas and soaring utility bills.
With the midterm elections looming, activists shouldn’t be too quick to pillory Biden — especially since it’s their premature if not utopian demands to abolish fossil fuels as soon as possible that have landed him and his party in this predicament.
FACT: World shipping container capacity has grown six-fold since 2000
THE NUMBERS: World container-shipping fleet capacity, in TEUs* –
2022 25.8 million TEU
2010 12.8 million TEU
2000 4.3 million TEU
1990 1.2 million TEU
1980 0.5 million TEU
* “Twenty-foot Equivalent Units.” A TEU represents one 20 x 8 x 8.5 foot shipping container; a 40-foot container is two TEUs.
WHAT THEY MEAN:
A quick modern maritime trade history, in three ships:
1. The Warrior: In 1954, the National Academy of Sciences studied the voyage of a “general cargo” freighter from New York to Hamburg. The Warrior, measuring 142 meters long, 19 wide, and 32 deep, had a crew of 44. On this voyage it carried 194,582 individual pieces of cargo, which weighed 5,015 tons and arrived at the port in a kaleidoscopic 15 types of “packaging.” The study’s author counted 24,036 bags, 10,671 boxes, 717 cartons, 74,908 cases, 5 “reels”, 815 barrels, 888 cans, 15,38 drums, 2,877 packages, 2,634 pieces, 21 crates, 10 transporters, 2,880 bundles, 53 wheeled vehicles, and 1,525 “undetermined” types of packages. A 22-person “longshore gang” took 35 days to pack this cargo in wooden pallets in New York and load it onto the ship. The German crew at the other end of the trip needed 4 days to unload it after arrival.
2. The Ideal-X: The first container ship, a retrofitted World War II freighter renamed Ideal-X, launched in April 1956 from Newark on a trip to Houston. It was about the same size as the Warrior — 160 meters long, 9 wide, and 21 deep — and carried 58 proto-containers holding 10,572 tons of cargo. Malcolm McLean, the North Carolina trucking executive who designed it, is said to have calculated that traditional “breakbulk” loading of Warrior-type ships cost $5.83 per ton of cargo. (“Breakbulk”: Loading individual cargo items into ship holds after packing them in wooden pallets; see below for a real-life case study in this.) Simply disconnecting a truck’s trailer from the chassis and putting it on deck, by contrast, cut this cost by 97%, to 16 cents per ton. Ideal-X took eight hours to load.
By 1990, a worldwide fleet of 1169 container-ships was carrying around over 1.2 million TEU, or an average of over 1,000 twenty-foot containers per ship. A decade-old but still striking paper (Daniel Bernhofen, Zouheir el-Sahli, Richard Kindner) investigated the effects of the shift from break-bulk to containerized cargo, concluding that it had been about twice as powerful a driver of trade growth as tariff cuts and trade agreements. Specifically:
a. Participation in the two multilateral GATT agreements of the era — the “Kennedy Round” of 1968 and the “Tokyo Round” of 1979, which applied to 94 countries as of 1990 — raised trade volume 285%, or three-fold.
b. Participation in free trade agreements (meaning in practice the creation of the European Economic Community in the late 1950s, its expansion from the original six members to 12 between 1973 and 1985, plus the U.S.-Canada auto pact of 1965, the U.S.-Israel FTA of 1985, and the U.S.-Canada FTA of 1988) raised trade about 45% or half-fold. (If “half-fold” is a word).
c. Adoption of container shipping raised trade 790%, or nine-fold.
3. The Ever Alot: Since Mclean’s ingenious low-tech innovation, container shipping has followed a sort of Moore’s Law-like expansion curve, with capacity at least doubling every decade. By 2000, fleet capacity had reached 2400 ships carrying 4.3 million TEU, and by 2010, 4700 ships and 12.8 million TEU. The 6,406 container ships active as of mid-2022 carry 25.8 million TEU, meaning an average of over 4,000 containers per ship. A median-size container vessel is said to take about 15 hours to load and unload.
The largest container ship yet built — unpoetically but accurately named Ever Alot – is owned by Taiwan’s Evergreen lines, and went into service on June 22. It is 400 meters long, 61.5 meters wide, and 100 meters deep; requires a crew of 25; and can carry 24,004 TEU. At maximum weight, this would be about half a million tons of cargo, equivalent to 100 Warriors or 50 Ideal-X’s. Ever Alot arrives at Malaysia’s Tanjung Pelepas port tomorrow.
FURTHER READINGS:
UNCTAD’s 2021 Review of Maritime Transport has data and trends for container ships, oil tankers, port efficiency, and more about the 99,8000 large commercial vessels on the water this year.
A decade-old but still compelling visualization of the maritime world.
Bernhofen, el-Sahli, and Kindner on the trade impact of conversion to container shipping 1960-1990. No similar study appears to have been done so far on the impact of the larger scale of container shipping in the subsequent thirty years.
A dissenting view: Container modernization is accelerating too fast; very big ships are forcing unhealthy shipping-line consolidation and creating a capacity glut.
Then and now
The Ever Alot,launched three weeks ago, carries 24,004 containers.
Though the National Academy study of the Warrior appears unavailable online, Marc Levinson’s The Box (2005), written for the 50th anniversary of the Ideal-X’s journey, has a summary of the survey, as well as a large-scale review of the invention, spread, and implications of container shipping, 1956 to 2005:
A bit more perspective — Ideal-X was innovative, but not very large. The largest 19th century clipper ship, the 1853 Great Republic, was just a bit smaller, and could carry nearly as much cargo as the Warrior: 102 meters long, 16 wide, 25 deep and able to carry about 3,500 tons of cargo. From the Smithsonian’s American History Museum.
And two more book recommendations:
Horatio Clare’s Down to the Sea in Ships (2015) recounts a trip on the Gerd Maersk, a 6,600-TEU ship built in 2006, from the U.K.’s Felixstowe port through the Suez Canal, to Malaysia, Vietnam, and China, and ending at Los Angeles. Detail on crew life (Filipino ratings, European and Indian officers; no alcohol at any time), cargo loading, rules for avoiding piracy, the approach to the Port of L.A. etc.
And Richard Hughes’ In Hazard (1938), the great novel of the logistics industry, recounts the fictional passage of a small British general-cargo vessel (Chinese ratings, U.K. and American officers) from Virginia into a gigantic Caribbean hurricane.
ABOUT ED
Ed Gresser is Vice President and Director for Trade and Global Markets at PPI.
Ed returns to PPI after working for the think tank from 2001-2011. He most recently served as the Assistant U.S. Trade Representative for Trade Policy and Economics at the Office of the United States Trade Representative (USTR). In this position, he led USTR’s economic research unit from 2015-2021, and chaired the 21-agency Trade Policy Staff Committee.
Ed began his career on Capitol Hill before serving USTR as Policy Advisor to USTR Charlene Barshefsky from 1998 to 2001. He then led PPI’s Trade and Global Markets Project from 2001 to 2011. After PPI, he co-founded and directed the independent think tank Progressive Economy until rejoining USTR in 2015. In 2013, the Washington International Trade Association presented him with its Lighthouse Award, awarded annually to an individual or group for significant contributions to trade policy.
Ed is the author of Freedom from Want: American Liberalism and the Global Economy (2007). He has published in a variety of journals and newspapers, and his research has been cited by leading academics and international organizations including the WTO, World Bank, and International Monetary Fund. He is a graduate of Stanford University and holds a Master’s Degree in International Affairs from Columbia Universities and a certificate from the Averell Harriman Institute for Advanced Study of the Soviet Union.
In a high-inflation environment, railroads are one of the few positive notes. Adjusting for the rising price of inputs like energy, so-called “value-added” prices of rail services are down by 2.6% over the last year. Meanwhile, value-added prices for air freight and passenger services are up by 20.5%, and value-added prices for trucking services are up by 33.4%, also adjusting for the price of inputs such as energy.
That’s why the current bargaining impasse in the railroad industry is distressing. The national railroads and rail labor unions are in a 30-day “cooling off period” that ends July 18. To avoid a strike or a lock-out, President Biden is likely to appoint a Presidential Emergency Board (PEB) to make settlement recommendations before a final cooling off period ends in mid-September.
While not directly part of the national negotiations, an important backdrop that the Tier 1 rail carriers have invested more than $11 billion in installing Positive Train Control (PTC), a system that makes rail movements much safer. The carriers propose to use this new technology to operate more efficiently by redeploying many conductors out of trains to ground-based positions. The rail unions are resisting this change at the individual carrier level, while demanding higher wages at the national level.
To work their way through the complicated puzzle of technology, wages, and productivity, President Biden needs to appoint PEB members who understand the railroad industry, and who are experienced arbitrators. That is the best route towards achieving a fair outcome that doesn’t disrupt the economy and further fuel inflation.
Progressive Policy Institute President Will Marshall and Center for Funding America’s Future Director Ben Ritz today urged Congressional Democrats to focus on four top legislative priorities ahead of the looming August recess break.
In a memo to Democrats, Marshall and Ritz argue Congress should seize the opportunity to:
Protect our democracy with Electoral Count Act reform;
Tackle inflation, energy, and health care costs through reconciliation;
Help America outcompete China by passing the bipartisan U.S. Innovation and Competition Act (USICA); and
Fill all 77 judicial vacancies
With control of both the House and Senate up for grabs in the fall, this could be the last chance to pass these crucial reforms before the usual midterm losses put MAGA extremists in a position to block any national progress for the remainder of President Biden’s first term,” Will Marshall and Ben Ritz write. “By taking action before the August recess on these four urgent priorities, Congressional Democrats could compile an impressive record of progressive reform and governing competence to run on in November.
Read the memo below:
MEMORANDUM
TO: Congressional Democrats
FROM: Will Marshall and Ben Ritz, PPI
RE: Four Legislative Priorities Before the August Recess
Under Democratic leadership, the 117th Congress has produced major wins for the American people. Nearly 70% of Americans are “fully vaccinated” against COVID and 80% have had at least one dose. The United States is enjoying its strongest job recovery ever and wages are rising. The bipartisan infrastructure law increased domestic infrastructure spending by $550 billion, the largest investment in America’s productive capacity in a generation. Congress approved President Biden’s request for military aid to help Ukraine defend itself against Russian aggression. The U.S. Senate confirmed Ketanji Brown Jackson as the first Black woman on the Supreme Court. And a determined Congress just passed the bipartisan Safer Communities Act — the first national gun safety bill in over 30 years.
Before they leave for August recess, Congressional Democrats should seize the opportunity to build on this solid record of accomplishment by acting to safeguard our democracy, ease inflationary pressure, expand America’s high-tech lead, create new jobs in clean energy, and lower health care premiums. With control of both the House and Senate up for grabs in the fall, this could be the last chance to pass these crucial reforms before the usual midterm losses put MAGA extremists in a position to block any national progress for the remainder of President Biden’s first term.
Therefore, we urge Congressional Democrats to focus on these four vitally important priorities over the next month:
PROTECT DEMOCRACY WITH ELECTORAL COUNT ACT REFORM
The top priority should be to reinforce the guardrails around America’s Constitutional democracy. Although his violent Jan. 6 coup attempt failed, ex-president Donald Trump continues to undermine the integrity of U.S. elections. In a blatant bid to rig future elections in advance, he’s backing MAGA election deniers running for Congress as well as governor and secretary of state in the key battleground states he lost in 2020. Congress must update the Electoral Count Act to make it impossible for defeated presidents and their accomplices to overrule American voters and steal a national election.
TACKLE INFLATION, ENERGY, AND HEALTH CARE COSTS THROUGH RECONCILIATION
Americans across the political spectrum agree that inflation is the greatest economic challenge we face today. The new, more focused reconciliation bill Democratic leaders are crafting with Sen. Joe Manchin could help reduce the cost of living while also salvaging some key elements of last year’s overreaching Build Back Better blueprint. It would cut budget deficits by roughly $500 billion, making it easier for the Federal Reserve to rein in rising prices without triggering a recession.
The new reconciliation bill also should include an ambitious set of consumer and business tax incentives for dozens of clean energy technologies, based on a $325 billion, 10-year package of clean energy tax incentive bill approved by the Senate Finance Committee last year, a version of which has already passed the House. These measures would stimulate hundreds of billions of dollars in private sector clean technology investment throughout the economy while creating millions of new jobs. They are also very popular with voters.
Congress made health insurance more affordable for over 13 million Americans this year when it increased the subsidies for plans purchased through the Affordable Care Act exchanges as part of the American Rescue Plan. But the increase was temporary, and if lawmakers let it expire, premiums will increase 53% on average. To make matters worse for Democrats, rate increase notices will be sent out in October, even if they don’t go into effect until January. It is unlikely that the full increase can be made permanent because of its high costs, but Democrats can blunt the pain and permanently fix the ACA “subsidy cliff” that existed before this year for less than $150 billion over 10 years as part of a sustainably financed reconciliation bill.
It’s essential that Democratic leaders and Sen. Manchin get to “yes” on a radically pragmatic reconciliation bill that unites their ideologically diverse party and delivers a major win for President Biden’s domestic agenda. They should resist pressure from the progressive left to enact other gimmicky giveaways that would squander these savings and undermine the bill’s inflation-fighting potential.
HELP AMERICA OUTCOMPETE CHINA BY PASSING THE BIPARTISAN INNOVATION BILL
Lawmakers have yet to finish conferencing the U.S. Innovation and Competition Act (USICA) passed last year by the Senate with the House-passed America COMPETES Act. This bipartisan innovation bill would make an historic investment in semiconductor manufacturing capacity, research and development, STEM workforce development, and supply chain resilience. By passing it, Congress would signal its determination to keep America ahead of China in the race for scientific and technological leadership.
USICA also presents an opportunity for Congress to set up a more robust and equitable system of career pathways for non-college workers. The COMPETES Act, for example, would expand apprenticeship opportunities to reach historically underserved populations, including youth and people re-entering their community after incarceration. It would also promote apprenticeships in non-traditional industries, creating nearly one million additional opportunities in new and emerging fields over the next five years.
But the House version of the bill unfortunately was larded with extraneous trade provisions that are unrelated to the bill’s core emphasis on boosting U.S. innovation and competitiveness. These should be set aside and argued out in some other legislative context. Meanwhile, Senate Minority Leader Mitch McConnell has vowed to pull his party’s support from the conference as long as Democrats continue work on passing a budget reconciliation bill. Although there are elements of the Senate bill that could be improved in a conference committee, the best way to circumvent McConnell’s blatant obstructionism may be for House Democrats to simply vote to send the Senate-passed USICA to President Biden’s desk, negating the need for further negotiations.
FILL COURT VACANCIES FASTER
The Supreme Court’s recent flurry of deeply polarizing decisions underscores the perils of allowing Republicans to pack federal courts with far-right ideologues. Although President Biden has nominated and confirmed more temperate federal judges at a record pace, it hasn’t been fast enough to keep up the rate of judicial retirements. To fill all 77 vacancies, he and Senate leaders must pick up the pace.
By taking action before the August recess on these four urgent priorities, Congressional Democrats could compile an impressive record of progressive reform and governing competence to put before the voters in November.
Will Marshall is the President and Founder of the Progressive Policy Institute.
Ben Ritz is the Director of PPI’s Center for Funding America’s Future.
The Progressive Policy Institute (PPI) is a catalyst for policy innovation and political reform based in Washington, D.C. Its mission is to create radically pragmatic ideas for moving America beyond ideological and partisan deadlock. Learn more about PPI by visiting progressivepolicy.org.