A NOTE TO READERS
PPI Vice President Ed Gresser submitted this testimony to the International Trade Commission at its public hearing on “U.S.-Pacific Islands Trade and Investment: Opportunities and Impediments” on February 14, 2023. The ITC held this hearing as part of a “Section 332” investigation project requested by U.S. Trade Representative Ambassador Katherine Tai as part of the implementation of the Pacific Strategy released by the Biden Administration at the U.S.-Pacific Islands summit in September 2022.
Chairman Johanson and Commissioners:
Thank you very much for this opportunity to offer thoughts as the U.S. International Trade Commission considers America’s trade and investment relationship with the Pacific Island countries.
By way of introduction, I am Vice President of the Progressive Policy Institute (PPI), a 501(c)(3) nonprofit think tank, established in 1989 and publishing on a wide range of public policy topics. In this position, I oversee our research and publications on trade and global economy matters. I came to PPI in October 2021, after six years of service as Assistant U.S. Trade Representative for Trade Policy and Economics.
Among the Trade Policy and Economics Office’s responsibilities is administration of the Generalized System of Preferences. During my term at USTR, in October 2018, I made a GSP- focused visit to Papua New Guinea and Fiji to discuss the program with these two countries’ government, policy, and business communities, and also with representatives of the 18-member Pacific Islands Forum at the group’s headquarters in Suva. I believe I and Lauren Gamache, an ITC expert on detail to USTR at the time, were the first USTR officers to visit the region at least since the 1980s (with the exception of APEC-related travel to PNG), and perhaps much longer. My testimony will draw on this visit and subsequent research and discussions, focusing principally on the third topic Ambassador Katherine Tai raises in her request letter: Pacific Island beneficiary country use of GSP, and ways in which GSP might more effectively serve their development goals and U.S. policy.
INTRODUCTION
As a point of departure, I strongly endorse the Biden administration’s effort to rethink and upgrade U.S. policy in this region. The administration’s “Pacific Partnership Strategy,” released at the U.S.-Pacific Islands Country Summit meeting in September 2022, lays out goals, including:
“Partnering with the Pacific Islands to drive global action to combat climate change … maintaining free, open, and peaceful waterways in the Pacific in which the rights to the freedom of navigation and overflight are recognized and respected, people are prioritized, trade flows are unimpeded, and the environment is protected. … [and] ensuring that growing geopolitical competition does not undermine the sovereignty and security of the Pacific Islands, of the United States, or of our allies and partners.”
I believe these goals mesh well with those of Pacific Island governments. I was struck, for example, by how many of my interlocutors took the opportunity during conversations focused on trade and tariff issues to stress their concern about climate change and overfishing, the strong and emotional commitment many stated for liberal democratic political systems, and their close study of U.S. trends in these areas. And I feel that as the Biden administration and Congress consider future policies, the United States has many political and financial assets in these areas. For example:
- Geographically, the Pacific Island countries may seem far away, but are near neighbors to Hawaii, American Samoa, Guam, and the Northern Marianas Islands, and U.S. policy can therefore have a disproportionate impact;
- Economically, we are roughly at par with New Zealand and Australia as their largest export market and largest source of remittance flows; and
- In people-to-people terms, 1.4 million Americans trace their families to Pacific islands and have accordingly significant economic and intellectual influence on many Pacific Island countries.
The Biden administration and Congress, through ideas like Representative Ed Case’s “BLUE Pacific Act,” is looking for ways to use these assets more effectively. I believe GSP, assuming Congress renews the program, can help with this task. First of all, more than half of all Pacific Island countries are GSP beneficiaries. Ambassador Katherine Tai’s September 29, 2022, request letter to the ITC on the Pacific Islands lists 22 countries and territories of concern. Thirteen of these are GSP beneficiary countries: the Cook Islands, Fiji, Kiribati, Niue, Papua New Guinea, Pitcairn, Samoa, the Solomon Islands, Tokelau, Tonga, Tuvalu, Vanuatu, and Wallis and Futuna. The Pacific Islands region thus includes over 10% of all 119 current GSP beneficiary countries, though since their sizes are small, GSP imports from this group are rather low, varying between $10 million and $20 million over the last decade. Thus, they typically make up about 2% to 5% of the roughly $500 million in U.S. imports from Pacific Island countries and 0.1% of the $20 billion in annual total GSP imports.
GSP can be more effective in supporting the Pacific Islands countries in trade and economic diversification than it has been to date. And given that the scale of U.S.-Pacific Island trade is extremely small, even a significant increase would have minimal impact on the U.S. economy or on other countries exporting to the United States. However, it should not be “oversold,” and should be part of a larger program that also includes support for trade facilitation and logistical efficiency, lower-cost financial flows, and digital linkages in the region and with the United States. This is because while a tariff preference program on its own can create useful pricing advantages for small-country producers, it also has limits, and these are especially clear in the Pacific Island region:
(a) A tariff preference is only useful for products where tariff rates are above zero. Most Pacific Island country exports are natural resources and fishery products, which are already mostly duty-free under MFN tariffs in the United States, and tropical agriculture goods where tariffs are low.
(b) A tariff preference is most effective in high-tariff products, and many high-tariff products (e.g. clothing and canned tuna) are excluded from the U.S. GSP system as import-sensitive.
(c) Experience with targeted preference programs such as the Caribbean Basin Initiative and African Growth and Opportunity Act show that tariff benefits have only limited ability to offset geographical disadvantages and high transport costs.
So GSP or an alternative regional preference program will be most effective if accompanied by support for improved logistics, training in marketing of products in areas of Pacific Island comparative advantage, reduction of U.S.-Pacific Island and intra-Pacific communications and financial costs, and other measures.
BACKGROUND: PACIFIC ISLANDS GEOGRAPHY AND TRADE
Geographically, the South Pacific’s roughly 3,000 islands spread over an expanse of water as large as Asia, Europe, and North America combined. They combine to form 14 independent countries, three French overseas territories, one U.S. state, three U.S. insular territories, and three autonomous territories associated with Australia and New Zealand. Together they are home to about 11.5 million people, including about 9 million in Papua New Guinea, one million in Hawaii, and 1.5 million in the other 15 countries and territories combined. Their populations are very small (apart from Papua New Guinea), in a range from 10,000 to 900,000. And with the exception of Fiji, their economies are simple ones resting on small-scale agriculture, fisheries, tourism, and, in a few cases, logging and mining.
To review their trade profiles briefly:
OVERALL TRADE SUMMARY
First, while the Pacific Island countries’ trade volumes are low in comparison to those of larger countries, the islands are relatively trade-dependent. The World Bank’s estimate of their “trade share of GDP” has ranged from 80% to 100% over the past decade, a figure about double the 50% for all developing countries and four times the U.S.’ 25% level. This reflects in part their need to import most (and in some cases all) of their fuel, machinery, and marine technologies, but Pacific Island country exports are also quite large, typically around 40% of GDP.
Second, their exports are concentrated (with the exception of Fiji’s) in fishery products and natural resource goods. Major exports include canned and fresh tuna, tropical timber, mining products such as gold and copper, coconut, and primary agricultural goods ranging from chocolate and vanilla to taro, sweet potatoes, and cassava.
Third, their trade costs are high and their “connectivity” is low. A recent UNCTAD/World Bank/Pacific Islands Forum report (2021) shows the region is less advanced than others in implementing WTO Trade Facilitation Agreement measures such as the early release of shipments, special treatment for perishable goods, and electronic payment of customs duties and fees.
With these overall points as the background status quo, the U.S. is a major market for most Pacific Island countries, purchasing about a quarter of their total exports. We are not, however, an overwhelmingly large market, as is the case for the Caribbean islands. Other significant Pacific Island country markets include Australia and New Zealand, Japan, China, several ASEAN countries (typically purchasing fresh fish for processing), and intra-island trade.
The Census Bureau reports about $400 to $500 million a year in imports from the Pacific Islands, as against a range of $550 million to $1.25 billion in U.S. exports to these countries over the past five years. The largest share of U.S. Pacific Island country imports is in fisheries and agriculture, with fisheries accounting for $100 million in 2021, and agriculture a slightly lower $93 million. Agricultural import trends reveal some clear comparative advantages for Pacific Island producers. For example, Fiji ranks 5th, Samoa 11th, and Tonga 15th as sources of taro; Fiji is 9th and Tonga 12th as sources of cassava; Samoa ranks 9th as a supplier of coconut oil; Papua New Guinea and French Polynesia are suppliers of natural vanilla and Papua New Guinea of high-quality coffee and cocoa beans. Drinking water from Fiji is also a large import, at $40 million. Manufactured goods are a relatively small share of Pacific Island imports, as only Fiji has a significant manufacturing sector.
An important point to note here, as Appendix 1 illustrates in statistical form, is that roughly 80% of America’s Pacific Island country imports are duty-free under MFN tariff rates. This includes most fresh and chilled fish, water, coffee, and other natural resources. Thus, GSP is not relevant to some important Pacific Island nation products, and a program intended to improve the islands’ overall export fortunes should consider ways to improve the competitiveness of MFN-zero goods, as well as look at preference options.
COUNTRY SUMMARIES
Economically and for trade policy purposes, it might be useful to divide the islands into three groups, each sharing some general characteristics:
Group 1: Fiji
Fiji is unique in the region as a middle-income, complex economy with a container port as well as air cargo capacity, light manufacturing in processed foods and garments, and a relatively large and diverse export economy. It is also a center of policymaking and intellectual debate, as the site of the Pacific Islands Forum and the main campus of the University of the South Pacific.
According to the IMF’s “Direction of Trade Statistics” database, Fiji typically exports just under $1 billion per year, with the U.S. buying 20% to 25% of the total. The leading U.S. import is drinking water, widely sold under the “Fiji Water” brand. Australia and New Zealand are together a comparably large market for Fijian goods, as are the other Pacific islands.
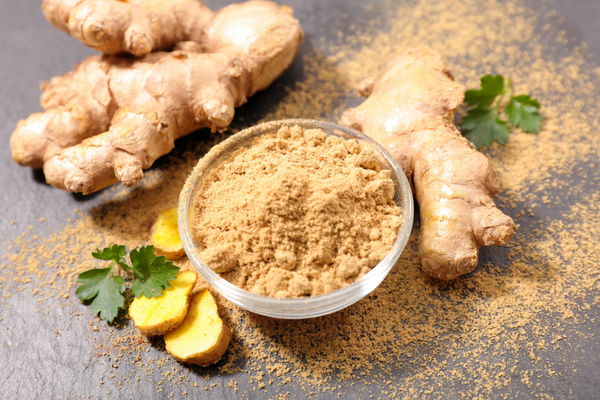
Fiji is a successful GSP exporter in processed foods and some farm products, especially above-quota cane sugar (1.46 cents/kg), fresh and chilled taro (2.3% MFN tariff), candied and sushi-quality ginger (2.4% MFN tariff), bakery products (4.5% MFN tariff), and a canned fish product (6.0%). GSP imports typically are $10 million and $20 million per year, or about 5% to 10% of Fiji’s exports to the United States. The plant east of Suva which accounts for much of Fiji’s GSP ginger exports employs several hundred Fijians and at the time of my visit was using Oregon-distilled vinegar and Florida-made food manufacturing machinery to produce candied and sushi-quality ginger for American and Australian customers.
Fiji also has a large fisheries industry, including a fish processing plant. Several Fijian officials inquired as to whether canned tuna, for which U.S. MFN tariffs range as high as 35%, could be made GSP-eligible. It is already eligible for least-developed countries, but has traditionally been politically sensitive when proposed for eligibility for all beneficiary countries, given the importance of a tuna cannery to employment on American Samoa. It may also be that simply adding canned tuna to GSP without some attempt to reserve the benefits for Pacific Island countries might yield little, as larger producers such as Thailand and the Philippines would be eligible as well and might be lower-cost and preferred sources.
Group 2: Samoa, Tonga, Niue, Cook Islands, Tokelau, French Polynesia
These are small island archipelagoes, often heavily reliant on fishery and vulnerable to storms and overfishing by foreign fleets. The U.S. is a large export market for this group, whose $250 million in exports to the world in 2021 included $64 million to the United States. Other markets include Australia, New Zealand, and Japan. Several of these countries are successful GSP users. Tongan exports to the U.S. typically range between $1 million and $10 million, with up to 30% covered by GSP, led by taro (2.3% MFN tariff), yams (6.4%), frozen and chilled cassava (7.9% and 4.5%), and sweet potato (6.0%). GSP likewise applies to $2.9 million of Samoa’s $9.1 million in exports to the U.S., including fruit juice (0.5 cents/liter), taro (2.3%), and several processed foods under GSP.
French Polynesia is not a GSP beneficiary country.
Group 3: Papua New Guinea, Solomon Islands, New Caledonia, Vanuatu
These countries have extensive land area and undeveloped economies — the Solomon Islands are a Least Developed Country, and Vanuatu and Papua New Guinea are slightly above the LDC line — centered on large, generally foreign-owned mining and timber resource industries.
Papua New Guinea is unusual among Pacific Island countries for its large population, roughly 9 million. By World Bank estimates, PNG is the most “rural” country in the world, with 87% of the population living in villages, and has very limited internal road and air connectivity. Papuan exports total about $7 billion per year, concentrated in mining and timber for Asian markets (accounting for about 30% of Papuan GDP). The U.S. is a relatively small market for Papuan goods, with U.S. imports concentrated in MFN-zero products such as coffee, cocoa beans, vanilla, shrimp, and artwork. One product — oilcake, a coconut residue, with an MFN tariff of 0.45 cents/kg — frequently arrives in the U.S. under GSP, I believe for scientific purposes, with a value of about $0.3 million per year.
Vanuatu and the Solomon Islands have significant fishery industries, and the Solomon Islands have a large timber industry meant for Asian markets, accounting for about 25% of GDP. The Solomon Islands, as the region’s only Least-Developed Beneficiary Country, is the only Pacific Island state able to export duty-free canned tuna (in variety subject to a 12.5% MFN tariff) under the GSP program. Vanuatu has not exported under GSP in recent years, and New Caledonia is ineligible for GSP based on per capita income.
Group 4: Kiribati, Nauru, Tuvalu, Cook Islands, Niue, Tokelau
These are very small atoll states, with extremely low populations ranging from roughly 600 for Niue to about 40,000 for Kiribati. They have simple economies, often producing fish for local consumption and sometimes coconut products. Nauru is ineligible for GSP based on per capita income levels, and Tokelau is recorded as exporting a small quantity of miscellaneous goods under GSP. Their worldwide exports combined for $270 million in 2019, with the U.S. a very modest market at about $3.5 million.
Group 5: Marshall Islands, Palau, and the Federated States of Micronesia
These are “compact” states, assigned to the United States by the U.N. as Trust Territories after the Second World War and gaining their independence in the 1980s and 1990s. They are covered by a specially designed duty-free program, including duty-free privileges for canned tuna, and are not enrolled in GSP.
Final Point on Small-Scale Trade
Finally, though this is hard to measure, Pacific Island countries may be relatively more reliant on very small-scale trade flows than most countries.
Tongan writer Epeli Hau’ofa suggested this in a 1990s essay entitled Our Sea of Islands, in which he describes the large economic role emigrant workers in Australia, New Zealand, and the United States play in island economies:
“[A]t seaports and airports throughout the Central Pacific, consignments of goods from homes abroad are unloaded as those of the homelands are loaded. Construction materials, agricultural machinery, motor vehicles, other heavy goods, and a myriad other things are sent from relatives abroad, while handicrafts, tropical fruits and root crops, dried marine creatures, kava, and other delectables are dispatched from the homelands. Although this flow of goods is generally not included in official statistics, much of the welfare of ordinary people of Oceania depends on an informal movement along ancient routes drawn in bloodlines invisible to the enforcers of the laws of confinement and regulated mobility.”
TOWARD POLICY
How can U.S. policy generally, and GSP significantly, help the countries draw more economic and development benefit from trade? We should begin with some realism and avoid over-promising. The Pacific Island countries’ small population makes economic integration and diversification difficult, the large distances between them and the relatively high cost of transport and communications make economic integration and value-added exporting more challenging than is the case for (for example) the Caribbean, and most Pacific Island exports are already duty-free under MFN tariff rates.
However, trade preferences such as GSP can help in combination with capacity-building programs. The Biden administration has several options at different levels of ambition, ranging from more regular communication of GSP benefits to Pacific Island businesses and governments, to communication plus capacity-building in logistics, trade facilitation, and financial flows, to a regional program covering all Pacific Island country imports including those considered “import-sensitive.” Obviously, some of these are more ambitious and would require more political capital. But equally as obvious, the level of U.S. imports from the Pacific Islands is extremely low, and the real-world chance of any industrial disruption (or a significant import diversion away from other sources) emerging from even a large increase in Pacific Island imports would be minimal.
A next-generation approach to GSP or more broadly to trade preferences could set goals including:
- Help Pacific Island countries diversify their economies and attract investment in labor-intensive industries through more extensive or better use of preferences;
- Support regional economic integration, intra-Pacific Island trade flows and joint trade policy development;
- Encourage sustainable forestry, mining, and fisheries;
- Work closely with U.S. allies such as Australia and New Zealand;
- Work on logistical costs and marketing opportunities as well as tariff policy.
With these goals in mind, I recommend five steps in the near-term, and the consideration of a sixth. The near-term options are (1) renew the GSP system soon; (2) add an environmental eligibility criterion during this renewal; (3) allow Pacific Island Forum members to “cumulate” one another’s inputs to qualify products for duty-free treatment under the GSP rule of origin; (4) develop a program of regular visits to the region to help local businesses and governments understand their potential GSP benefits; (5) work closely with Australia, New Zealand, Japan, and other allies in upgrading the U.S. government’s capacity-building and technical assistance programs in trade facilitation; sustainable fisheries, mining and forestry; financial exchanges including remittance costs. The more ambitious (6) would be to create a regional preference program drawing on experience from the Caribbean Basin initiative, which provides duty-free access for sensitive products including canned tuna and apparel, and the African Growth and Opportunity Act, which has similar broad benefits and also serves as a convening device through annual meetings with African Trade Ministers and other officials.
1. Renew GSP System
First, I hope Congress will renew the GSP system soon. In principle, some new approaches to policy can help make GSP more effective than it has been in the past. But GSP benefits expired as of January 1, 2021, and have not been reauthorized. In practice, therefore, GSP is offering no support for Pacific Island or other developing-country trade. The first step in any new approach to this region is the renewal of the program benefits.
2. Add an Environmental Criterion
Second, as part of this renewal, I would recommend adding an environmental criterion to GSP’s current list of 15 mandatory and discretionary eligibility criteria. I personally feel that the major GSP reauthorization bills in the last Congress proposed too many new criteria, and probably too strict revisions of some already in the GSP statute. This made me concerned that systematic and equitable enforcement of the criteria would become difficult, leading either to somewhat arbitrary openings of reviews, or even to an unintended wholesale expulsion of beneficiary countries from the system. I do, however, believe an environmental criterion, related to sustainable timber and mining, maritime environmental issues, and sustainable fisheries, would serve both a general good and Pacific Island nation policy goals.
Island governments and the people they represent have a high concern for the protection of fisheries and marine resources, but with very small governments their ability to impose these policies is modest. Likewise, the large timber and mining exports of some countries, amounting to 25% of GDP or more, can lead to deforestation if not managed properly and can also create incentives for corruption. A criterion can help encourage governments to give these issues priority and provide some leverage in the event that we see problems. But we should also be aware that often their resources are very small, not only in terms of finances but in terms of the number of trained lawyers, scientists, police officials, and other policy implementers a country of 100,000 people can bring to any policy problem. Therefore, the aim of eligibility criteria in the environment (or other areas) should be to encourage governments to adopt good policies and make good-faith efforts to enforce them, rather than to require enforcement levels often beyond their reach. An environmental criterion should also be complemented by capacity-building programs for Coast Guard training, fisheries management, and sustainable timber and mining industries. The Millennium Challenge Corporation is in fact working on a Compact to support the Solomon Islands on this issue.
3. Regional Cumulation
Third, assuming GSP is renewed, I recommend that the U.S. Trade Representative authorize participants in
U.S.-Pacific Island Trade and Investment Framework Agreement meetings to “cumulate” the value of inputs bought from one another to meet GSP rules of origin. This would allow any Pacific Island GSP beneficiary country to use inputs from others and count the value of these inputs towards GSP’s 35% value-added rule of origin. For example, the Solomon Islands fish cannery could export tuna caught in Vanuatuan waters under GSP, and Fiji’s bakeries could use taro root grown in Tonga.
This would at least to a modest extent encourage regional integration, a major goal of the Pacific Islands forum. Cumulation is already in place for sub-Saharan African countries enrolled in the African Growth and Opportunity Act, and members of the Caribbean Community in CBTPA and CBERA. My understanding is that this can be done through an administrative action by the U.S. Trade Representative, and I strongly recommend that she take this action for Pacific Island countries.
4. Build Awareness of U.S. Market Opportunities
Fourth, increase the frequency of visits by U.S. government economic and trade officials to ensure that island government officials and businesses understand the opportunities GSP benefits can create. As noted earlier, my own visit to Fiji was the first to any Pacific Island country other than APEC member Papua New Guinea by a USTR official in at least 40 years and perhaps in the agency’s history. Presentations on GSP issues drew extensive interest and attendance in both Suva and Port Moresby from officials, scholars, businesses, and representatives of other island governments. Since then, USTR has concluded Trade and Investment Framework Agreements with Fiji and Papua New Guinea, which have created a forum for regular government-to-government discussions on a range of topics, including GSP but also issues related to fisheries management, bilateral trade issues, WTO cooperation on fishery subsidies and electronic commerce, and other issues. It may also be valuable to include training in marketing for Pacific Island country agricultural producers and businesses, both to help them reach overseas workers and other expatriates and to take more advantage of the apparent comparative advantage they have in taro, cassava, yams, and high-value chocolate and vanilla.
5. Trade Facilitation and Remittance Costs
Fifth, recognize that most GSP tariff margins are relatively modest, ranging in the Pacific Island cases from 2.3% to 7.9%. With Pacific Island logistics and communication costs high, these preferences provide only a limited advantage. Attention to tariff matters, therefore, while valuable, should be accompanied by technical assistance that can lower the cost of trade. Here major issues would be improving maritime and air transport capacity, reducing the cost of financial remittances and telecommunications, and other measures that can help ease the Pacific Islands’ cost disadvantages in general and perhaps especially for small-scale trade among family members conducted through packages, express delivery, and similar means. In the same way, the Administration spoke in the Pacific Strategy report of considering ways to lower the cost of remittances from overseas workers to families, which would raise purchasing power and make these links less costly.
In this area, the Administration should participate in and help to build upon the extensive work done by Australia and New Zealand in supporting regional integration and trade links. PACER-Plus, for example, includes significant Australian and New Zealand support for trade infrastructure, fisheries management, and other important policy questions, and it will be far better for the United States to provide support and complementary programs than to duplicate existing work.
6. Consider a Regional Preference Program
Finally, over the medium term, the administration and Congress should consider creating a regional trade preference program for the Pacific Islands. This would be a step comparable to the Caribbean Basin Initiative, which was launched in the mid-1980s as a development program for Central America and is now the centerpiece of U.S. trade relations with the Caribbean Island countries, or the African Growth and Opportunity Act in the case of sub-Saharan Africa, though it would affect a much lower level of imports than either of these programs. Such a program could include regular trade and economic discussions at the Trade Minister or Deputy Minister level, and authorize benefits for Pacific islands in products considered more sensitive such as canned tuna and apparel. This would obviously require Congressional legislation and some considerable political investment (including an investment in time and staff work by U.S. government officials), but could also bring a significantly greater return than an upgrade of GSP alone, both in terms of helping the Pacific Island countries succeed in trade and in developing a stronger basis for larger relationships.
CONCLUSION
In sum, I believe the administration’s decision to rethink Pacific Islands policy and develop more ambitious goals for these relationships is appropriate and timely. The United States has very substantial economic, human, and political assets in this part of the world, and can use them more effectively than we have in the past several decades, in the interest of both the United States and the Pacific Island countries.
Trade policy has a useful role to play in this, both through some redesign of U.S. trade preference programs, technical assistance and capacity-building, and more frequent and substantive contacts with Pacific Island governments and the Pacific Islands Forum as a group. I support Ambassador Tai’s interest in finding ways to achieve this, and hope my testimony provides useful material as the Commission considers the request.