President Biden has proposed to finance his $4 trillion American Jobs and Families Plans by raising taxes exclusively on corporations and households that earn above $400,000 — the top 1.5 percent of taxpayers. Biden is right that the rich should pay more than they currently do given the staggering income inequality in America that’s been made worse by the COVID pandemic.
Almost 60 percent of Americans support funding Biden’s spending plans with his proposed tax increases — seven times the share that supports debt-financing them. But while taxing the rich is smart policy and politics, funding America’s future and realizing Biden’s policy vision will also require asking more taxpayers to contribute to the public good.
Are Americans obsessed with their credit score? They have good reason to be worried, as there is much that ails the credit reporting industry.
Information at risk. As the Equifax breach in 2017 highlighted, the industry is vulnerable to cyberattacks that give hackers access to personal data and financial information.[1]
Reporting errors. According to a study by the Federal Trade Commission (FTC), one in five Americans had an error on their credit report.[2]
Credit reports are discriminatory. A study by the Consumer Financial Protection Board (CFPB) found that 45 million Americans have no (or an un-scorable) credit history — with the largest cohort of individuals residing in communities of color or low-income areas.[3]
Consumers have too little control over their credit reports. Historically, Americans have lacked any real control over their credit reports and credit reporting agencies have put in place barriers that make it very difficult to challenge errors in those reports.
Unfortunately, the leading legislative fix — creating a public credit reporting agency — would fail to remedy these serious problems.
The government has not proven to be a better guardian against cyberattacks any more than the private sector. Over 22 million Americans had their information stolen in the course of two separate attacks launched on the U.S. Office of Personnel Management between 2012 and 2015.
Error rates are common in government data, and trying to get them fixed is hardly simple. Anyone who has ever dealt with their local Department of Motor Vehicles (DMV) can attest to that. Furthermore, a public entity would be relying on the same data inputs as the private sector credit reporting agencies. So any errors in the data will still spoil the results.
Ensuring the algorithms used in credit scoring don’t have discriminatory impacts is long overdue. But the government doesn’t need to replace private credit agencies to ensure non‐traditional sources of data like rental history and utility bills are used to determine a fair credit report. Congress could just require it and give the FTC and CFPB the resource and staff to enforce the rules.
While well-intentioned, the proposal to create a public credit reporting agency is an example of a classic problem in policymaking, the misalignment between the policy problem and the policy solution. That’s a shame, because anyone who has ever dealt with the credit reporting agencies (basically everyone over the age of 18) knows the present system is rife with problems. But there are some ideas that could improve the credit reporting.
To safeguard private information, the credit reporting agencies should be required to adopt the latest and most effective anti-cyberattack protections — and be subject to fines and other penalties if they fail to do so. And if someone’s information is stolen, credit agencies should provide a free and seamless way to freeze and un-freeze their credit reports — as often as they want.
To help consumers keep tab on their credit report, Congress should enact legislation that requires the credit reporting agencies to continue the practice started during the Covid-19 pandemic — to provide free credit reports on a weekly basis.
Finally, to help reduce the discriminatory impacts of the credit ratings, Congress should enact a Community Reinvestment Act (CRA) type law for the credit reporting industry. Such a law would give the FTC and the CFPB the ability to limit the credit reporting agencies from using discriminatory data and to add non-traditional sources of information. The law would also would require the FTC and the CFPB to issue an annual report tracking the efforts of credit reporting agencies to reduce the discriminatory impacts.
America’s credit reporting system needs fixing. But success means we need to put in place the right policies. If we don’t, we will have missed a historic opportunity to protect consumer information, reduce errors, and eliminate discrimination in credit reporting.
Paul Weinstein Jr. is a PPI Senior Fellow and Director of the MA in Public Management at Johns Hopkins University.
[1] “Equifax Data Breach Settlement,” Federal Trade Commission, January, 2020.
[2] Michelle Black, “Millions of Americans have errors on their credit reports — do you?” bankrate.com, May 13, 2019
[3] Kelly Holland, “45 million Americans are living without a credit score,” CNBC, May 5, 2015
Join the National League of Cities as they launch the first report in a three-year initiative on the Future of Cities, with a panel featuring PPI’s Dr. Michael Mandel.
Retail – both online and brick and mortar – forms the foundation for local economies, our workforce and community main streets across the country. COVID-19 has dramatically accelerated disruptions and innovations across most industries with retail experiencing more significant shifts than ever before. To ensure their communities are best positioned for the future, city leaders are focusing on how land use, planning and zoning; economic opportunity and jobs; and emerging technology can support their retail sector.
Panel:
Dr. Michael Mandel, Chief Economic Strategist at PPI
More to come
The large tech and ecommerce companies have become massive job generating and income creating machines, hiring hundreds of thousands of workers in the United States. This is one of the great hiring surges in history, providing well-paying jobs for an unprecedented number of workers.
But just looking at hiring by the tech giants themselves does not fully answer the question of their impact on the labor market. It could be that, like tall trees, they block the sunlight and keep other tech companies and ecommerce companies stunted.
This “ecosystem dominance” would manifest as weak job and income growth in the tech-ecommerce sector as a whole. If true, this harm to workers becomes a powerful justification for strong regulatory and antitrust growth against the tech giants. In other words, chopping down the trees would help the rest of the forest grow.
Alternatively, strong job and income growth across all tech and ecommerce industries would show the tech giants–who invested a stunning $65 billion in the United States in 2020—are playing a crucial role in a thriving ecosystem that benefits workers, raises wages and generates tax revenues. Indeed, from 2015 to 2020—a period that includes the pandemic—the tech-ecommerce ecosystem generated 1.7 million net new jobs and added $289 billion in labor income. By comparison, the whole private sector lost 360,000 jobs. In that case, common sense would call for regulatory prudence. As the saying goes “if it ain’t broke, don’t fix it.”
California
For this blog post we will focus on the job, income, and tax impact of the tech-ecommerce sector on California, which is the headquarters of three out of the four tech giants. In addition, in the fourth quarter of 2020, Amazon employed more workers in California (153,000+) than it does in Washington (80,000+).
Our analysis builds on PPI’s April 2021 paper, “Innovative Job Growth in the 21st Century: Has the Tech-Ecommerce Ecosystem Become the New Manufacturing?”. The tech-ecommerce ecosystem includes five tech industries and three ecommerce industries. The tech industries are computer and electronic production manufacturing (NAICS 334); software publishing (NAICS 5112); data processing and hosting (NAICS 518); Internet publishing and search, and other information services (NAICS 519); and computer systems design and programming (NAICS 5415). The three ecommerce industries are electronic shopping and mail order houses (NAICS 4541); local delivery (NAICS 492); and ecommerce fulfillment and warehousing (NAICS 493).
We draw on Bureau of Labor Statistics data from the Quarterly Census of Employment and Wages (QCEW). This dataset reports on all wages, salaries, and bonuses, including ordinary income from exercised stock options. We look at the five-year period from 2015 to 2020, which includes the pandemic year.
Table 1. Strong Job and Labor Income Growth in California’s Tech-Ecommerce Sector
Percentage change, 2015-2020
Tech-ecommerce sector
California
Core tech counties*
Rest of California
United States
Jobs
38%
30%
43%
31%
Total wage and salary income**
76%
77%
74%
56%
*San Francisco, San Mateo, Santa Clara
**Includes exercised stock options
Data: BLS QCEW
Table 1 shows the growth of jobs and labor income in California’s tech-ecommerce sector from 2015 to 2020. Tech-ecommerce jobs rose by 38% over the five-year stretch in California, compared to 31% in the United States as a whole. Meanwhile, private sector jobs rose by 0.3% in California and fell by 0.3% nationally (not shown on table).
Wages and salaries in California’s tech-ecommerce sector rose by an astounding 76% from 2015-2020, compared to 56% nationally. Meanwhile, private sector wages and salaries rose by 31% in California, and 21% nationally.
Table 2 shows the importance of the tech-ecommerce sector for California’s economy. The tech-ecommerce sector added 350,000 jobs between 2015-2020 in the state, and $100 billion in additional wage and salary income. That means the tech-ecommerce sector accounted for 38% of the entire increase in private sector wages in the state over that period.
Table 2. Tech-Ecommerce Sector Powers California Income Growth
Tech-ecommerce sector
California
Core tech counties
Rest of California
United States
Increase in jobs, 2015-2020 (thousands)
350
113
237
1738
Increase in wage income, 2015-2020 (billions of dollars)
$100
$62
$37
$289
Share of private sector wages, 2020 (percent)
21%
45%
11%
11%
Share of private sector wage growth, 2015-2020 (percent)
38%
56%
25%
22%
*San Francisco, San Mateo, Santa Clara
**Includes exercised stock options
Data: BLS QCEW
Note that Table 1 and Table 2 break out the core tech counties, San Francisco, San Mateo, and Santa Clara, from the rest of the state. Taken together, the two tables show that both the core tech counties and the rest of the state have shown roughly equal rates of income growth from the tech-ecommerce sector.
Table 3 looks specifically at ecommerce and retail jobs in California. Obviously, the pandemic forced a dramatic decline of brick-and-mortar retail jobs in the state. At the same time, the number of ecommerce jobs increased by more than enough to counteract the decline of brick-and-mortar retail. Moreover, the ecommerce jobs were substantially better paid on average.
As a result, when we combine brick-and-mortar retail with ecommerce industries in California, the number of net jobs rose by 28,000. Average annual pay rose by 22 percent.
Table 3. California’s Ecommerce Industries Create Net New Jobs and Boost Average Pay
Brick-and mortar retail
Thousands of jobs
Average annual pay
2015
1611
33229
2020
1475
40199
Change, 2015-2020
-136
Ecommerce industries
2015
207
54078
2020
372
55882
Change, 2015-2020
164
Brick-and-mortar retail plus ecommerce
2015
1819
35608
2020
1847
43360
Change, 2015-2020
28
Data: BLS QCEW
Finally, we turn to the question of the impact of the tech-ecommerce sector on personal income taxes in California. Tax collections have come in much stronger than expected, with personal income tax collections in the first nine months of the 2020-21 fiscal year running at 17% or $14 billion above forecast. Personal income tax revenues in the 2020-21 fiscal year are now forecast to be 54% about 2015-2016 levels.
How much of that gain is accounted for by the tech-ecommerce sector? There are several issues with making this calculation. The state government reports and forecasts tax revenue data on a fiscal year basis, while our data on the tech-ecommerce sector is on a calendar year basis and stops with 2020. Second, our definition of the tech-ecommerce sector includes a wide variety of industries, with average annual pay that runs from roughly $50,000 to well over $300,000. Third, much of the surge in personal tax revenues is coming from capital gains, which is directly connected with the success of the tech-ecommerce sector but is not reported in the BLS QCEW data.
Nevertheless, we can make a back-of-the-envelope estimate of the personal tax revenue generated by the tech-ecommerce sector. First, let’s start by looking the increases in personal tax revenues coming from wage and salary income (included ordinary income from exercised stock options) over the 2015-2020 period. By our estimate, the increase in tech-ecommerce wages and salaries accounts for roughly 37% of the increase in personal tax revenues from wages and salaries in the 2015-2020 period.
But of course, there has been a surge in capital gains revenues as well. If we attribute half the unanticipated increase in capital gains in 2020 to the tech-ecommerce sector, then tech-ecommerce accounts for roughly 42% of the increase in California personal tax revenues from 2015 to 2020. This should be viewed as a rough estimate rather than a final number.
On Wednesday, the House Judiciary Committee is going to mark up five tech antitrust bills. Collectively, the bills mark a major departure from the traditional consumer welfare standard that has governed antitrust law over the last few decades. Instead of focusing on consumers, these new laws would single out just five large tech platforms and apply an entirely different set of standards. One bill would effectively ban them from making any future acquisitions, which might have the unintended consequence of reducing startup investment, and therefore reducing competition. Most concerningly, another one of the bills would lead to breakups of all five major tech companies. Vertical integration would effectively be prohibited because, according to the bill’s authors, it presents an irreconcilable conflict of interest.
But what this framing misses is all the consumer benefits that flow from integrated ecosystems. Many digital products are free to access because they are subsidized by ads elsewhere in the ecosystem. A hallmark of a seamless user experience is being able to switch between devices, websites, and apps without needing to re-enter all your information. Crucially, these integrated experiences are also safer for users because fewer players in the market have direct access to user data (which is why most government agencies do not allow federal employees to “jailbreak” their smartphone devices or sideload apps from unapproved app stores). And of course, private label goods on Amazon work just the same as they do in Walmart or CVS — they offer consumers similar quality to name brands at lower prices.
Here’s a more detailed breakdown of the five bills and what they would do to tech platforms (in order from most reasonable to least reasonable):
The budgets for the FTC and DOJ to conduct antitrust enforcement have fallen by 18% between 2010 and 2019, after adjusting for inflation. Over the same period of time, the economy has grown by 22%. To properly enforce the antitrust laws on the books, the DOJ and FTC need resources that match the scope of the problems they face. This bill would increase their enforcement resources by almost 30% and change the merger filing fee structure to fall more heavily on larger deals. There is significant bipartisan support for this bill and it is urgently needed.
For the next four bills, you need to understand what a “covered platform” is. All four bills define them the same way (and these new rules would only apply to covered platforms). A covered platform is a “website, online or mobile application operating system, digital assistant, or online service” that meets all three of the following conditions: (1) 50 million U.S.-based monthly active users or 100,000 U.S.-based monthly active business users; (2) greater than $600 billion in net annual sales or market capitalization; and (3) is a “critical trading partner” that can restrict business users access to customers.
As of today, there are only six companies in the U.S. that meet the $600 billion market capitalization threshold. Every commentator assumes Amazon, Apple, Facebook, and Google will qualify as covered platforms, and most agree that Microsoft will be included as well, considering it operates multiple large-scale platforms, such as Windows, Office, Xbox, and LinkedIn. It remains to be seen whether the “net annual sales” metric will be interpreted to cover financial services companies like Visa, JP Morgan Chase, and PayPal, which process a large volume of payments.
What seems clear, however, is that the subcommittee bills target big tech firms instead of probing economic concentration across the U.S. economy.
The ACCESS Act would require platforms to provide third parties with APIs, software that allows access to platform data. The bill leaves the definition of “data” up to the FTC to determine. Data portability done right can lower switching costs and improve competition in an industry. Consider the enormous success of telephone number portability in the telecom industry. Letting consumers own their telephone number lowers the cost of moving to a new provider. And because telephone numbers are a necessary and discrete piece of data that all carriers must use to operate a network, there was no risk of decreasing the incentive to invest in creating this data.
For tech platforms, there might be similar discrete, static, and critical data sets that should be subject to mandatory portability rules. For example, the social graph — the list of all your friends or connections on a social network — is a very important dataset for new startups to have access to. Users are more likely to use a new app if during the onboarding process they are able to share a social graph from another social network and find all their friends on the new platform with a single click.
However, the problem with this bill is that it is not narrowly tailored to discrete and critical data sets like the social graph. It merely says that “a covered platform shall maintain a set of transparent, third-party-accessible interfaces (including application programing interfaces) to enable the secure transfer of data to a user, or with the affirmative consent of a user, to a business user at the direction of a user, in a structured, commonly used, and machine-readable format.” The bill leaves it to the FTC to define what “data” means for the purpose of the bill. It would be very helpful if Congress offered more guidance on what kinds of data it intends to be covered by these rules.
If data is defined too broadly, then there might be unintended consequences for investment incentives. For example, tech companies are all racing to build the next great computing paradigm. Will it be virtual reality? Blockchain technology? Augmented reality? Smart devices? Or something else no one can predict? Regardless of which paradigm wins out, if the future winner is forced to give every one of its competitors access to all of its data, then that would decrease the incentive to invest in the next big platform today. The most tragic part of the scenario is that these will be unseen costs — we won’t know what we lost out on. The future will just be somewhat dimmer because a well intentioned policy backfired due to poor drafting and a rushed process.
The Platform Competition and Opportunity Act is effectively a ban on all mergers and acquisitions by platform companies. This bill would ban platforms from acquiring companies that:
“compete with the covered platform … for the sale … of any product or service”;
“constitute nascent or potential competition to the covered platform … for the sale … of any product or service”;
“increase the covered platform’s … market position”; or
“increase the covered platform’s … ability to maintain its market position”
Given how broad this language is, the bill would effectively ban all acquisitions by platform companies. Since more than 90% of startups provide a return for their founders, employees, and investors through an acquisition as opposed to going public, this bill has the potential to backfire and decrease investment in startups. A recent study found that “VC activity intensifies after enactment of country-level takeover friendly legislation and decreases following passage of state antitakeover laws in the U.S.” This bill would qualify as an antitakeover law.
This bill is aimed at remedying the perceived conflict of interest by platforms and businesses that leverage those platforms to reach consumers. In essence, this bill bans self-preferencing by requiring platform owners to refrain from any conduct that gives their own products an advantage over competitors’ products. Section 2 of the bill makes it clear how all encompassing this rule aims to be (emphasis added):
“It shall be unlawful for … a covered platform … to engage in any conduct that … advantages [its] own products, services, or lines of business over those of any other business user, excludes or disadvantages the products, services, or lines of business of another business user relative to the covered platform operator’s own products, services, or lines of business, or discriminates among similarly situated business users.
The bill then provides 10 examples of discriminatory conduct, including tying, anti-steering provisions, retaliation, and restrictions on pricing.
But those specific examples aren’t really necessary when the bill includes a blanket ban on any conduct that “advantages” the platform’s products over those of third parties. While this attempt to fix a conflict of interest may seem intuitive at first glance (think of Elizabeth’s Warren’s baseball analogy), the more you think about the idea, the less it makes sense. For example, consider how this rule would apply to Apple. The iPhone runs on Apple’s proprietary iOS operating system. Apple wouldn’t be allowed to “advantage” its App Store in any way, which means it can’t be pre-loaded on devices and it can’t be the default app store unless users select it. This same logic applies to every layer of the tech stack. Apple makes dozens of popular first-party apps, including FaceTime, iMessage, Mail, and Music. As the bill is currently written, Apple would not be allowed to pre-install those apps on iPhone devices because that would “advantage” them over other video conferencing, messaging, mail, and music apps.
Now consider how this law would apply to Google. If a user typed in “restaurants near me” on Google, the search engine wouldn’t be able to directly offer map results at the top of the page from Google Maps because that would give it an “advantage” over other mapping services. Google would be forced to merely provide links to competitive mapping services rather than give consumers the answer to their question. The same rule would apply to Google Shopping if a user searched for sneakers. Instead of showing the user sneakers, Google would have to show users links to shopping websites that sell sneakers. This would represent a huge loss to consumer convenience that makes these products so popular (91% of Americans have a favorable opinion of Amazon, 90% have a favorable opinion of Google, and 81% have a favorable opinion of Apple).
Most concerningly, this bill would break the safety and security of many features of the iPhone. If Apple has access to a piece of hardware, such as a sensor or communications chip, then it has to give equal and fair access to that same hardware function to all third parties. That sounds like a laudable goal if you want more options when it comes to payments (i.e., access to the NFC chip) or location services (i.e., access to GPS) or the microphone (e.g., the way say Siri is always listening for “Hey, Siri”). But the flip side of more competition in this context is that every bad actor with the intent to defraud consumers or invade their privacy now also has access to sensitive data by law.
Lastly, some argue that the affirmative defense section of this bill would allow some pro-consumer conduct by the platforms to continue (such as continuing to pre-install apps on phones). The platforms can “advantage” their own products so long as they “would not result in harm to the competitive process by restricting or impeding legitimate activity by business users; or was narrowly tailored, could not be achieved through less discriminatory means, was nonpretextual, and was necessary to prevent a violation of, or comply with, Federal or State law; or protect user privacy or other non-public data.” But pre-installation and default settings clearly give a leg up to the products controlled by the platform owner and therefore might “result in harm to the competitive process.” If the intent of the drafters is not to ban this type of conduct, they should clarify this section.
The most extreme and economically destructive of the five bills is The Ending Platform Monopolies Act. It tries to address the same problem as the American Innovation and Choice Online Act — conflicts of interest between platform owners and platform competitors. But instead of requiring platform owners to operate their platforms in a neutral fashion as the non-discrimination bill does, this bill bans vertical integration outright and would lead to the break up of every large tech company across multiple dimensions.
Google would have to spin off YouTube, Android, Chrome, the Play Store, and its apps (Gmail, Google Maps, Drive, etc.) into separate businesses. Of course, that would destroy Google’s current business model where revenue from search and display advertising is used to subsidize an ecosystem of free products for consumers. Post-breakup, the newly independent entities would likely need to start charging subscription fees or create their own advertising business from scratch (and add more ad units to their respective products).
Amazon would be forced to spin off its private label goods business (e.g., Amazon Basics) and Amazon Marketplace because those two lines of business compete with the traditional retailing model where Amazon takes inventory of the product from wholesalers and then resells it at a markup. Amazon would also be forced to spin off its Amazon Prime Video streaming service and Amazon Web Services.
It has not yet been properly appreciated that this bill is aimed at addressing the same alleged conflict of interest issue as the American Choice and Innovation Online Act. If they are passed together, this bill would obviate the other one. As independent technology analyst Ben Thompson pointed out, this could mean that Chairman David Cicilline is attempting to make his bill seem reasonable by comparison even though it also has radical implications for tech ecosystems. Legislators shouldn’t fall for this obvious gambit.
The DOJ and FTC desperately need more resources to adequately enforce the antitrust laws on the books, and a narrowly tailored data portability mandate could enhance digital platform competition. But blanket bans on acquisitions, self-preferencing, and vertical integration would destroy many of the consumer benefits that make the tech giants world leaders in their respective markets. Hobbling America’s tech giants without adequate evidence of consumer harm would be a capitulation to the populists on the far left and far right at a time when we need to be focused on economic recovery.
Tomorrow morning, the House Judiciary Committee will mark up a series of antitrust bills that, taken together, would stifle digital innovation and hinder the United States in economic competition with China.
Alec Stapp, Director of Technology Policy at the Progressive Policy Institute (PPI) released the following statement:
“Economic concentration in many sectors of the U.S. economy is a serious issue that demands scrutiny and creative responses from lawmakers. Unfortunately these five bills fail to grapple responsibly with this challenge. Instead, they single out a handful of America’s most innovative and globally competitive tech companies for divestiture and draconian regulation. These bills would be a major blow to job creation and innovation even as our economy struggles to recover from the pandemic recession.
“We hope the Members of the House Judiciary Committee will stand up for American workers, consumers and entrepreneurs by refusing to join in an ideological crusade to dismantle “big tech.” While well-tailored regulation is certainly worth debating, the extreme provisions written into these bills would do more harm than good, and set us back in our fight against foreign dominance in the tech/e-commerce industry.”
Earlier this year, PPI released a new report on job growth in the tech/e-commerce sector, which found that this sector is now the top job creator in the U.S. economy. The sector generated more than 1.2 million net new jobs from 2016 to 2020, including during the pandemic. On average, pay in the tech/e-commerce ecosystem was 44% higher than average pay in the private sector and 21% higher than average pay in manufacturing nationally. The report also found that the growth of tech/e-commerce jobs has expanded beyond the coasts and regions known as tech innovation hot spots, including growth during the pandemic in Arizona, Ohio, Texas, Indiana, and Florida.
On this week’s Radically Pragmatic Podcast, Crystal Swann, Senior Policy Fellow at the Progressive Policy Institute and Mosaic Economic Project lead, and Francella Ochillo, a Mosaic Economic Project Cohort Member, attorney and digital rights advocate, sit down with Representative Sharice Davids, D-Ks., to discuss the impact of the coronavirus on women business owners, entrepreneurs and workers.
“It’s been disheartening – although I don’t know that I would call it super surprising – to see that the pandemic and the impacts of a public health crisis, that has turned into also an economic crisis, has disproportionately impacted women…financially, in the workforce when it comes to child care, access to health care…Every single aspect of life has been disrupted by the pandemic.
“Particularly Black women and other women of color have been disproportionately negatively impacted. It’s something that – at least in the Democratic Caucus in Congress – we started talking about almost immediately. Because like I said, it’s disheartening and heartbreaking but it’s also not as surprising. And that’s because a lot of us know the negative impacts and disproportionate impacts that women experience anyway,” said Rep. Davids on the podcast.
Congresswoman Davids serves as a Vice Chair of the Committee on Transportation and Infrastructure, and also serves on the Small Business, Joint Economic, and the Steering and Policy Committees. Additionally, she is the New Democrat Coalition’s Member Services Vice Chair. She is currently serving in her second term of Congress.
In addition to the economic impact of the pandemic on communities of color and women, Rep. Davids and the hosts discuss the ongoing negotiations over the upcoming infrastructure legislative packages — the American Jobs Plan and the American Families Plan. They also dive into Rep. Davids’ background as a professional mixed martial arts (MMA) fighter.
This podcast was in partnership with PPI’s Mosaic Economic Project. The Mosaic Economic Project is a network of diverse and highly credentialed women in fields of economics and technology. Mosaic programming focuses on upskilling, connecting, and advocating for cohort participants’ meaningful engagement in public policy debates, with a particular focus on engaging Congress and the media.
The Progressive Policy Institute (PPI) is a catalyst for policy innovation and political reform based in Washington, D.C. Its mission is to create radically pragmatic ideas for moving America beyond ideological and partisan deadlock. Learn more about PPI by visiting progressivepolicy.org.
New legislative package would be a devastating blow to American technological leadership
Today, Members of the House of Representatives introduced a new package of bills aimed at stifling digital innovation through extreme antitrust legislation.
Alec Stapp, Director of Technology Policy at the Progressive Policy Institute (PPI) released the following statement:
“The package of bills proposed by Members of the Judiciary Committee would be a devastating blow to American technological leadership at a time when that leadership is more necessary — and more at risk — than ever. While the current system isn’t perfect — the FTC and DOJ urgently need more resources, for example — our antitrust institutions are part of the overall pro-innovation ecosystem that has enabled the United States to produce technology companies that are the envy of the world. These companies create good jobs for American workers — both directly and indirectly — as well as provide innovative products for consumers around the world.
“It makes no sense to apply a drastically different set of rules to a small handful of companies without clear evidence of consumer harms, and a compelling story for how these new rules would remedy those harms. On the contrary, radical measures such as line of business restrictions and bans on self-preferencing would destroy many of the integrated products consumers currently enjoy.
“Apple would no longer be allowed to make its own apps (the iPhone would arrive out of the box with an empty home screen). Google would no longer be allowed to offer Google Maps on Android devices or use it to show map results in search. Amazon would no longer be allowed to offer generic goods at lower prices (just as Walmart, Costco, and every other large retailer do). It’s hard to see how these rules would benefit anyone other than the small handful of competitors that have been trying to use regulation to kneecap America’s most successful companies.
“Lastly, the bill related to mergers is written so broadly that it would effectively ban all future acquisitions by large tech companies. This might have the unintended consequence of decreasing investment in startups because acquisitions are by far the most common way that founders, investors, and employees earn a return on their equity. Reforms are certainly necessary, especially on issues related to privacy, misinformation, and election interference, but these bills would do nothing to address those concerns and would cause more harm in the process.”
The Progressive Policy Institute (PPI) is a catalyst for policy innovation and political reform based in Washington, D.C. Its mission is to create radically pragmatic ideas for moving America beyond ideological and partisan deadlock. Learn more about PPI by visiting progressivepolicy.org.
While other companies cut back on spending as the coronavirus pandemic took hold last year, e-commerce giant Amazon boosted its domestic capital investments by 75% to nearly $34 billion—and helped set the stage for a robust economic recovery, according to a new report from the Progressive Policy Institute.
KEY FACTS
Capital investment by Amazon and its peers in the e-commerce, broadband and tech industries helps spur job creation, boosts production and distribution capacity and combats inflation by shoring up supply, the report’s authors argue.
In Amazon’s case, the extra investment on property and equipment last year was driven by the need to meet an enormous surge of demand during the pandemic, the report notes.
Those investments put the firm in PPI’s top slot on its list of “Investment Heroes.”
Verizon was second on PPI’s list with $16.1 billion in domestic capital investment last year, AT&T was third on the list with $15.6 billion invested, and Alphabet and Intel rounded out the top five with $14 billion and $12.5 billion invested, respectively.
BIG NUMBER
500,000. That’s how many workers Amazon added in 2020, according to the report.
CRUCIAL QUOTE
“The willingness of these companies to keep spending essentially made it possible for large chunks of the economy to move forward, despite the pandemic,” the report states.
KEY BACKGROUND
Despite its major investments in the U.S. economy last year, Amazon’s business practices have also been the target of criticism. The firm was recently sued by the attorney general of the District of Columbia over allegations that it engaged in anticompetitive practices that “have raised prices for consumers and stifled innovation and choice across the entire online retail market.” Rep. David Cicilline (D-R.I.) said Amazon’s recent purchase of film studio MGM is a sign that the company is “laser-focused on expanding and entrenching their monopoly power.” And that’s not to mention criticism over the way the company handled safety protocols for workers and drivers during the pandemic.
Amazon’s $34 Billion Makes It an ‘Investment Hero,’ Study Says
The e-commerce giant was far and away the leader in U.S. capital spending in 2020, according to a Progressive Policy Institute analysis.
By Peter Coy
Democratic and Republican politicians alike are dumping on Amazon.com Inc. over its ceaseless expansion—marked most recently by its agreement to buy the movie studio with the roaring lion logo, Metro-Goldwyn-Mayer. Representative David Cicilline, a Rhode Island Democrat, says “they are laser-focused on expanding and entrenching their monopoly power,” while Senator Josh Hawley, a Missouri Republican, tweets that Amazon “shouldn’t be able to buy anything else. Period.”
But not everybody is mad at Amazon. A new study from the Progressive Policy Institute, which was founded in 1989 as a centrist Democratic think tank and promises “radically pragmatic thinking,” calls Amazon its No. 1 “investment hero.” It estimates that Amazon boosted its U.S. capital spending by 75% in 2020, to $33.8 billion, from the year earlier, which was more than twice that of any other company.
The study names 25 investment heroes based on their U.S. capital spending. The rest of the top five for 2020 are Verizon Communications, $16.1 billion; AT&T, $15.6 billion; Google’s parent Alphabet, $14 billion; and Intel, $12.5 billion.
“The willingness of these companies to keep spending essentially made it possible for large chunks of the economy to move forward despite the pandemic,” says the report. “Investment by broadband and tech companies kept people connected at home during the shock of the lockdown; and the investment by e-commerce firms helped keep essential goods flowing while many Americans could not go out shopping.”
The report is by Michael Mandel, the institute’s chief economic strategist, and Elliott Long, a senior economic policy analyst. Mandel was chief economist of BusinessWeek, the predecessor to Bloomberg Businessweek (making him my former boss). He is also a senior fellow at the Mack Institute for Innovation Management of the Wharton School at the University of Pennsylvania.
Critics of Amazon say it costs jobs by putting smaller retailers out of business. But in an email exchange, Mandel wrote that “the number of workers added by e-commerce exceeds jobs lost by brick and mortar.” The main reason, he wrote, is that e-commerce customers are creating jobs for drivers, warehouse workers, and others, who are freeing them from having to shop in person. “Investment in e-commerce is job-creating because it replaces unpaid household shopping hours, which have fallen dramatically,” Mandel wrote.
This is the 10th annual edition of the investment heroes report by the Progressive Policy Institute. It’s based on gross investment—i.e., before accounting for the effects of depreciation. The numbers come from company reports. The authors made estimates when the companies didn’t break out U.S. investment separately. Most financial companies, excluding health insurance companies, were excluded. For Amazon, which relies heavily on finance leases, the report included principal repayment on those leases as a form of investment.
The report takes a shot at critics in the camp of Cicilline and Hawley, without naming names. “It seems odd that Congress seems more interested in sharply questioning companies that are investing heavily in America, rather than those that have reduced investment or actually disinvested in this country,” it says.
The Progressive Policy Institute gets general funding from some of the companies on the heroes list, Mandel wrote in an email. But he says “the methodology only uses publicly available data and a consistent procedure that can be replicated.”
The MGM deal was announced after the report was completed. (Acquisitions don’t count toward companies’ capital spending numbers in the report.) In an email, Mandel wrote, “This deal potentially increases the level of competition in the growing market for streaming content. The key is to watch Amazon’s investment behavior. If Amazon invests in producing more content based on MGM intellectual property, as seems likely, that means lower prices for consumers and more content production jobs.”
In announcing the deal on May 26, the company stated, “Amazon will help preserve MGM’s heritage and catalog of films, and provide customers with greater access to these existing works.” Amazon didn’t immediately respond to a request for comment on this story.
The PPI report is lukewarm on President Joe Biden’s American Jobs Plan. The authors praise its provisions for investment in infrastructure, research and development, and manufacturing. But they write that the corporate income tax increases in the plan “could discourage business investment at a time when capital spending is already weak.”
Not every economist agrees with that. Thomas Philippon, a finance professor at New York University’s Stern School of Business, argues that for many companies, a higher tax on their profits would not induce them to decrease investment significantly because a substantial share of their profits are “excess”—meaning they’re above what companies require to justify investment for growth. (Excess profits, an economic concept rather than an accounting one, are generated by companies with monopolies or near-monopolies in their market sectors.)
Mandel wrote, “The weight of the evidence shows that corporate tax rates adversely affect investment.”
In 2020 U.S. businesses cut back domestic capital investment by seven percent, in response to the Covid-19 pandemic, lockdowns and recession. The decline was broad-based, from transportation equipment to industrial equipment to energy investment.
But amidst this slowdown, Amazon boosted its domestic capital expenditures by 75 percent in 2020, according to new estimates by the Progressive Policy Institute (PPI). The ecommerce giant invested a stunning $33.8 billion in the United States last year, a record for the 10 years that PPI has been doing the Investment Heroes report.
Amazon’s capital investment performance illustrates just how critical the tech-broadband- ecommerce sector has been to keeping people working and propping up the economy. The second company on our list, Verizon, invested $16.1 billion in the U.S. in 2020, AT&T $15.6 billion, Alphabet $14 billion, and Intel $12.5 billion. Eight out of the top 10 companies in our list—Amazon, Verizon, AT&T, Alphabet, Intel, Facebook, Microsoft and Comcast—are in the tech, ecommerce, and broadband sectors.
The willingness of these companies to keep spending essentially made it possible for large chunks of the economy to move forward despite the pandemic.
Capital investment is critical because it enables the creation of high-productivity, well-paying jobs. Collectively the top 10 companies in the Investment Heroes list added 483,000 jobs in 2020, led by Amazon’s dramatic leap from 798,000 workers in 2019 to 1,298,000 workers in 2020. Just looking domestically, the industries represented by the top 10 Investment Heroes added 234,000 jobs between the start of the pandemic in February 2020 and April 2021, while the rest of the private sector lost more than 6 million jobs.1
Capital investment is also essential for creating more production, communications and distribution capacity. This was essential during the pandemic, when investment by broadband and tech companies kept people connected at home during the shock of the lockdown; and the investment by ecommerce firms helped keep essential goods flowing while many Americans could not go out shopping.
As the Broadband Internet Technical Advisory Group wrote in an April 2021 report, “available data suggests that the Internet has performed well during the pandemic…. and is a testament to the importance of continued investment in robust Internet infrastructure in all parts of the ecosystem.”2 The report went on to note that “ISPs reacted to the sudden demand increase by rapidly adding extraordinary amounts of new capacity and pledging to Keep Americans Connected.”
Capital investment also helps hold down prices by creating more supply—and the lack of investment creates the conditions for overall price inflation. Prices in the tech-broadband-ecommerce sector were mostly flat or down in 2020, as investments in new capacity helped meet soaring demand. For example, the surge of new broadband capacity meant that the price of telecommunications services to consumers fell by 2 percent in 2020, and the price of Internet access fell by 1 percent, according to data from the Bureau of Economic Analysis.
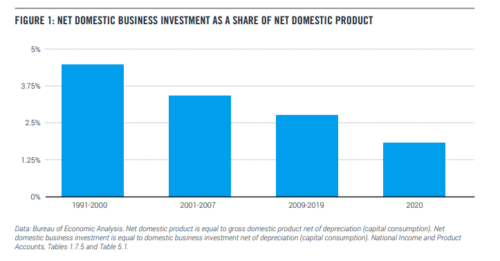
Similarly, one big reason for the recent return of inflation in 2021 has been production and supply bottlenecks caused by a lack of investment during 2020. Net domestic business investment totaled an anemic 1.9 percent of net domestic product in 2020.3 To put this in perspective, that was a sharp fall-off from 2.8 percent, which was net domestic business investment’s average share of net domestic product from 2008 to 2019. And that in turn was down from the business cycles running from 1991 to 2000 and 2001 to 2007, when net domestic business investment’s share of net domestic product averaged 4.5 and 3.5 percent, respectively (Figure 1).
THE REPORT
Which companies are fighting this downward trend? Since 2012 PPI has provided unique estimates of domestic capital spending for individual major U.S. companies. Currently, accounting rules do not require companies to report their U.S. capital spending separately. To fill this gap in the data, we created a methodology using publicly-available financial statements from non-financial Fortune 150 companies to identify the top companies that were investing in the United States.
We call these companies “Investment Heroes” because their capital spending is helping create good jobs and boost capacity across the country. In 2020, the 25 companies on our list invested $216 billion in the U.S. This year’s list includes 11 tech, broadband and ecommerce companies; six energy production and distribution companies; three transportation companies; two automotive companies; two retail companies; and one entertainment company.
In terms of government policy, U.S. regulators and policymakers have an ambivalent attitude towards corporate capital investment. On the one hand, companies that don’t invest are decried as suffering from “short-termism,” being more concerned about current profits than long-term growth.4
On the other hand, the tech, broadband, and ecommerce companies that do make long- term investments in American workers and the American economy are often accused of unfair competition and monopolistic business practices, precisely because of their large capital expenditures. It seems odd that Congress seems more interested in sharply questioning companies that are investing heavily in America, rather than those that have reduced investment or actually disinvested in this country.
President Biden’s American Jobs Plan shows the same ambivalence towards business investment leaders. The plan would spend $2 trillion over the next decade on infrastructure, research and development, and manufacturing among other public investments.5 The avowed goal is to stimulate productivity-enhancing investments in the U.S., which is a goal that PPI favors.
On the other hand, the plan would pay for these proposals by raising the federal corporate income tax rate from 21 to 28 percent and imposing a 21 percent minimum tax on overseas corporate profits among other tax changes. While the package would generate $2.1 trillion over a decade, these tax increases could discourage business investment at a time when capital spending is already weak.
U.S. INVESTMENT HEROES: THE 2020 LIST
Using the methodology described in the appendix, we estimate domestic capital spending for large U.S. non-financial companies based on publicly available data. We then rank the companies to give us the top 25 Investment Heroes.
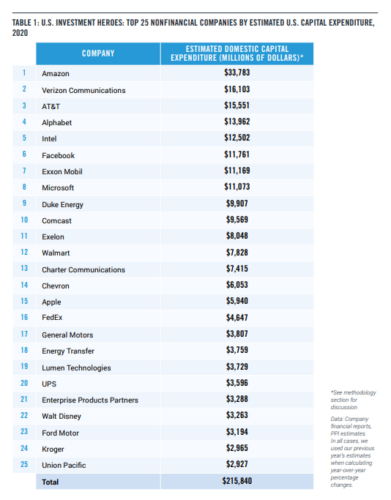
The top 25 Investment Heroes invested $216 billion in the U.S. in 2020, according to our estimates (which are based on companies’ most recent fiscal year through January 31, 2021). That’s a decrease of 11 percent compared to last year. 18 of our 25 Investment Heroes posted a decrease in U.S. capital expenditures relative to our 2019 estimates, with an average decline of 21 percent.
Amazon by far leads our Investment Heroes this year, spending an estimated $33.8 billion on domestic capital expenditures in 2020. Second is Verizon Communications, investing an estimated $16.1 billion on capital expenditures in the U.S. on the basis of increased broadband spending. AT&T came in third, spending an estimated $15.6 billion on domestic capital expenditures. Alphabet and Intel are fourth and fifth, respectively, investing $14 billion and $12.5 billion.
Four “newcomers” made our list this year. We estimate that Lumen Technologies (formerly CenturyLink) spent $3.7 billion on U.S. capital expenditures in 2020, a three percent increase compared to our estimates for CenturyLink’s 2019 domestic capital spending. Disney returns to the top 25 this year for the first time since our 2013 report. Kroger makes our list this year, investing an estimated $3 billion on domestic capital expenditures in 2020. And Union Pacific cracks the top 25 after making our non-energy list the last two years.
Four companies from our 2019 list didn’t make our 2020 list. Southern Company fell out of the Fortune 150 and thus out of the purview of our analysis. Marathon Petroleum cut its U.S. capital expenditures by more than $2 billion in 2020 compared to 2019 by our estimates. Delta Air Lines decreased its domestic capital expenditures by more than 60 percent according to our estimates as fears of Covid ravaged the travel industry. And ConocoPhillips missed our top 25 list by $8 million.
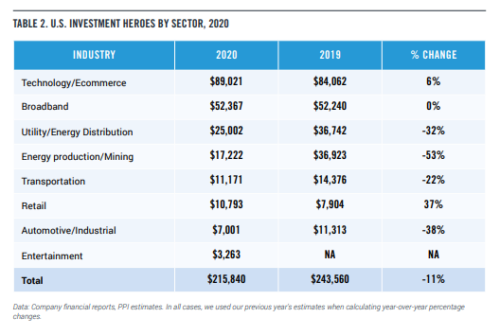
At the sector-level, our 11 tech, broadband and ecommerce companies invested an estimated $141.4 billion in domestic capital expenditures (Table 2). This category comprises six tech and ecommerce companies (Amazon, Alphabet, Intel, Facebook, Microsoft, and Apple) and five broadband companies (Verizon Communications, AT&T, Comcast, Charter Communications, and “newcomer” Lumen Technologies).
The next category includes six energy production and distribution companies, with total estimated domestic capital expenditures of $42.2 billion. This category is made up of Exxon Mobil, Chevron, Duke Energy, Exelon, Energy Transfer, and Enterprise Product Partners.
Coming in third is transportation, spending a total of $11.2 billion on U.S. capital expenditures by our estimates. This category consists of FedEx, UPS, and “newcomer” Union Pacific.
The retail sector, which included Walmart and “newcomer” Kroger, came in fourth. These retailers invested a combined $10.8 billion by our estimates, a 37 percent increase compared to 2019 as a result of Kroger making our list.
The last two categories were automotive and entertainment. Our automotive category was made up of General Motors and Ford Motor, investing an estimated $3.8 billion and $3.2 billion respectively. The lone entertainment company to make our list was Disney, investing $3.3 billion by our estimates.
COMPANIES
Next we delve deeper into each of our Investment Heroes’ capital spending.
Amazon spent an estimated $33.8 billion on U.S. capital expenditures in 2020, a 75 percent increase compared to 2019 as
the ecommerce company sought to meet increased demand from Covid protocols like social distancing and work from home. We note that Amazon turned in a historically high investment performance. The company’s global capital expenditure of $45.7 billion (the sum of purchases of property and equipment, net of proceeds from sales and incentives, plus principal repayments of finance leases) exceeds the peak capital spending by such industrial giants as General Motors, General Electric, and IBM, even after adjusting for inflation.6
Verizon Communications spent an estimated $16.1 billion on U.S. capital expenditures in 2020, up slightly relative to our 2019 estimates. Verizon continued to invest in expanding its 4G LTE network and deploying its 5G and Intelligent Edge networks, despite the pandemic.
Third was AT&T, spending an estimated $15.6 billion in 2020. AT&T continues to invest in expanding its networks.
Alphabet invested $14 billion on U.S. capital expenditures in 2020 by our estimates. “We continue to make significant R&D investments in areas of strategic focus such as advertising, cloud, machine learning, and search, as well as in new products and services. In addition, we expect to continue to invest in land and buildings for data centers and offices, and information technology assets, which includes servers and network equipment, to support the long-term growth of our business,” the company writes in its 10-K.
Coming in fifth was Intel, spending an estimated $12.5 billion on U.S. capital expenditures in 2020, a decrease of 7 percent relative to our 2019 estimates.
Facebook spent an estimated $11.8 billion on U.S. capital expenditures in 2020, a decrease of 6 percent from our 2019 estimates. The social media company continues to invest in data center capacity, servers, network infrastructure, and office facilities.
Seventh was Exxon Mobil, investing $11.2 billion on U.S. capital expenditures in 2020 by our estimates. That’s a decrease of 33 percent compared to our 2019 estimates. The energy company cut its upstream capital investment in the U.S. by nearly $5 billion in 2020 according to its 10-K.
Microsoft spent an estimated $11.1 billion on U.S. capital expenditures during the fiscal year ending June 2020, the mostrecent 10-K available. The software company continues to invest in new facilities, data centers, computer systems for research and development, and its cloud offerings. We note that this estimate has not been updated from our previous Investment Heroes report, because we moved up the timing of the report.
Duke Energy invested $9.9 billion on U.S. capital expenditures in 2020 by our estimates, a decrease of 11 percent compared to 2019. The energy company decreased capital investment in its electric utilities, gas utilities, and commercial renewables segments.
Comcast invested $9.6 billion on U.S. capital expenditures by our estimates. Comcast continued to spend on customer premise equipment, scalable infrastructure, line extensions, and support capital.
Exelon spent an estimated $8 billion on U.S. capital expenditures in 2020, an increase of 11 percent relative to our 2019 estimates. The utility company increased capital investment in every segment except Exelon Generation.
Walmart spent an estimated $7.8 billion on U.S. capital expenditures in 2020. The retailer’s capital investments were relatively flat compared to our 2019 estimates.
Charter Communications invested $7.4 billion in domestic capital expenditures in 2020, a slight increase of 3 percent compared to 2019. The broadband company spent on line extensions and support capital according to its 10-K.
Chevron spent an estimated $6.1 billion on U.S. capital expenditures in 2020. That’s a 40 percent decline compared to 2019. The energy company spent about $3 billion dollars less in its upstream segment and about $800 million less in its downstream segment in 2020 compared to 2019.
Apple invested an estimated $5.9 billion on domestic capital expenditures in 2020. Apple’s figures are based on its latest 10-K for its fiscal year ending September 2020.
FedEx invested $4.6 billion in domestic capital expenditures by our estimates. The shipping company continued to spend on aircraft, equipment, vehicles, information technology, and facilities. We note that this estimate has not been updated from our previous report, as FedEx’s fiscal year ends on May 31st and thus their FY 2021 10-K was not published at the time of this writing.
General Motors spent an estimated $3.8 billion on U.S. capital expenditures in 2020, a 22 percent decline relative to our 2019 estimates.
Energy Transfer spent an estimated $3.8 billion on U.S. capital expenditures in 2020. Energy Transfer continued to invest in natural gas transportation and storage.
Lumen Technologies, formerly known as CenturyLink, invested $3.7 billion on domestic capital expenditures in 2020
by our estimates. That’s an increase of 3 percent compared to our 2019 estimates for CenturyLink. The broadband company continued to spend on enhancing network efficiencies and supporting new service developments.
UPS invested an estimated $3.6 billion on U.S. capital expenditures in 2020. UPS continued to spend on buildings, equipment, aircraft, vehicles, and information technology.
Enterprise Product Partners spent $3.3 billion on domestic capital expenditures in 2020 by our estimates, a 27 percent decline compared to our 2019 estimates. Enterprise Product Partners continued to invest in facilities and projects to gather, transport, and store natural gas and crude oil.
Disney invested an estimated $3.3 billion on U.S. capital expenditures in 2020, a decrease of 19 percent relative to our
2019 estimates. The entertainment company decreased spending in every segment except its direct-to-consumer and corporate segments.
Ford Motor invested $3.2 billion on domestic capital expenditures in 2020 according to our estimates, a decline of 50 percent compared to our 2019 estimates.
Kroger spent an estimated $3 billion on U.S. capital expenditures, a slight decline of 5 percent compared to 2019.
Union Pacific invested an estimated $2.9 billion on U.S. capital expenditures in 2020. Union Pacific continued to invest in new locomotives and freight cars, maintenance, and safety improvements.
INVESTMENT-RELATED POLICY
President Biden has proposed the American Jobs Plan, which includes $621 billion for transportation infrastructure, $300 billion to bolster manufacturing, $180 billion for research and development, and $100 billion for broadband among other proposals.7 Each of these areas has been an important source of economic growth historically. For example, manufacturing employment peaked in 1979 at nearly 20 million but has been on the decline since, employing about 12 million people
today.8 President Biden’s plan would restore manufacturing supply chains and provide capital to revitalize manufacturing.
Similarly, R&D investment is key to commercializing new technologies and fueling growth of industries. A few key innovations that were made possible by federal R&D funding include the internet, smartphone technologies, global positioning systems, the human genome project, and hydraulic fracturing.9 Unfortunately, federally sponsored R&D has declined from its peak of 1.8 percent of GDP in 1965 to .74 percent in 2020.10, 11 The American Jobs Plan’s $180 billion investment would provide additional funding for the National Science Foundation, the development of technology to address the climate crisis, and R&D that spurs innovation and job creation.
These increases in infrastructure and other public spending are highly desirable for growth. However, the plan would pay for these proposals by raising the federal corporate income tax rate from 21 to 28 percent and imposing a 21 percent minimum tax on overseas corporate profits among other tax changes.12 While the plan would generate $2.1 trillion over a decade, policymakers should be mindful of potentially discouraging business investment, which would prolong the economic recovery. Raising the corporate income tax rate to 28 percent would create a federal-state combined corporate income tax rate of 32.8 percent, returning the U.S. to the highest combined rate in the OECD.13
We also note that policymakers often misunderstand the link between strong corporate investment and creation of good jobs. True, in some cases, companies have invested in automation that reduces employment. But more recently, we have seen that companies making the biggest capital investments, like Amazon, may also be the biggest job creators. In particular, Amazon’s spending on fulfillment center automation has boosted productivity, enabling the company to pay a minimum wage of $15 per hour that is comparable with advertised entry-level manufacturing hourly wages of $15-$17 in many parts of the country.14 Indeed, a recent PPI analysis shows that most Americans live in states where the tech-ecommerce ecosystem, including all positions and skill levels from fulfillment center and delivery workers to website designers, pays better than manufacturing.15
The bottom line: As the U.S. struggles out of recession, and faces the worries of inflation, we should be lauding companies that invest in America during the pandemic, rather than denigrating them.
APPENDIX: METHODOLOGY
Our U.S. Investment Heroes ranking for 2020 follows the same methodology as our most recent report in 2019. We started with the top 150 companies of the 2020 Fortune 500 list as our universe of companies. We removed all financial companies and all insurance companies except health insurance companies. We also omitted the financing operations of non- finance companies when possible.
Except as noted, we use the global capital expenditure reported on the most recent 10-K through January 31, 2021, as the starting point for the analysis. In this report, we refer to all estimates as “2020,” even if the fiscal year ended in 2021. Capital expenditures generally cover plant, equipment, and capitalized software costs. For energy production companies, capital expenditures can include exploration as well.
For broadband companies, we did not include their often sizable spending on purchases of wireless spectrum as part of capital expenditures, since that category is not counted as investment spending by the economists at the Bureau of Economic Analysis. Companies purchasing spectrum in 2020 include Verizon ($2.1 billion); AT&T ($1.6 billion); Comcast ($459 million); and Charter ($464 million).
The companies in these rankings are all based in the United States. Non-U.S. based companies were not included in this list because of data comparability issues, although there are many non-U.S. companies that invest in America.
For transportation companies our report estimates the booked location of spending on capital expenditures for the company’s most recent fiscal year, rather than how much of those acquired assets are actually being used within the U.S.
Most multinational companies do not provide a breakdown of capital expenditures by country in their financial reports. However, PPI has developed a methodology for estimating U.S. capital expenditures based on the information provided in the companies’ annual 10-K statements and other financial documents. After developing our internal estimate, we contact the companies on our top 25 list to ask them to point us to any additional public information that might be relevant. Notwithstanding these queries, we acknowledge that the figures in this report are estimates based on limited information.
Our estimation procedure goes as follows:
If a company has no foreign operations, we allocated all capital spending to the United States.
If a company reported U.S. capital spending separately, we used that figure.
If a company did not report U.S. capital spending separately, but did report changes in global and U.S. long-lived assets or plant and equipment, we used that information plus depreciation to estimate domestic capital spending. As appropriate, we adjust for large acquisitions.
If a company has small foreign operations that were not reported separately, we allocated capital spending proportionally to domestic versus foreign assets, revenues, or employees.Some adjustments of note:
For Amazon, the methodological issue was their extensive use of finance leases. We chose to specify global capital expenditures as purchases of property and equipment (net of proceeds from sales and incentives) plus principal repayments of finance leases. We then used reported changes in U.S. and non-U.S. property and equipment, net and operating leases to allocate global capital expenditures, taking into account depreciation and removing the effect of operating leases.
Verizon does not report long-lived assets by geographic region. As a result, we used the most recent available data for Verizon’s domestic employment as a share of global employment to allocate Verizon’s capital spending between the United States and internationally (https://www.verizon.com/ about/sites/default/files/esg-report/2019/ social/human-capital/v-team.html)
As noted in the report, our estimates for Microsoft and FedEx remain the same as our 2019 estimates because their fiscal years end June 30th and May 31st, respectively, and thus updated 10-Ks were not available at the time of this writing. For Microsoft, we used the capital expenditures data found online at https://www.microsoft.com/ en-us/Investor/earnings/trended/capital- expenditure.aspx
In the case of Comcast, we allocated all of its cable operation and corporate capital expenditures, including cash paid for intangible assets such as software, to the U.S. For NBC Universal’s capital expenditures, including cash paid for intangible assets such as software, we assumed the same domestic vs. foreign revenue share from our 2019 estimate for 2020 to allocate capital spending as Comcast did not report updated revenue information for FY 2020.
As part of our calculations for Facebook, UPS, and Kroger, we included principal repayments on finance leases reported onthe company’s 10K or estimated principal repayments on finance leases based on 10K data.
For consistency, we omitted capital spending by the finance arm of companies such as General Motors and Ford, which reflects the financing of leased equipment rather than actual direct investment.
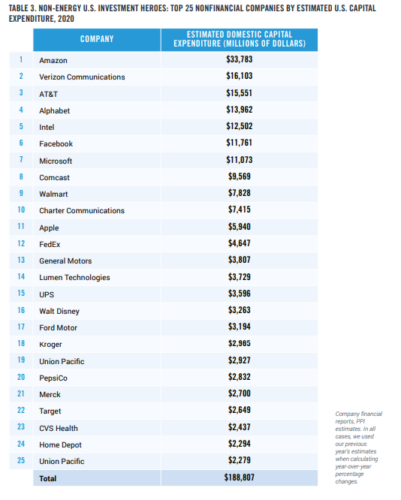
NON-ENERGY U.S. INVESTMENT HEROES
As a supplement to our complete U.S. Investment Heroes rankings, we also present a non-energy list for 2020 (Table 3). This list ranks the top U.S. companies investing domestically, according to our estimates, that are both non- financial and non-energy. The energy sector is one of the most capital intensive sectors of the economy and thus can heavily influence the top 25 results. The non-energy ranking includes the non-energy companies from our complete ranking but has also made room for other companies. For example, PepsiCo spent $2.8 billion on domestic capital expenditures by our estimates in 2020, a 26 percent increase compared to 2019.
Merck invested an estimated $2.7 billion on U.S. capital expenditures in 2020, a 42 percent increase compared to 2019. The pharmaceutical company spent on new capital projects focused primarily on increasing manufacturing capacity for its products.
Target invested $2.6 billion on domestic capital expenditures in 2020 by our estimates. The retailer increased its investments in information technology and new stores, while decreasing its spending on existing stores.
CVS Health spent an estimated $2.4 billion on U.S. capital expenditures in 2020, a relatively flat amount compared to our 2019 estimates for the company. Technology made up the majority of the health retailer’s capital expenditures, while store and fulfillment expansion and improvements and new store construction made up a minority share.
Home Depot invested $2.3 billion on domestic capital expenditures in 2020 by our estimates, a slight decrease of 5 percent relative to our 2019 estimates for the company.
Rounding out our top 25 non-energy list is Johnson & Johnson, spending an estimated $2.3 billion on U.S. capital expenditures in 2020. Johnson & Johnson continues to invest in its consumer health, pharmaceutical, and medical device segments, and of course vaccine production.
The gig economy has provided opportunities for workers who aren’t able to find or aren’t interested in full-time regular employment. Traditional jobs require workers to show up at a particular location and work a predetermined schedule set by the company. Ride-hailing and delivery gigs allow workers to set their own schedules and work as much or as little as they like. This flexibility is a key component of why independent workers choose to participate in the gig economy. But that doesn’t mean the current arrangement is perfect.
Gig workers often aren’t able to access the benefits that regular employees tend to receive in addition to their wages. Health insurance, retirement plans, vacation days, and other benefits are highly valuable pieces of total compensation for full-time employees. If gig companies were to provide independent workers with benefits, they would be forced to reclassify them as employees, which brings a host of onerous rules and regulations that are incompatible with the dynamic and flexible nature of the gig economy.
Fortunately, it seems there is another way forward to improve the lives of gig workers by securing them benefits while maintaining the flexibility they desire. As Michael Mandel and I detailed in a paper last year for the Progressive Policy Institute (PPI), Congress should allow gig companies to opt into an alternative model. Under our proposal, workers would be able to accrue benefits in proportion to the hours they work across a wide array of platforms and then select which benefits they want from a cafeteria style plan (the ability to choose is critical because sometimes workers already receive benefits such as health insurance from a spouse or other family member).
Voters seem to like this approach of offering more benefits to gig workers while letting them keep their flexibility. Last year, California voters approved Prop 22, which overturned AB-5, a controversial state bill that reclassified a broad array of independent contractors as employees. The results of this ballot proposition were not particularly close: 59% voted in favor, 41% voted against. According to the Los Angeles Times, Prop 22 found its highest support in low-income and minority communities:
A Times examination of precinct-level data in Los Angeles County shows the companies’ argument held sway in its dense core, finding support in lower income areas including plurality-Black neighborhoods such as Inglewood and Compton, and majority-Latino East Los Angeles. It also won suburbs in the San Fernando Valley, affluent communities such as La Cañada Flintridge, and rare Los Angeles precincts where President Trump was victorious in Beverly Hills and Santa Clarita.
A band of wealthy or increasingly affluent liberal-leaning neighborhoods stretching from Santa Monica and Venice, across to Los Feliz, Highland Park and South Pasadena mounted the strongest opposition, decisively voting down the measure.
So, what did drivers get in exchange for maintaining their classification as independent contractors? According to Quartz, Prop 22 “guarantees gig workers new, limited healthcare subsidies and accident insurance, some reimbursement to account for gas and other vehicle costs, and a ‘minimum earnings guarantee’ equal to 120% of the minimum wage applied to the drivers’ ‘engaged’ time.” Not only do voters approve of this model, but drivers do too. According to one survey of Uber and Lyft drivers, around 70 to 80% of respondents prefer being independent contractors to employees.
A broader survey from the Bureau of Labor Statistics found that “Independent contractors overwhelmingly favored their alternative employment arrangement (79 percent) to a traditional one (9 percent) in May 2017.” In total, these data points show that worker benefits and flexibility are a winning combination for the gig economy.
Replacing gasoline cars with electric vehicles is a pillar of President Biden’s strategy for tackling climate change. But even if the administration sets a deadline to sunset sales of gas-powered passenger vehicles, the export of used cars abroad could stall the global reductions needed to stave off catastrophic warming.
Every year, the United States ships hundreds of thousands of its oldest and dirtiest cars overseas to predominantly poor countries in a trade that is largely unregulated. In other words, cars that would fail safety, fuel economy and emissions standards in the United States or Europe are dominating the roads in countries that rely on imported vehicles.
In Kenya and Nigeria, for example, more than 90% of vehicles are foreign imports.
“The pollution and gas guzzling continue on even after the vehicle is removed from America’s roads,” said Dan Becker, head of the safe climate transport campaign at the Center for Biological Diversity. “It’s essentially a Cheshire cat issue.”
Worldwide, there are about 1.4 billion cars on the road. That figure is expected to more than double by 2050, with 90% of growth coming from the sale of used vehicles in lower-income countries. That means emissions from the global transportation fleet — which currently account for a quarter of total carbon dioxide emissions worldwide — also could double.
If left unchecked, the global trade in secondhand cars could have bleak consequences for climate change, air quality and, by extension, public health, according to a pioneering U.N. report released last year.
The study found that between 2015 and 2018, the United States, Japan and the European Union exported 14 million used passenger cars, with 70% winding up in developing countries in Africa, Eastern Europe, Asia, the Middle East and Latin America. Two-thirds of countries surveyed in the study lacked adequate policies to regulate the quality of imported cars. Consequently, the majority of used vehicles imported were inefficient, unsafe and old.
In Uganda, for example, the average age of a used diesel import in 2017 was more than 20 years.
“The majority of the vehicles being exported do not have a valid road worthiness certificate,” said Rob de Jong, head of the U.N. Environment Programme’s Sustainable Mobility Unit and an author of the report. “The trade in used vehicles is not a bad thing per se, but in the total absence of standards, it’s a free-for-all.”
A few countries have started cracking down on dirty, unsafe imports. Some countries, such as Egypt, India and Brazil, have outright banned the import of used vehicles. Others, like Iran and Iraq, have implemented age limits, while still others, such as Singapore and Morocco, have issued vehicle emissions standards.
Mauritius, a small island nation in the Indian Ocean, banned used vehicles over 3 years old and issued a vehicle carbon tax. As a result, the country has seen a major increase in the import of used electric and hybrid cars.
Still, there is no regional or global standard to regulate the flow of used vehicles as a climate mitigation or air pollution control mechanism. De Jong of the U.N. said there needs to be a streamlined approach to curbing the sale of unsafe and inefficient vehicles.
“The risk of not doing this,” he said, “is not meeting the Paris climate agreement,” which aims to keep warming below 2 degrees Celsius.
Roger Gorham, a transport economist and urban development specialist with the World Bank, said there is an emerging consensus that regulating the secondhand vehicle trade should be a joint responsibility between exporting and importing countries.
“Exporters need to be able to distinguish between legitimate exports of vehicles that can actually be used safely, reliably and in line with environmental and climate objectives in their destination countries, as opposed to cars and trucks that do not meet even the most basic safety and environmental standards,” he said in an email. “But importer countries also have an obligation to be clear about the acceptable performance thresholds of cars (and fuels) they will allow to be imported into their country.”
In the United States, the export of used cars and trucks accounts for a small fraction of the domestic used vehicle market. In 2019, more than 40 million used vehicles — and 17 million new ones — were sold, according to Edmunds. Of those 40 million, less than 1 million were exported overseas, according to Commerce Department data.
Still, the United States is the third-largest exporter of used vehicles, behind the European Union and Japan. Additionally, dramatic action is required in the next decade if humanity is to stave off catastrophic warming, according to an International Energy Agency report released this week (Climatewire, May 18).
Electric vehicles currently make up 5% of global automobile sales. That number will need to increase to 60% by 2030, IEA said, and the sale of traditional gasoline- and diesel-powered cars will need to end by 2035.
Ray LaHood, who served as Transportation secretary under former President Obama, said the Biden administration should try to regulate the export of dirty vehicles.
“Part of our responsibility is to clean up the environment in whatever ways we can, not only for our own country but for the world,” he said in an interview. “That has to be a priority.”
Biden administration officials “are going to have to think about whether they take these cars in as trade-ins,” added LaHood, who now serves as co-chair of the Building America’s Future Educational Fund, a bipartisan infrastructure coalition.
Under the Obama administration, LaHood oversaw a federal program called the Consumer Assistance to Recycle and Save (CARS) program — also known as Cash for Clunkers — which provided financial incentives for car owners to trade in their vehicles for new, more fuel-efficient cars and trucks. The program, which was intended to stimulate the post-recession economy and promote the sale of cleaner cars, was enormously popular.
Consumers who traded in their older automobiles and purchased new ones received cash rebates on the spot. Within six weeks of authorizing a $1 billion disbursement, Congress appropriated an additional $2 billion for rebates.
According to a Congressional Research Service report, more than 677,000 rebates were processed, increasing the U.S. gross domestic product by billions of dollars, creating or saving thousands of jobs, reducing fuel consumption by millions of gallons, and significantly slashing carbon emissions.
Traded-in vehicles were supposed to be smashed or otherwise destroyed, but a 2010 Transportation Department Office of Inspector General report found disposal hard to verify. Of the disposal facilities surveyed, the report found that 32% were not in compliance with DOT standards, which required facilities to report the disposal to the National Motor Vehicle Title Information System (NMVTIS).
But at the time of the OIG report’s release in 2010, only 15 states fully participated in the NMVTIS database, which was created to deter vehicle theft and fraud. After Hurricane Katrina, for example, cars that had been declared total losses to be scrapped were resold in other states with forged titles, a process known as title washing. Today, 48 states participate in the program, according to its website. Hawaii, Kansas and the District of Columbia are listed as “in development.”
“[O]ne facility, which received 357 CARS vehicles at the time of our audit, was not aware of NMVTIS and therefore, had not reported any information on the status of those vehicles,” the investigation found. “In addition, one facility we visited did not sign or date the disposal certification forms for the 27 trade-in vehicles it handled.”
Paul Bledsoe, who served as a Department of Energy consultant under Obama and worked on climate change in the Clinton administration, said he worries that many Cash for Clunkers vehicles may have ended up being exported.
“They were shipped overseas to Africa or South America,” Bledsoe, now a strategic adviser for the Progressive Policy Institute, said in an interview last month. “So the Biden team has to make sure [retired vehicles] are permanently retired.”
Today, the Innovation Frontier Project (IFP), a project of the Progressive Policy Institute, released a new report from James Bessen, an economist and Executive Director of the Technology & Policy Research Initiative at Boston University School of Law.
In the report, Bessen argues that new information technology has delivered more and unprecedented convenience for consumers, and good-paying jobs that contribute to overall economic growth. However, limited access to the technology is also contributing to the major economic and social issues of the day: the growing dominance of large firms and the struggle to increase the flow of knowledge, slow productivity growth, rising economic inequality, and the failure of regulation. The challenge for policymakers is to mitigate these negative effects while preserving as many of the benefits as possible to consumers, to workers, and to the economy.
“James Bessen provides a policy framework for thinking about the diffusion of these important digital technologies. The productivity gains that have resulted from proprietary IT investments are vitally important, but now we need to make sure the whole economy can benefit from these advancements.” said Caleb Watney and Alec Stapp, co-leads of the Innovation Frontier Project.
The report draws from his forthcoming book, “Superstar Capitalism”, to be published by Yale University Press.
Based in Washington, D.C. and housed in the Progressive Policy Institute, the Innovation Frontier Project explores the role of public policy in science, technology and innovation. The project is co-led by Caleb Watney and Alec Stapp.
The Progressive Policy Institute (PPI) is a catalyst for policy innovation and political reform based in Washington, D.C. Its mission is to create radically pragmatic ideas for moving America beyond ideological and partisan deadlock. Learn more about PPI by visiting progressivepolicy.org.
On this week’s Radically Pragmatic Podcast, Crystal Swann, Senior Policy Fellow at the Progressive Policy Institute and Mosaic Economic Project lead and Hilary Abell, Mosaic Economic Project Cohort member and co-founder of Project Equity, sit down with Rep. Chrissy Houlahan (PA-06), a trained engineer, entrepreneur and veteran.
Congresswoman Houlahan serves on the House Armed Services Committee, the House Foreign Affairs Committee, and the House Small Business Committee. Additionally, she is the Chair and Founder of the Servicewomen and Women Veterans Congressional Caucus, is Co-Chair of the Women in STEM Caucus, and is a Whip in the New Democrat Coalition.
They discuss the role of women in the new post-COVID economy, removing barriers to childcare, supporting access to capital for women of color seeking to become entrepreneurs, expanding access to affordable health care and more.
“There’s a lot of different very good ideas on how to make healthcare more accessible, more affordable, and more portable for people. Those three things are issues one, two, and three in my community and many other communities. People – whether they are individuals who have health care, individuals who don’t have health care, entrepreneurs who are starting businesses or larger businesses who employ people – whatever one of those things you fit into, you all have issues with health care. So we need to be thinking about how to make our collective systems more efficient and more fair,” said Rep. Chrissy Houlahan on the podcast.
This podcast was in partnership with PPI’s Mosaic Economic Project. The Mosaic Economic Project is a network of diverse and highly credentialed women in fields of economics and technology. Mosaic programming focuses on upskilling, connecting, and advocating for cohort participants’ meaningful engagement in public policy debates, with a particular focus on engaging Congress and the media.
The Progressive Policy Institute(PPI) is a catalyst for policy innovation and political reform based in Washington, D.C. Its mission is to create radically pragmatic ideas for moving America beyond ideological and partisan deadlock. Learn more about PPI by visiting progressivepolicy.org.
On Tuesday, April 27th, PPI hosted a webinar with special guest Senator Kirsten Gillibrand on policies to help women return to the workforce following the devastating effect of the pandemic on women’s labor force participation. Our panel included policy experts on labor, child care, and gender equity.
Keynote Speaker:
Sen. Kirsten Gillibrand (D-NY)
Moderator:
Veronica Goodman, Social Policy Director, Progressive Policy Institute
Panel:
Chandra Childers, Study Director at the Institute for Women’s Policy Research
Elliot Haspel, Author of Crawling Behind: America’s Child Care Crisis and How to Fix It
Rhonda V. Sharpe, founder & president, Women’s Institute for Science, Equity, and Race