Updated on October 21, 2020.
As the coronavirus pandemic enters its 10th month, the United States continues to lead the world in deaths and infection rates. The hard truth is America ranks dead last when it comes to responding effectively to COVID-19.
As of mid-October, more than 222,000 Americans have been killed by the virus, some 70,000 more fatalities than second-ranking Brazil. The United States accounts for about one-fifth of global deaths. We have more than 8.2 million confirmed cases of COVID-19, and the number is rising as the pandemic’s “third wave” spreads throughout the Midwest and mountain West, and in rural America.
Since the United States is rich and technologically advanced, and spends far more than other countries on health care, there can only be one explanation for our abysmal showing against the coronavirus pandemic: An epic failure of political leadership, especially at the top.
The Trump administration’s manifest inability to contain the pandemic has cost tens of thousands of preventable U.S. deaths and prolonged the nation’s worst economic crisis since the Great Depression. More than 50 million Americans have filed for unemployment, countless small businesses have gone under, and national output has plummeted.
COVID-19 deaths have been concentrated among the elderly in nursing homes; front-line health workers and those in “essential” industries like meat packing; and, poor and minority communities where people are more likely to make medical conditions that make them more vulnerable to the virus.
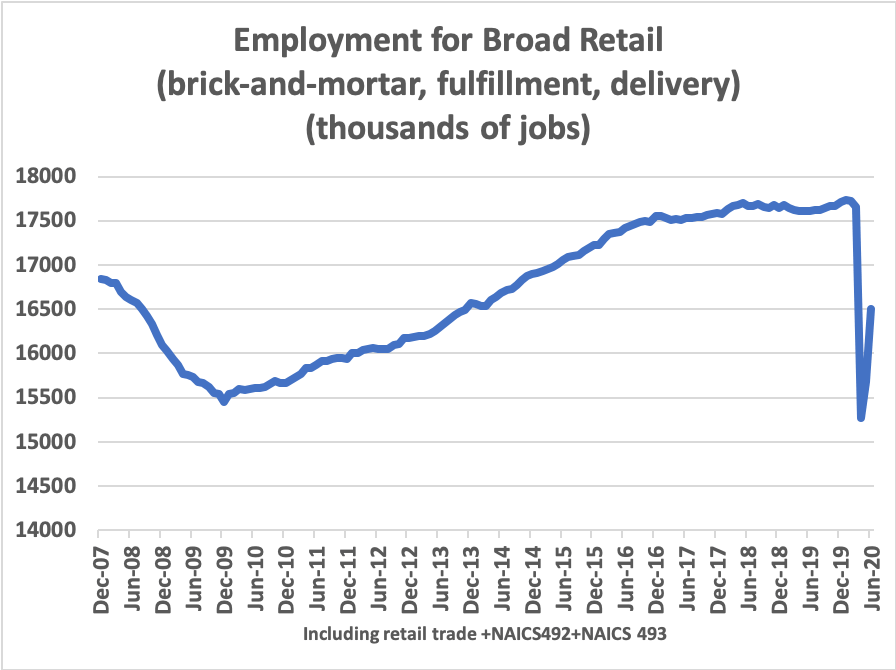
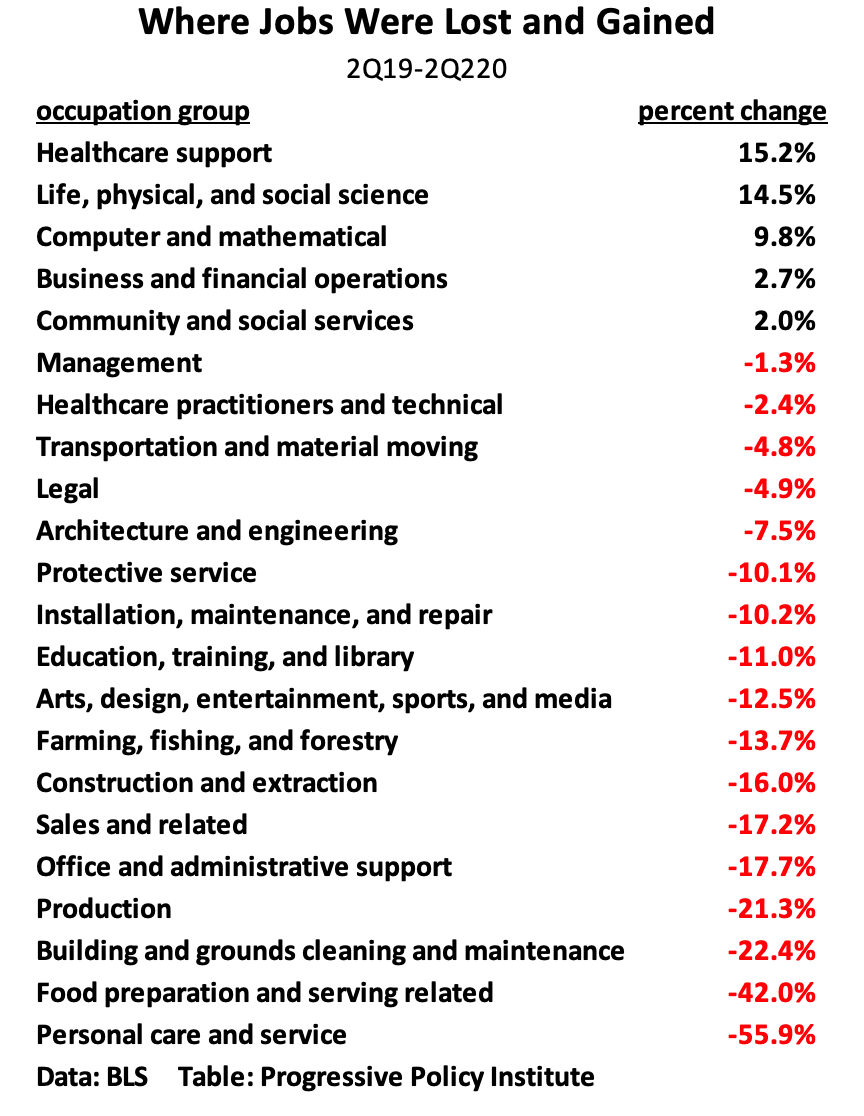
The crisis also has aggravated the nation’s pre-existing economic inequities. Layoffs have been heaviest in low-paid hospitality and service jobs, while many office workers with college degrees have been able to keep working remotely. Even as the economy has contracted, the stock market keeps rising, widening the nation’s wealth gap.
Millions of K-12 students suffered acute learning losses when public schools closed last spring, and many disadvantaged children also lost access to school meals. Many schools remain closed this fall, putting a heavy burden on parents forced to stay home to look after their kids and help them keep up with their studies online.
No one expected the United States to escape the ravages of COVID-19 unscathed. But the enormous scale of our human and economic losses was not inevitable. Other countries have managed the COVID-19 crisis far more effectively. For example, South Korea, which reported its first case of infection on the same day as the United States, reports less than 400 deaths and about 22,000 cases.
In fact, the COVID-19 crisis has posed a kind of “governance stress test” to countries around the world. It is casting a remorseless light on the quality of each country’s political leadership and the competence of its national government.
Comparing America’s performance with that of other countries, the political scientist Francis Fukuyama concludes that President Donald Trump proved incapable of rising to the challenge:
“It was the country’s singular misfortune to have the most incompetent and divisive leader in its modern history at the helm when the crisis hit, and his mode of governance did not change under pressure. Having spent his term at war with the state he heads, he was unable to deploy it effectively when the situation demanded. Having judged that his political fortunes were best served by confrontation and rancor than national unity, he has used the crisis to pick fights and increase social cleavages. American underperformance during the pandemic has several causes, but the most significant has been a national leader who has failed to lead.”
Now, with an eye to this November’s election, President Trump and his party seek to convince Americans the debacle they have been witnessing throughout 2020 is a mirage. In a surreal spectacle, speaker after speaker in the Republican National Convention extolled Trump’s “decisive action” against COVID-19, while Trump himself bragged about ordering an “unprecedented national mobilization” against the “China virus.”
In fact, the mobilization of national will and resources our country needed never happened. The president’s negligence and disdain for taking elementary precautions against the disease, like wearing a mask, has contributed to outbreaks in the White House itself, infecting him and his family and many top staffers.
Even now, with the rate of infection surging again, it’s painfully clear that President Trump has no plan to contain the disease. Instead he’s fighting it with happy talk and promises that a vaccine is just around the corner. He and his party have given higher priority to adding another conservative Supreme Court justice than to passing a major COVID-19 relief bill to check the disease, boost our sputtering economy and maintain unemployment benefits.
The Progressive Policy Institute believes the 2020 presidential election should be a referendum on Donald Trump’s handling of the gravest national crisis he has faced as president. To help voters distinguish fact from fiction, PPI has assembled this comprehensive chronology of key events and milestones in the COVID-19 crisis. As it continues to unfold, we will update this instant historical record as necessary. If readers think we have missed any important events or information, please notify Kate Hinsche at khinsche@ppionline.org.
*Note: The main source for each entry can be found by clicking on the date.
COVID-19: Chronology of a Debacle
2017
JANUARY 12 – Speaking at Georgetown University, Dr. Anthony Fauci, Director of the National Institute on Allergy and Infectious Diseases, urges the incoming Trump administration to be prepared for outbreaks of viral diseases. “If there’s one message that I want to leave with you today based on my experience, it is that there is no question that there will be a challenge to the coming administration in the arena of infectious diseases.”
JANUARY 13 – Outgoing Obama administration officials run a crisis simulation for President-elect Trump’s national security team on how to react to the outbreak of a deadly respiratory disease. The incoming administration is also given a 69-page playbook with best practices for handling global pandemics.
MAY 11 – Dan Coats, Director of National Intelligence, reports to Congress about threats to the United States, including global pandemics.
MAY 27 – In his first budget, President Trump proposes a $1.3 billion cut in the Center for Disease Control (CDC) for 2018. In each year of his presidency, President Trump has proposed similar cuts to the CDC’s funding. (2019) (2020) (2021)
2018
FEBRUARY 13 – DNI Coats again warns Congress about the threat of a global pandemic.
APRIL 10 – Tom Bossert, White House homeland security advisor, resigns at the request of National Security Advisor John Bolton. Bossert had repeatedly called for a comprehensive biodefense strategy against pandemics and biological attacks.
MAY 7 – Speaking at Emory University to mark the 100th anniversary of the 1918 influenza pandemic, Luciana Borio, the National Security Council’s Director of Medical and Biodefense preparedness, warns “The threat of pandemic flu is the number one health security concern. Are we ready to respond? I fear the answer is no.”
MAY 8 – President Trump calls for cuts in emergency funds for Ebola and other pandemics, as well as the State Department’s Complex Crisis Fund for “emerging or unforeseen crises.”
MAY 10 – As part of his effort to “streamline” the National Security Council, Bolton disbands the Directorate for Global Health Security and Biodefense and removes its director, Rear Admiral Timothy Ziemer.
OCTOBER 19 – “In a move that worries public health experts,” the New York Times reports, “the federal government is quietly shutting down a surveillance program for dangerous animal viruses that someday may infect humans.”
2019
JANUARY 29 – DNI Coats again warns Congress that the United States remains “vulnerable to the next flu pandemic or large scale outbreak of a contagious disease that could lead to massive rates of death and disability, severely affect the world economy, strain international resources, and increase calls on the United States for support.”
JULY 28 – DNI Coats, who had publicly differed with President Trump over Russia’s interference in the 2016 election, steps down.
SEPTEMBER 15 – The President’s Council of Economic Advisers (CEA) warns that an influenza pandemic could cause enormous health and economic losses.
OCTOBER 1 – The Department of Health and Human Services (HHS) issues a draft report on a series of exercises code-named “Crimson Contagion.” The report warns that the federal government is “underfunded, underprepared and uncoordinated” to fight an influenza pandemic.
DECEMBER 31 – China reports the outbreak of the novel coronavirus (COVID-19) to the World Health Organization.
2020
JANUARY
JANUARY 6 – The CDC issues a travel notice for Wuhan, China following reports of the outbreak of a new infectious disease.
JANUARY 10 – Chinese state media reports first death in China due to the novel coronavirus.
JANUARY 18 – HHS Secretary Alex Azar warns President Trump of the possibility of a pandemic stemming from the outbreak in China.
JANUARY 21 – The CDC reports the first coronavirus case in the United States: An unidentified Washington State man, in his early 30s who recently had traveled to Wuhan.
JANUARY 22 – In an interview in Davos, Switzerland, President Trump dismisses concerns about the coronavirus, saying “We have it totally under control.”
JANUARY 22 – White House officials turn down an offer to buy millions of N95 masks manufactured in America, according to the manufacturer.
JANUARY 24 – President Trump congratulates Chinese President Xi on his handling of the outbreak in Wuhan, tweeting: “The United States greatly appreciates their efforts and transparency.”
JANUARY 29 – White House advisor Peter Navarro circulates a memo outlining the risks of coronavirus contagion. It estimates that, in a worst-case scenario, a pandemic could claim up to 500,000 U.S. lives and cost close to $6 trillion.
JANUARY 30 – Amid serious outbreaks in Italy and China, the World Health Organization (WHO) declares COVID-19 a global public health emergency.
JANUARY 30 – HHS Secretary Azar again warns President Trump of the possibility of a pandemic. The New York Times reports, “Mr. Azar was blunt, warning that the virus could develop into a pandemic and arguing that China should be criticized for failing to be transparent.”
JANUARY 30 – In a press conference, President Trump assures Americans have little to worry about: “We think we have it very well under control. We have very little problem in this country at this moment — five — and those people are all recuperating successfully.”
JANUARY 31 – President Trump issues an executive order ostensibly banning travel to and from China.
FEBRUARY
FEBRUARY 2 – “We pretty much shut it (coronavirus) down coming in from China,” President Trump tells Fox News’s, Sean Hannity.
FEBRUARY 6 – COVID-19 claims its first U.S. victim: Patricia Dowd, 57, of Santa Clara, California. This fact isn’t disclosed until after an April 21 autopsy.
FEBRUARY 8 – Labs receiving coronavirus tests from the CDC start to complain that they don’t work properly. The problem isn’t resolved until weeks later when the FDA waives rules against tests developed elsewhere.
FEBRUARY 10 – President Trump continues to express confidence in China’s management of the pandemic. He tells governors at the White House that President Xi of China feels “very confident” because “by April or during the month of April, the heat, generally speaking, kills this kind of virus.”
FEBRUARY 23 – Navarro sends a second memo to President Trump, warning of the “increasing probability of a full-blown COVID-19 pandemic that could infect as many as 100 million Americans, with a loss of life of as many as 1-2 million souls.”
FEBRUARY 24 – “The Coronavirus is very much under control in the USA,” President Trump tweets.
FEBRUARY 26 – President Trump introduces the White House coronavirus task force, even while continuing to minimize the danger: “The flu, in our country, kills from 25,000 people to 69,000 people a year… And again, when you have 15 [COVID-19 victims], and the 15 within a couple of days is going to be down to close to zero, that’s a pretty good job we’ve done.”
FEBRUARY 27 – “It’s going to disappear. One day it’s like a miracle, it will disappear,” President Trump declares in a White House briefing with African American leaders.
FEBRUARY 29 – Stung by criticism of White House inaction, President Trump tells the press: “We’ve taken the most aggressive actions to confront the coronavirus. They are the most aggressive taken by any country and we’re the number one travel destination anywhere in the world, yet we have far fewer cases of the disease than even countries with much less travel or a much smaller population.”
MARCH
MARCH 1 – First reported U.S. COVID-19 death in Washington State. The unidentified patient was a man in his 50s with serious health problems.
MARCH 2 – President Trump predicts that a COVID-19 vaccine is imminent. “I’ve heard very quick numbers, that of months.” This contradicts Dr. Fauci’s repeated warnings that a vaccine may not be available for a year or a year and a half.
MARCH 6 – At a press briefing, President Trump boasts about his understanding of the coronavirus: “I like this stuff. I really get it. People are surprised that I understand it. […] Every one of these doctors said, ‘How do you know so much about this?’ Maybe I have a natural ability.”
MARCH 6 – “Anybody that wants a test can get a test,” President Trump asserts after touring the CDC headquarters in Atlanta.
MARCH 6 – The Coronavirus Preparedness and Response Supplemental Appropriations Act — Congress’s first response to the pandemic — becomes law. It provides $8.3 billion in emergency funding for federal agencies to combat coronavirus.
MARCH 9 – In a tweet, President Trump again compares COVID-19 to the flu: “So last year 37,000 Americans died from the common Flu. It averages between 27,000 and 70,000 per year. Nothing is shut down, life & the economy go on. At this moment there are 546 confirmed cases of CoronaVirus, with 22 deaths. Think about that!”
MARCH 10 – Following a meeting with Republican Senators, President Trump again praises his administration’s handling of COVID-19: “It hit the world. And we’re prepared, and we’re doing a great job with it.”
MARCH 10 – In a televised address to the nation, President Trump asserts, inaccurately, that Americans won’t have to pay for COVID-19 treatment.
MARCH 11 – In a press briefing, President Trump again downplays the danger of COVID-19. “The vast majority of Americans, the risk is very, very low. Young and healthy people can expect to recover fully and quickly if they should get the virus.”
MARCH 11 – President Trump announces increased travel restrictions for 26 European countries. In practice, however, the order is riddled with loopholes that create long lines for some and zero screening for others.
MARCH 11 – WHO upgrades COVID-19 from a public health emergency to a global pandemic.
MARCH 11– News reports say that the United States has tested just over 7,000 people for the coronavirus, compared to 222,395 tests conducted in South Korea. Both countries reported their first COVID-19 case on the same day.
MARCH 13 – Asked by a reporter if he would “take responsibility for the failure to disseminate larger quantities of tests earlier,” President Trump replies, “I don’t take responsibility at all.”
MARCH 15 – 33 states plus the District of Columbia close their public schools.
MARCH 16 – President Trump announces self-isolation guidelines for Americans to follow for the next 15 days.
MARCH 16 – President Trump denies understating the danger of COVID-19: “I’ve always known this is a real — this is a pandemic. I felt it was a pandemic long before it was called a pandemic.”
MARCH 17 – U.S. COVID-19 death toll exceeds 100.
MARCH 18 – Congress passes a second relief bill, the Families First Coronavirus Response Act. It provides close to $3.5 billion for coronavirus testing, 14-day paid leave for workers affected by the pandemic, and removes work requirements for food stamps.
MARCH 19 – President Trump touts, without evidence, chloroquine, and hydroxychloroquine as a potential cure to COVID-19.
MARCH 22 – In a flurry of tweets, President Trump voices frustration over governors’ handling of the pandemic. The public, however, expresses far more confidence in their governors than the president in national polls.
MARCH 23 – The first nine states implement stay-at-home orders (Washington, Oregon, California, Louisiana, Illinois, Ohio, New York, Massachusetts, and New Jersey).
MARCH 23 – The media reports that 48 states plus the District of Columbia have closed their public schools for the rest of the academic year.
MARCH 24 – In the daily coronavirus task force briefing, President Trump imagines the U.S. economy reopening in a matter of weeks: “I would love to have the country opened up and just raring to go by Easter… I think Easter Sunday — you’ll have packed churches all over our country.”
MARCH 25 – In the daily briefing, President Trump claims the United States leads the world in testing. “We have tested, by far, more than anybody…There’s nobody even close. And our tests are the best tests.” On a per-capita basis, however, the United States ranks low on tests.
MARCH 25 – U.S. COVID-19 death toll passes 1,000.
MARCH 26 – Twelve more states implement stay-at-home orders (Idaho, Colorado, New Mexico, Michigan, Wisconsin, Kentucky, Indiana, West Virginia, Hawaii, Connecticut, Vermont, and Delaware).
MARCH 26 – U.S. cases surge to 82,404, overtaking both Italy and China to make America the world’s leader in reported COVID-19 infections.
MARCH 27 – Congress passes its third and largest aid bill, the Coronavirus Aid, Relief, and Economic Security (CARES) Act. The CARES Act provides $2 trillion to aid businesses and workers, procure medical supplies and equipment, and expand Unemployment Insurance.
MARCH 28 – In signing the CARES Act, President Trump claims that the Inspector General charged with oversight of the bill requires his permission before reporting to Congress.
MARCH 30 – Nine more states implement stay-at-home orders.
MARCH 31 – President Trump concedes that COVID-19 “is not the flu. It’s vicious. When you send a friend to the hospital… And you call up the next day, ‘how’s he doing?’ And he’s in a coma? This is not the flu.”
MARCH 31 – U.S. COVID-19 death toll surpasses 5,000.
APRIL
APRIL 3 – President Trump tells the public that COVID-19 is retreating. “I said it was going away – and it is going away.”
APRIL 3 – New York City COVID-19 deaths surpass the number of Americans killed on 9/11.
APRIL 3 – The U.S. Chamber of Commerce reports that 24% of small businesses have closed due to the coronavirus lockdown and predicts another 40% could close soon.
APRIL 3 – In response to the CDC’s recommendation that Americans wear facial masks, President Trump declines to lead by example, saying, “I don’t think I’m going to be doing it.”
APRIL 4 – U.S. COVID-19 death toll passes 10,000.
APRIL 6 – Twelve more states issue stay-at-home orders, bringing the total number to 42.
APRIL 6 – The United States overtakes Spain’s COVID-19 death toll with 13,298 fatalities, the second-highest in the world behind Italy.
APRIL 7 – President Trump ousts Glenn Fine, the DOD Inspector General picked to oversee the implementation of the CARES Act.
APRIL 9 – The United States overtakes Italy’s COVID-19 death toll with 19,802 fatalities, becoming the world leader in COVID-19 mortality.
APRIL 14 – President Trump halts America’s contribution to WHO funding and calls for an investigation into the agency’s role in ”severely mismanaging and covering up the spread of the coronavirus.”
APRIL 14 – U.S. COVID-19 death toll passes 30,000.
APRIL 17 – In a series of tweets, President Trump encourages protests against Democratic governors’ social distancing restrictions: “LIBERATE MICHIGAN,” “LIBERATE MINNESOTA,” “LIBERATE VIRGINIA.
APRIL 17 – The BLS reports that national unemployment grew 0.9% in March, to 7.4 million unemployed or 4.4%.
APRIL 19 – U.S. COVID-19 death toll passes 40,000.
APRIL 21 – Tests from autopsies performed in early February come back positive for coronavirus, revealing COVID-19 deaths before the CDC reported the first U.S. fatality on March 1.
APRIL 21 – The White House removes Rick Bright, Director of the Biomedical Advanced Research and Development Authority (BARDA). Bright had said the president’s claims for the curative powers of chloroquine and hydroxychloroquine “clearly lack scientific merit.”
APRIL 23 – In a fourth relief bill, Congress approves $484 billion in additional funding for small businesses, hospitals, and coronavirus testing.
APRIL 23 – President Trump is widely ridiculed for musing in a task force briefing that COVID-19 might be treatable with disinfectants and sunlight. “I see the disinfectant, where it knocks [the virus] out in a minute… is there a way we can do something like that, by injection inside or almost a cleaning?”
APRIL 24 – Georgia becomes the first state to start lifting restrictions and reopening some businesses.
APRIL 28 – U.S. COVID-19 death toll surpasses the official tally (58,300) of Americans who died in the 1955-1975 Vietnam War.
APRIL 29 – The Bureau of Economic Analysis reports that the U.S. economy shrank at an annual rate of 4.8% in the first quarter of 2020.
MAY
MAY 1 – President Trump announces his intention to replace Christi Grimm, the Inspector General of HHS, who released a late April report documenting shortages of medical supplies and testing delays.
MAY 4 – Media reports say that almost 20 states have begun to lift social distancing restrictions.
MAY 5 – Trump announces he’ll wind down the coronavirus task force by the end of May so that the White House can focus on restarting the economy.
MAY 5 – U.S. COVID-19 death toll passes 70,000.
MAY 6 – President Trump again expresses impatience about opening the economy. “We can’t have our whole country out. We can’t do it. The country won’t take it. It won’t stand it. It’s not sustainable.”
MAY 10 – Two White House employees test positive for COVID-19.
MAY 11 – The BLS reports that the unemployment rate in April has ballooned to 14.7% with 20.5 million unemployed, much higher than at the peak of the 2008 Great Recession.
MAY 11 – President Trump castigates Pennsylvania Gov. Tom Wolf for “moving slowly” to reopen his state as protestors rally.
MAY 18 – President Trump admits he has been taking daily doses of hydroxychloroquine, which has yet to be proven effective and may even be harmful to those who contract coronavirus.
MAY 21 – President Trump, after conducting a Michigan factory tour without a face mask, explains, “I wore one in this back area, but I didn’t want to give the press the pleasure of seeing it.”
MAY 26 – U.S. COVID-19 death toll passes 100,000.
MAY 26 – 36 states have reopened or are in the process of reopening.
MAY 28 – The total number of new jobless claims surpasses 40 million.
JUNE
JUNE 2 – Trump suggests GOP move convention to Jacksonville, FL after N.C. Gov. Roy Cooper refuses to allow packed arenas.
JUNE 3 – According to a new study from the University of Minnesota, the malaria drug hydroxychloroquine does not prevent people from contracting COVID-19.
JUNE 6 – 35.4 million Americans are receiving unemployment benefits.
JUNE 8 – Following an easing of lockdown conditions in many parts of the country, infections are rising in 21 states.
JUNE 11 – U.S. COVID-19 cases surpass two million.
JUNE 11 – News outlets report that more than 20 European countries have reopened their schools. Most U.S. schools remain closed.
JUNE 16 – In an op-ed, Vice President Mike Pence dismisses reports about a “second wave” of coronavirus infections and boasts that the Trump administration is “winning the fight against the invisible enemy.”
JUNE 17 – Vice President Pence tells governors that an apparent rise in U.S. coronavirus outbreaks stems from an increase in testing.
JUNE 19 – Gov. Andrew Cuomo wraps up 111 consecutive days of widely praised coronavirus briefings as COVID-19 hospitalizations in New York have dropped below 1,000 for the first time since March 18.
JUNE 19 – Nine Texas mayors write a letter to the states’ residents, urging them to wear masks. Coronavirus cases in Texas continue to surge and the number of hospitalizations has been climbing since May.
JUNE 20 – Disregarding warnings from administration health officials against large public gatherings, Pres. Trump resumes mass campaign rallies in Tulsa, with 6,200 people in attendance.
JUNE 21 – President Trump complains that more COVID-19 testing is increasing the number of confirmed U.S. cases. “When you do testing to that extent, you’re going to find more people, you’re going to find more cases, So I said to my people, ‘Slow the testing down, please’,” he says at the Tulsa rally.
JUNE 22 – Two members of President Trump’s campaign advance team, who attended Trump’s rally in Oklahoma, test positive for coronavirus.
JUNE 22 – New data confirms that COVID-19 cases are growing in 29 states.
JUNE 23 – President Trump again insists that more tests are to blame for the increase in coronavirus infections.
JUNE 23 – At a Congressional hearing, Dr. Fauci says U.S. health officials see a “disturbing surge” of infections in some parts of the country, as Americans ignore social distancing guidelines.
JUNE 23 – Texas tallies more than 5,000 new cases in a single day for the first time. “The coronavirus is serious. It’s spreading,” Texas Gov. Greg Abbott told a local television station.
JUNE 23 – President Trump addresses a crowd of student supporters at a tightly packed megachurch in Phoenix. Trump appeared without a mask, flouting a Phoenix rule that came into force less than 72 hours earlier.
JUNE 26 – VP Pence’s Coronavirus task force hails states for “safely and responsibly” reopening their economies. Yet Texas and Florida officials reimpose restrictions on bars and restaurants amid record levels of new cases and tightening hospital capacity.
JUNE 30 – The E.U. bloc will allow visitors from 15 countries, but the U.S., Brazil and Russia were among the notable absences from the safe list.
JUNE 30 – New York Times data confirms 40,041 U.S. COVID-19 cases.
JULY
JULY 2 – Daily number of new COVID-19 cases in the U.S. tops 50,000 for the first time, the largest single-day total since the start of the pandemic.
JULY 2 – The unemployment rate declines by 2.2 percentage points to 11.1 percent, and the number of unemployed persons falls by 3.2 million to 17.8 million.
JULY 2 – GOP 2012 presidential candidate Herman Cain is hospitalized with COVID-19 a week after attending the Trump rally in Tulsa, where many attendees were not wearing masks.
JULY 5 – President Trump dismisses the impact of COVID-19 and says that while the testing of tens of millions of Americans had identified many cases, “99 percent” of them were “totally harmless.”
JULY 7 – Pres. Trump insists U.S. colleges and universities should remain open for the fall semester, citing several European school openings, “We’re very much going to put pressure on governors and everybody else to open the schools, to get them open.”
JULY 8 – The U.S. reports more than three million coronavirus cases, with all but a handful of states struggling to control outbreaks of COVID-19.
JULY 10 – The United States reports 68,000 new cases, setting a single-day record for the seventh time in 11 days.
JULY 10 – Hong Kong shuts down its school systems, reporting more than 1,400 cases and seven deaths.
JULY 11 – Disney World reopens its gates in Orlando, Florida.
JULY 11 – President Trump appears with a face mask for the first time in public, five months after administration officials recommended that all Americans wear face masks in public.
JULY 12 – Florida reports a record 15,300 new coronavirus cases, by far the most any state has experienced in a single day.
JULY 13 – The media reports that at least 5.4 million Americans have lost their health insurance during the pandemic.
JULY 13 – In an apparent attempt to undermine Dr. Fauci’s credibility, a White House official releases a statement saying that “several White House officials are concerned about the number of times Dr. Fauci has been wrong on things.”
JULY 17 – India reports one million coronavirus cases and 25,000 deaths. Researchers at MIT estimate that by the end of 2021, India could have the world’s worst outbreak.
JULY 17 – Israeli Prime Minister Benjamin Netanyahu announces new restrictions on gyms, restaurants and beaches.
JULY 19 – During a Fox News interview, President Trump again asserts COVID-19 is going to disappear, “I think we’re gonna be very good with the coronavirus. I think that at some point that’s going to sort of just disappear.”
JULY 20 – U.K.’s Oxford University COVID-19 vaccine shows positive results in first phase of human trials.
JULY 21 – European Union leaders agree on a $857 billion spending package to rescue their economies from ravages of COVID-19.
JULY 21– At his first coronavirus-related news conference in weeks, President Trump admits that COVID-19, “will probably, unfortunately, get worse before it gets better. Something I don’t like saying about things, but that’s the way it is.”
JULY 23 – U.S. surpasses 4 million reported coronavirus cases
JULY 23 – Trump cancels Republican convention activities in Jacksonville.
JULY 30 – Second-quarter GDP plunges by worst-ever 32.9% amid virus-induced shutdown.
JULY 30 – Herman Cain succumbs to COVID-19.
AUGUST
AUGUST 3 – Trump criticizes Deborah Birx after she warns the U.S. that the coronavirus outbreaks are “extraordinarily widespread.”
AUGUST 5 – Twitter temporarily restricts the Trump campaign’s ability to tweet false COVID-19 claims.
AUGUST 6 – U.S. records more than 52,000 new COVID-19 cases and 1,388 virus-related fatalities.
AUGUST 6 – Ohio Gov. Mike DeWine tests positive for the coronavirus.
AUGUST 26 – Under pressure from the White House, the CDC issues new guidance saying that people who do not exhibit symptoms after being exposed to someone with coronavirus, “do not necessarily need a test.”
SEPTEMBER
SEPTEMBER 9 – Media reports revelations from Bob Woodward’s new book Rage that President Trump purposely minimized the dangers posed by the coronavirus: “I wanted to play it down. I still like playing it down because I don’t like to create panic,” Trump told Woodward.
SEPTEMBER 9 – “The president never downplayed the virus,” White House press secretary Kayleigh McEnany tells the media.
SEPTEMBER 12 – Media reports that Michael Caputo and Paul Alexander, Trump-appointed officials at the Health and Human Services Department, pressured CDC to “revise, delay and even scuttle weekly reports on the coronavirus that they believed were unflattering to President Trump.”
SEPTEMBER 16 – Caputo takes a leave of absence from HHS after posting a Facebook video accusing government scientists of working to defeat President Trump. Alexander announces his departure from HHS.
SEPTEMBER 18 – Olivia Troye, a top adviser to Vice President Pence and member of the White House coronavirus task force, says the task force recognized by mid-February that the virus posed a big threat to the United States. “But the President didn’t want to hear that, because his biggest concern was that we were in an election year.”
SEPTEMBER 18 – CDC reverses its August 26 guidance and encourages people exposed to someone with coronavirus to get tested, whether they show symptoms or not.
SEPTEMBER 22 – The U.S. COVID-19 death toll passes 200,000, accounting for 21% of global deaths.
SEPTEMBER 25 – The number of confirmed U.S. cases passes seven million.
SEPTEMBER 28 – Twenty-one states report increases in cases as health experts warn of a surge in fall pandemic surge.
SEPTEMBER 29 – Seven former commissioners of the federal Food and Drug Administration accuse the Trump administration of distorting science and “eroding public confidence” in the agency.
SEPTEMBER 30 – Olivia Troye tells NPR that CDC Director Robert Redfield has faced “very challenging dynamics, at times when you’re changing the wording and guidances to fit a narrative, to play down the severity of the virus or cases.”
SEPTEMBER 30 – In the same interview, Troye says President Trump’s refusal to wear a mask in the White House sets the tone for staff: “Even in the West Wing, …you were looked down upon when you would walk by with a mask.”
OCTOBER
OCTOBER 1 – White House communications director Hope Hicks tests positive for the coronavirus.
OCTOBER 1 – President Trump hosts a post-debate fundraiser at his golf club, where few attendees wear masks.
OCTOBER 2 – President Trump and First Lady Melania Trump test positive for COVID-19. Later that day the president is taken to Walter Reed National Military Medical Center.
OCTOBER 2 – Media reports that the official U.S. unemployment rate fell to 7.9% in September. However, the labor force participation was 61.3%, two points lower than in February.
OCTOBER 4 – President Trump temporarily leaves Walter Reed Hospital for a car ride by supporters stationed outside the hospital.
OCTOBER 5 – Several Secret Service agents anonymously criticize the president’s “joyride,” saying it exposed members of his security disease to the virus. “He’s not even pretending to care now” said one agent. Said another, “That should never have happened. The frustration with how we’re treated when it comes to decisions on this illness goes back before this though. We’re not disposable.”
OCTOBER 5 – President Trump’s medical team confirms that he will be returning to the White House this afternoon. “Feeling really good! Don’t be afraid of Covid,” the president tweets.
OCTOBER 5 – A Cornell University study identifies President Trump’s Twitter feed as the “single largest” transmitter of false information about COVID-19. Graham Brookie, Director of the Atlantic Council’s Digital Forensic Research Lab, reaches a similar conclusion: “There is no doubt that Donald Trump is by far the largest spreader of specific and important types of misinformation today.”
OCTOBER 6 – Stephen Miller, President Trump’s top immigration policy adviser, tests positive for COVID-19.
OCTOBER 6 – The stock market plunges after President Trump tweets that he has instructed his representatives to cease negotiations with Democrats on a new COVID-19 relief and stimulus bill.
OCTOBER 6 – NIH scientist Rick Bright resigns in protest over President Trump’s handling of the pandemic. “In this Administration, the work of scientists is ignored or denigrated to meet political goals and to advance President Trump’s re-election aspirations,” Bright charges.
OCTOBER 6 – In the Vice Presidential debate, Democratic nominee Kamala Harris says of President Trump’s handling of the pandemic, “The American people have witnessed what is the greatest failure of any presidential administration in the history of our country.” Vice President Pence responds by crediting Trump with “The greatest national mobilization since World War II.”
OCTOBER 7 – In a scathing letter, former CDC director Bill Foege – called the “Babe Ruth of public health” – calls on CDC Director Robert Redfield to publicly acknowledge the administration’s failure to level with the American people over COVID-19. “Don’t shy away from the fact this has been an unacceptable toll on our country. It is a slaughter and not just a political dispute.”
OCTOBER 8 – Senate Majority Leader Mitch McConnell admits he hasn’t been to the White House since August 6th, “because my impression was their approach to how to handle this was different than mine and what I insisted that we do in the Senate, which is to wear a mask and practice social distancing.”
OCTOBER 10 – The government reports a third consecutive day with over 50,000 coronavirus cases, the most since August.
OCTOBER 11 – On NBC’s Meet the Press, Bill Gates says, “We are running the worst testing system, in terms of who gets access to it, of any country.”
OCTOBER 12 – Dr. Fauci warns COVID-19 is “on a trajectory of getting worse.” The latest data shows infections increasing in 31 states.
OCTOBER 15 – The New York Times reports show that the autumn coronavirus surge is hitting the Midwest, mountain states and rural communities especially hard. “Of the 100 counties with the worst per-capita outbreaks in the last seven days, more than half are home to fewer than 10,000 people.”
OCTOBER 16 – More than 70,000 new cases of the coronavirus were reported today, the highest single-day increase since July. At least nine states set single-day case records, with Midwest and Mountain West states driving the surge.
OCTOBER 19 – The Washington Post reports on Dr. Scott Atlas’s attempts to hijack the White House coronavirus task force. “Atlas shot down attempts to expand testing. He advanced fringe theories, such as that social distancing and mask-wearing were meaningless and would not have changed the course of the virus in several hard-hit areas. And he advocated allowing infections to spread naturally among most of the population while protecting the most vulnerable and those in nursing homes until the United States reaches herd immunity, which experts say would cause excess deaths, according to three current and former senior administration officials.”
OCTOBER 19 – A new Yahoo News/YouGov poll shows that Joe Biden has a built a 19-point lead over President Trump on who would do a better job of handling COVID-19.
OCTOBER 19 – In a call with campaign staff, President Trump asserts that voters no longer want to hear what U.S. health officials have to say about the pandemic. “People are tired of hearing Fauci and all these idiots,” said. “Every time he goes on television, there’s always a bomb, but there’s a bigger bomb if you fire him. But Fauci is a disaster.”
OCTOBER 20 – Dr. Francis Collins, director of the National Institutes of Health, defends Fauci in an NPR interview. “Tony Fauci is probably the most highly respected infectious disease expert in the world – he’s also a terrific communicator – and I think the public has actually been greatly benefitted by hearing his unvarnished, unflinching descriptions of what’s happening with this pandemic.”
OCTOBER 26 – More than half of US states report their highest single day of new cases in October.
OCTOBER 30 – US surpasses 9 million coronavirus cases, only two weeks after hitting the 8 million case milestone.
NOVEMBER
NOVEMBER 6 – White House Chief of Staff Mark Meadows tests positive for coronavirus.
NOVEMBER 7 – Joe Biden is projected to win the electoral college by all major news organizations, but Trump refuses to concede.
NOVEMBER 9 – Pfizer announces vaccine candidate is 90 percent effective in early trials.
NOVEMBER 16 – Early data shows Moderna vaccine candidate is 94.5 percent effective.
NOVEMBER 20 – Biden coronavirus advisory board member says lack of shared information between Trump and Biden’s team is ‘dangerous,’ as Trump continues to block the Biden transition process.
NOVEMBER 20 – Donald Trump, Jr. tests positive for the coronavirus.
NOVEMBER 23 – The General Services Administration officially designates Joe Biden as the president-elect, beginning the formal transition of power.
DECEMBER
DECEMBER 1 – US closes out a record-breaking month for coronavirus cases and hospitalizations.
DECEMBER 7 – President Trump’s personal lawyer Rudy Giuliani is hospitalized after testing positive for coronavirus. The 76-year-old has spent the past month traveling around the country as part of his legal efforts to challenge the November election.