As federal and state governments outline plans for reopening the economy, lawmakers will have to grapple with the challenge of getting tens of millions of Americans back to work as quickly as possible.
More than 47 million Americans have filed for unemployment since the pandemic began, with the unemployment rate at 13.3 percent in May.
The economic damage has been inflicted on both the employer and worker sides of the labor market. A mass of businesses have filed for bankruptcy as a result of the lockdown, with the American Bankruptcy Institute finding a 48 percent increase in commercial Chapter 11 filings in May compared to last year.
And many laid off workers will not be able to return to their former jobs. As many as 25 percent of jobs may never come back, Joseph Brusuelas, chief economist at consulting firm RSM, recently told Politico.
Part of the problem is that even businesses that survive the downturn are going to be wary about expanding to fill the market gaps left by their defunct peers. Small businesses, which are naturally less risk-tolerant than their large counterparts and have access to fewer resources, will be especially cautious about growth.
That’s why simply “reopening the economy” won’t put everyone back to work. We also need a strategy for incentivizing existing small businesses to swiftly scale up and make room for rehiring the unemployed.
U.S. policymakers need new tools for revitalizing entrepreneurship and leveraging its potent job-creating abilities. To that end, the Progressive Policy Institute (PPI) has proposed a new Startup Tax Credit that incentivizes entrepreneurs to quickly increase employment at their small companies, giving even existing companies a startup-like boost.
Modeled on the Earned Income Tax Credit, the Startup Tax Credit would be a refundable tax credit tied to the number of employees and payroll at a small business.
Conservatives call the House Democrats’ Health and Economic Recovery Omnibus Emergency Solutions (HEROES) Act a “gigantic political scam.” Senate Republicans say HEROES, passed by the House on May 15th, is “dead on arrival when it reconvenes. As they negotiate with Democrats, Republicans should think carefully about certain student loan relief provisions in the bill.
Even in good times, a substantial portion of 45 million Americans’ paychecks go to student loan payments rather than to goods and services that keep our economy churning. There’s little doubt that this debt contributes to suppressed consumer consumption, which stifles economic growth. In this bad time, Americans collectively owe $1.6 trillion in student debt. This debt burden is now dramatically heavier with the economic shutdown and coming diminished post-pandemic employment opportunities.
Some say no additional student loan relief is needed because the Coronavirus Aid, Relief and Economic Security (CARES) Act that Congress passed in March temporarily suspended student loan payments. That would be a decent argument if CARES applied to everyone, but it doesn’t.
The U.S. House of Representatives is moving ahead with plans to vote today on the Health and Economic Recovery Omnibus Emergency Solutions (HEROES) Act: the fifth – and potentially final – a piece of major legislation addressing the coronavirus pandemic and its economic effects. The 1800-page bill is estimated to cost roughly $3 trillion and contains a mix of both good policies and bad but is perhaps most notable for what it leaves out: automatic stabilizers.
The biggest flaw with previous relief bills was that aid was limited by the availability of funds appropriated by Congress or arbitrary calendar dates it chose instead of being based on the real needs of our economy. As a result, measures like the Paycheck Protection Program (PPP) were exhausted within three weeks and many eligible businesses couldn’t get needed financial relief until Congress took additional action. The best way to prevent this problem in the future is by adopting “automatic stabilizers” — policies that cause spending to rise or taxes to fall automatically as predetermined economic or public-health benchmarks are met. For example, a proposal by Congressman Don Beyer and Senators Jack Reed and Michael Bennet would change the expansion of unemployment benefits included in the CARES Act to gradually phase out as the economy recovers instead of expiring arbitrarily on July 31st. The centrist New Democrat Coalition has also been vocal in calling on leadership to adopt automatic stabilizers in future relief bills.
Unfortunately, the HEROES Act doesn’t include any new automatic stabilizers – reportedly because House Speaker Nancy Pelosi is concerned about the bill’s $3 trillion price tag. On the one hand, Speaker Pelosi is right to be concerned about wasting taxpayer money on unnecessary expenses given our nation’s serious long-term fiscal challenges. But the unfortunate reality is that supporting our economy during the worst public health crisis of our lifetimes is a large and necessary expense. It is no less fiscally responsible to pass one $3 trillion bill than three $1 trillion bills if the money is efficiently targeted to support our economy throughout this pandemic. Moreover, there are a number of costly provisions included in the HEROES Act that are a poor trade-off for sacrificing automatic stabilizers.
Yesterday, the WSJ published an investigation with the headline: “Amazon Scooped Up Data From Its Own Sellers to Launch Competing Products.” As the article notes, in a Congressional hearing last year, an Amazon associate general counsel said, “We don’t use individual seller data directly to compete” with businesses on the company’s platform. The reporter for the WSJ claims to have seen evidence of Amazon managers violating this self-imposed rule in order to improve its private label goods business (i.e., Amazon-branded products).
There are two issues at play here. First, there is the question of whether Amazon violated Section 5 of the FTC Act by engaging in “unfair and deceptive practices” in order to entice third-party sellers onto its platform. Amazon is currently conducting an internal investigation into what occurred and a Congressional committee has already said it will be looking into the matter. These investigations are necessary and worthwhile for determining what exactly happened and who knew what when.
The second issue is about antitrust law. Stacy Mitchell, the executive director of the Institute for Local Self-Reliance, said, “An exec testified in July that Amazon doesn’t use data from sellers to create its own rival products. Turns out it does. This is monopoly behavior, hence the coverup.” But as Doug Melamed, a professor at Stanford Law School, said in comments about the situation, “Using the data to improve product offerings is not, and ought not be, unlawful under US law. The issue is whether Amazon obtained the data by misappropriation or misrepresentation.” Professor Melamed is correct on the question of antitrust law. To understand why, it’s useful to discuss the history of the retail industry and how it works today.
1. All major retailers use data on what sells in stores to build their private label businesses
It is common practice for retailers, including grocery stores and department stores, to use data to develop their own store brands to directly compete with name brand products. As Benedict Evans, an independent analyst, put it in reaction to the story, “It can be pretty entertaining to watch critics of Amazon discover ‘retail.’” The practice of using information about which products are selling well to develop private label goods is nearly as old as the retail industry itself. Sears launched its catalogue business in 1888. By 1927, the retailer was selling its own tools and appliances under the Craftsman and Kenmore in-house brands.
These days, selling private label goods is practically de rigueur for a company competing in the retail industry. Here are the shares of revenue from private label goods for some leading retailers according to data compiled by Morgan Stanley:
Kohl’s: 46%
JCPenney: 44%
Target: 33%
Kroger: 25%
Macy’s: 20%
Lowe’s: 20%
Costco: 20%
Office Depot: 20%
Dollar General: 20%
Walmart: 15%
By comparison, Amazon share of total retail sales from private label goods is only 1% (excluding its proprietary electronics such as Echo voice assistants, Fire TV, and Ring doorbells). As Jack Hough writes for Barron’s, “Private labels work best for products with decent turnover and excessive margins. […] Remember when HDMI cables sold for $30 a decade ago? Now, you can find them for $7.” Most private label goods are commodities akin to HDMI cables. The large and concrete benefit of lower prices to consumers outweighs the negligible effects on innovation (the HDMI cable has reached its final state and requires no new investment).
2. Amazon is not dominant in retail
While private label goods may be ubiquitous in retail, some critics argue that Amazon is so dominant it’s qualitatively different from when other retailers do it. Hal Singer, a managing director at Econ One, argued as much on Twitter: “It’s not just that Amazon has access to better information. It’s that, unlike a grocery chain, Amazon is DOMINANT PLATFORM PROVIDER.” But retail is a much more competitive market than many realize. For instance, Amazon is still much smaller than Walmart. Here are US retail sales figures for 2018 (the most recent year of data):
Walmart: $388 billion
Amazon: $121 billion
Kroger: $120 billion
Costco: $101 billion
Walgreens: $98 billion
Home Depot: $97 billion
CVS: $84 billion
Target: $74 billion
It seems difficult to argue that it’s a problem when Amazon uses data to inform its private label business, but not when a company more than three times its size ($388 billion vs. $121 billion) does the same thing at a rate 15 times higher (15% vs. 1%).
3. Online retail platforms are more open to competition than physical stores
But maybe it’s something special about the online retail market as opposed to the brick-and-mortar retail market? Perhaps sellers feel they have no option but to sell on Amazon if they want to sell online? That doesn’t seem to be the case. According to data from eMarketer, more than half of Amazon sellers also sell on eBay. Slightly less than half sell on a personal website as well. More than a third also sell on Walmart. It also seems worth noting that prior to the internet, third-party sellers had no option at all for selling directly to consumers. They had to negotiate with one of the big box retailers for placement on store shelves. Online platforms give them a new channel for reaching customers directly.
4. Retailers don’t have private data on cost structures for manufacturers
So, private label goods are not unique to Amazon in the retail industry and the company does not have a dominant position in the market. But maybe because Amazon is a “tech” company it has much more data than brick-and-mortar retailers and therefore has an anti-competitive advantage? Shaoul Sussman, a legal fellow at the Institute for Local Self-Reliance, tried to make that argument:
The key here is ad spend on Amazon! In the past, Amazon claimed that it only uses data that is widely available to brands-including sales, product ranking, and the like. But the amount a brand spends on ads is private information that only Amazon has!
I can reverse engineer the majority of another brand’s cost-including shipping, referral, and storage fees — but the missing piece would be ad spend! That is key for 2 reasons: (1) actual margins (2) how much the brand has to boost the product to hit optimal sales volume.
Sussman’s claim that a retailer could “reverse engineer the majority of another brand’s cost” is unfounded. No retailer has nonpublic information about the vast majority of a manufacturer’s fixed costs (property, plant, and equipment) or variable costs (raw materials, labor, etc.). Knowing the amount spent on shipping, storage, and marketing is only a small fraction of a company’s cost structure. Understanding marketing costs is helpful, but that doesn’t mean Amazon knows the cost structure of manufacturing the product. In some cases, that might be publicly available information. But that means every other competitor has access to it, too.
Yes, Amazon has more data than rival brick-and-mortar retailers (particularly on what consumers look at but never purchase), but the jury is still out on how much of a competitive advantage this affords them relative to big players like Walmart (which also has its own online marketplace and spends more on IT per year than Microsoft and Facebook). And even if this is an advantage, that would not necessarily be an antitrust issue if it’s used to deliver consumer benefits. (Of course, that does not absolve Amazon of the need to truthfully represent to sellers how it’s using that data.)
5. The only difference between a platform and a retailer is inventory risk
Sussman thinks there is another key difference in Amazon relative to other retailers:
Amazon is a *retailer*, a *platform*, and a *producer*. I have no problem with them using the data they have as a *retailer* to develop products — just like Walmart. I do have a problem with Amazon using information they gather as a *platform/ad biz.*
First, it’s important to know that ad fees on Amazon are analogous to slotting fees in brick and mortar stores. Brands have been paying for promotion in retail long before the e-commerce revolution. Prime shelf space and prime search rankings are both scarce resources that are auctioned off to the highest bidder. According to data from the Center for Science in the Public Interest, food manufacturers spend 70% of their marketing budgets on these “trade promotion fees” and 30% on advertising. At the end of the day, it’s all marketing.
Second, while it’s true that Amazon is simultaneously a retailer, producer, and platform, this is not economically different from traditional retailing. I’ve already explained how legacy retailers also engage in private label and are therefore “producers.” And while they are not “platforms” in the technical sense of being open to anyone (sounds… anticompetitive), the business model is not significantly different.
Traditional retail charges a markup on the price paid to wholesalers or manufacturers (a percentage of the final retail price). The retailer can either purchase that inventory outright and assume the risk of it not selling, or it can include a “sale or return” provision, which reserves the retailer the right to return the inventory to the wholesaler or manufacturer if it does not sell. Inventory risk is just another cost and can be traded off with other contract provisions during the negotiating process.
Platforms, on the other hand, do not take custody of the inventory and instead provide services to sellers. In exchange, the platform charges a percentage of the final retail price. Whether it’s a platform or a retailer, the business is the same: Partner with companies selling goods and collect a profit margin on the final retail price. The rest is just accounting.
Conclusion
In the debate over private label goods, it’s important to keep in mind why consumers prefer them. According to survey data from Nielsen, 70% of people say they purchase private label brands to save money. This is unsurprising as private label goods tend to be less expensive than name brand goods while offering similar levels of quality. It’s as clear an example there is of direct horizontal competition.
While the FTC should look into the allegations that Amazon violated its own Chinese wall — and therefore misled sellers — politicians such as Senator Warren and Congressman Cicilline are conflating a consumer protection issue with an antitrust issue to support their own ideological crusade. Contrary to what they may claim, the accusations of antitrust violations in this case are dubious.
Here’s a good rule of thumb: The companies or industries that actively expand during a recession often become the leaders in the recovery that follows. For example, housing starts actually rose in the 2001 recession, foreshadowing the coming housing boom. The financial crisis of 2008-09 was also marked by the early years of the Apple iPhone, leading into the App Economy and the wireless boom of the past ten years.
And now, in the middle of the pandemic-caused economic crisis, companies like Amazon, Walmart, and Target continue to hire hundreds of thousands of workers to provide and deliver essential goods. As they add new workers, they also find themselves grappling with the ever-changing medical landscape of how the virus spreads and manifests itself in order to reduce the risks for workers and customers.
Indeed, the hiring leaders are also turning out to be the leaders in adopting new safety measures and new pay policies for dealing with the pandemic. To be sure, these safety measures are a moving target, as scientists learn more about the behavior of the virus. What is the new standard of safety that these companies are trail-blazing?
Temperature Checks: One of the main symptoms of COVID-19 is fever. To spot workers who were suffering from the virus, Amazon was an early adopter of daily temperature checks for workers. Walmart soon followed. Amazon has also moved towards using thermal cameras in some locations, a technology that might be easier for more companies to adopt.
Masks: Originally the CDC was discouraging non-medical personnel from using masks. That guidance changed. What also changed was a greater appreciation of the importance of controlling asymptomatic spread. As a result, companies are starting to distribute masks to slow the spread of coronavirus. Target is distributing masks and gloves to all of its workers at the beginning of their shift. Amazon provides masks to its employees and delivery service partners. Walmart is requiring all employees to wear masks.
Testing: As we noted here, workplace-based testing by businesses is key. Amazon is exploring building what it calls scaleable testing capacity that could be used to regularly test all of its workers. So far no other company has come out and directly talked about developing their own testing capacity, but it’s clear that others would follow if workplace-based testing became possible.
Pay Policy: Labor markets function even during a pandemic. Leading companies have boosted pay for essential workers offering bonuses and temporary hourly wage hikes. Target raised wages by $2 per hour. Walmart boosted pay in its fulfillment centers by $2 per hour, and added a cash bonus for hourly associates. Amazon increased pay for hourly employees by $2 per hour in the U.S., C$2 per hour in Canada, and €2 per hour in many EU countries, and doubled the regular hourly base pay for every overtime hour worked.
These pay changes were all billed as temporary. But unlike seasonal pay hikes, the pandemic is not going away any time soon. Moreover, there’s a word that economists use, hysteresis, which means effects that persist after the initial causes giving rise to the effects are removed.
These companies are now the leaders, setting the trends for safety measures and pay policies. As the U.S. economy reopens, other businesses will be following their path.
As of Thursday, April 9, Treasury and the Federal Reserve are finally starting to set set up the facilities need to use the $500 billion in funds for “severely distressed sectors” contained in the $2.2 trillion CARES relief act. The money has to be allocated by December 31, 2020.
In this initial round, the Fed is stepping up to lend $600 billion to small and medium-sized businesses; $850 billion to bond issuers to fund corporations and household borrowing for items like automobiles; and $500 billion to support state and municipal liquidity. This lending is backed up by $195 billion in Treasury funds from the CARES act.
What should Treasury and the Fed do with the rest of the $500 billion? Some will go directly to the airlines and industries essential to national security, like airplane manufacturing.
But Treasury must think strategically as it decides how to dole out the money over the rest of the year.
In our previous blog post, we wrote about the importance of keeping the food/essentials supply chains open. With hundreds of millions of Americans stuck at home, having a dependable source of food is essential to avoid panic and to stay the course on social distancing. That’s not optional.
We equally stressed the importance of the health and safety of the workers in the food supply chain. That’s also not optional. And it’s not just Walmart, or Amazon, or Kroger–it’s every company in the food supply chain that faces the same problem of workers in distribution centers or stores getting infected and potentially spreading it to their coworkers and customers.
Walmart and Amazon are understandably bearing the brunt of criticism, because of their size and their sophistication. Both companies are putting into place similar measures. Amazon is ramping up to do temperature checks of every employee at their entire U.S. and European operations network and Whole Foods Market stores by next week, and distributing millions of masks. Walmart is doing roughly the same thing, with the roll-out of fever checks taking somewhat longer.
But this is the moment of truth for Walmart, Amazon, and the rest of the food supply chain. As more is learned about the virus, the standard of care will evolve. These companies must move pro-actively as that happens, including reorganizing tasks to increase distance between workers and tightening screening of potentially ill workers.
Moreover, workers need to be compensated for their risk. Amazon says that “…we expect to go well beyond our initial $350 million investment in additional pay, and we will do so happily.”
The food supply chains must remain open. Workers must be protected and compensated. It’s not a choice.
Get ready for the biggest economic and financial roller coaster of all time. Policymakers in the United States and around the world are opening up the monetary spigots full bore and limbering up spending packages on an unimaginable scale. This comes after more than a decade of low interest rates. In the United States, Congress has passed a $2.2 trillion pandemic package.
Let’s assume for the moment that progress is made on the health front against COVID-19, since the alternative is too horrifying to think about. If we look out ahead, are Americans moving into an era of amazing deflation, stunning inflation, or both?
In the short run, the sheer disruption of the sudden lockdown advocated by the health experts is going to send both demand and prices plunging. Goldman Sachs is forecasting a 24% plunge in GDP in the second quarter. Domestic demand for non-food, non-health goods will collapse, export demand will fall, factories will close. It will be a moment of supreme deflation, combined with an overwhelming–and deeply saddening–surge in virus-related deaths.
But then, like a tsunami wave, trillions of dollars of Federal Reserve funding and Treasury payments to individuals and businesses will finally come roaring onto shore. Demand should soar for all sorts of goods and services that the global economy is too disrupted to provide in quantity. The most likely outcome: A new era of rising prices like we have not seen since the 1970s.
That surge of inflation, if it happens, will present policymakers with a very tough choice–tighten up monetary and fiscal policy and potentially send the economy back into recession, or accept the inflation surge. The choice won’t be a choice–higher inflation will seem infinitely preferable to another downturn.
Instead, if we’re lucky, we’ll see a slow 3-5 year withdrawal of fiscal and monetary stimulus, as government loans are paid back, budget deficits are reduced, interest rates are raised, and excess funds are withdrawn from the financial system. Eventually the global economy comes back to normal–whatever normal will be.
The outbreak of COVID-19, caused by the novel coronavirus, has created a global market downturn and put the United States on track for its first recession since the 2008 financial crisis. Quarantines, social distancing, and other proactive measures that are necessary to contain the pandemic are already limiting commerce and disrupting global supply chains, essentially ensuring that the U.S. economy will contract for at least some period of time in 2020.1 Policymakers must adopt a combination of thoughtful public health and macroeconomic policy measures that will limit the damage caused by both this and future recessions.
Congress has already taken two strong first steps. On March 6th, President Trump signed legislation that provided $8.3 billion in emergency funding for public health agencies and coronavirus vaccine research.2 Now the U.S. Senate is debating the Families First Coronavirus Response Act: a far more expansive bill carefully crafted by House Democrats to further bolster public health agencies and provide economic support to the people and businesses most likely to be harmed by the disease.3 This bill temporarily increases federal Medicaid and food-security spending, makes coronavirus testing available to patients free of charge, expands unemployment insurance benefits, mandates employees afflicted with the virus be given 14 days of paid sick leave, and creates a refundable tax credit to provide them with up to 12 weeks of additional paid medical leave, among many other things.4
Although these measures were a great start, much more will be needed. For example, the sick-leave mandate – which is essential for discouraging potentially infected employees from spreading the disease to their coworkers – covered just one fifth of workers after concessions were made to win Republican support.5 Many otherwise financially healthy businesses face the threat of going bankrupt as the crisis chokes off their cash flows, further increasing unemployment and perpetuating a vicious cycle of weakening demand.6 Millions of Americans may be unable to make their rent or mortgage payments, causing both homelessness and instability in the financial sector.
The Federal Reserve’s target interest rate has been reduced to zero percent, meaning it has already used its most potent tool for fighting a serious recession.7 But fortunately, low interest rates also make it cheaper than ever for Congress to borrow money to provide needed economic stimulus. Importantly, the current crisis is somewhat different than previous recessions in that most consumer spending will be constrained by limits on opportunities for commerce rather than a lack of money in their bank accounts. It is therefore more important than ever that stimulus money be targeted towards those who are most in need and most likely to spend. At the same time, a stimulus package must be aggressive enough to prevent an economic contagion that spirals into another financial crisis, or worse, a second great depression.
The best way to accomplish this goal is through the expansion of “automatic stabilizers” – policies that cause spending to rise or taxes to fall automatically when the economy contracts. These policies are more responsive to real economic needs because they are unconstrained by the political processes that often slow the passage of discretionary stimulus. Moreover, as the economy recovers, well-designed automatic stabilizers will actually reduce federal budget deficits and help pay back the debt that was used to finance stimulus.8 This proven structure prevents stimulus from being prematurely shut off (as it was following the 2008 financial crisis) and removes fiscal concerns as a political impediment to essential borrowing.9
This report provides a framework for new automatic stabilizers and other measures that will both combat the coronavirus recession and better prepare the United States for others that come after it. The Progressive Policy Institute recommends that policymakers prioritize giving relief to people who either lose their job or are already low-income, since both groups have a higher propensity to spend any money they receive than those who are economically secure. People and businesses should be given increased financial flexibility to inject liquidity into the market and prevent unnecessary bankruptcies during the crisis. The federal government should provide relief to cash-strapped state governments so that they are not forced to cut back their own spending and counteract federal stimulus. Finally, policymakers at all levels of government should cut taxes that discourage consumption, particularly those applied to industries hardest hit by the crisis.
It turns out that the digital infrastructure was far more ready for disaster than the health infrastructure. Led by Google, AT&T, and Amazon, the top ten American tech and broadband companies have spent over $300 billion in capital investment in the past two years (the rest of the top ten, in alphabetical order, includes Apple, Charter, Comcast, Facebook, Intel, Microsoft, and Verizon). These companies have been building data centers,expanding wired and wireless networks, constructing ecommerce fulfillment centers, and otherwise. And it’s a good thing they did, as the coronavirus crisis forces millions of Americans to move their entire lives online.
Note: These are the top ten tech and broadband providers in our latest Investment Heroes report. However, this number represents all capital expenditures by these companies, both U.S. and foreign. As such, it is not directly comparable to the domestic capital spending numbers presented in our Investment Heroes report.
The outbreak of COVID-19 (commonly known as coronavirus) has created a global market downturn and raised the prospect that the United States could enter its first recession since the 2008 financial crisis. Last night, President Donald Trump and U.S. House Speaker Nancy Pelosi offered two competing approaches for securing both the health and economic security of the American people. While the president’s proposals would arguably do more harm than good, Speaker Pelosi and House Democrats should be commended for swiftly developing a comprehensive and serious plan to effectively tackle the crisis.
During the last recession, Speaker Pelosi passed a stimulus bill that used a combination of deficit-financed tax cuts and government spending increases to boost the economy. With interest rates on government debt now below projected inflation, many are calling for her to now take similar action. The problem is that commerce is currently being constrained by proactive measures people are taking to limit the spread of a pandemic, not a lack of money in consumers’ pockets. Additionally, the coronavirus has disrupted global supply chains, which no amount of demand-side stimulus can alleviate in the short term. A unique economic problem requires a unique solution.
It’s the S-word–shortages. The greatest manufacturing nation in the world, but we can’t make enough masks and other protective gear for our frontline healthcare workers? The coronavirus crisis points out what many of us already knew–globalization is not enough to provide the flexibility and surge response that the U.S. needs. Apparently in medical emergencies, countries do what you would expect–cut off exports and keep supplies of critical medical equipment for their own people. And it’s not just China–France and Germany are also restricting exports of medical supplies.
Medical supplies are just the tip of the iceberg here. As has become clear, the U.S. needs a more flexible and diverse manufacturing sector, able to pivot when needed and quickly handle surges in demand and shortfalls in supply. Strategic inventories are all well and good, but you can never predict exactly what is going to happen, whether it’s an environmental disaster or the unfortunate specter of war.
As I wrote in a new column in Forbes, the coronavirus epidemic “has illustrated the fragility of global supply chains, and the potential problems with having too much global production concentrated in China. In February, for example, Coca-Cola, for example, warned of possible disruptions in the supply of sweeteners coming from China. Other industries, from steel to pharmaceuticals, face similar potential problems.”
But we don’t need investment in conventional factories, which in ordinary times can’t compete. What’s needed is a sustained push for digital manufacturing, which is potentially far more flexible than conventional manufacturing. It’s like the difference between a point-to-point telephone system and an Internet built on general purpose routers and processing node. The conventional telephone system, built on copper wires, worked very well for making voice calls, but was hard to reposition for other uses. The Internet can not only handle voice calls, but excels at all sorts of new tasks.
Luckily, here’s one case where good policy is good politics. PPI recently released a new poll conducted by Pete Brodnitz. The poll surveyed 1500 registered voters in Michigan, Pennsylvania and Wisconsin in early-to-mid February, three swing states that will be critical for the 2020 presidential election in November.
The poll showed that 73% of the respondents in these three states favored a federal role in promoting manufacturing-related jobs in the United States, an overwhelming majority. Moreover, the support was stronger among Republicans and independents than among Democrats. Such a program could be crucial in a tight race.
We’re not talking about a conventional industrial policy that picks winners and losers. Rather, progressives should support the development of a flexible digital manufacturing sector that can quickly adapt to changing circumstances, whether it’s a medical emergency, an unexpected growth in demand for electric vehicles, or political hostilities. The program would provide short-run demand stimulus to keep people working, medium-term incentives for digital investment (which we wrote about here), and a long-term research program for flexible digital manufacturing processes. Good policy–and good politics.
As economists who care about inequality, we cheer when Amazon and other ecommerce sellers open up new fulfillment centers in areas where job growth has been slow and opportunities limited. In fact, we have pointed out in the past that because these mammoth centers require large amounts of land and good road connections, they are well-suited for outlying areas that may have been left behind by the tech boom and the decline of American manufacturing.
Oddly enough, a coalition of labor unions disagree. In a new petition presented to the Federal Trade Commission (FTC), the coalition accuses Amazon, in particular, of choosing to “knowingly distance its warehouses from tighter local labor markets” and place them instead in looser labor markets where workers have a “paucity of options.” According to the petition, siting fulfillment centers in economically weak areas represents “anti-competitive” employment practices.
My reply: If I could, I would have all of corporate America follow the strategy of putting new job-creating operations in places where people actually need the jobs! Note that I am not talking about moving existing operations—that’s just a zero-sum game. Rather, expanding into new areas is an important way of closing the economic gap between the thriving cities and the left-behinds.
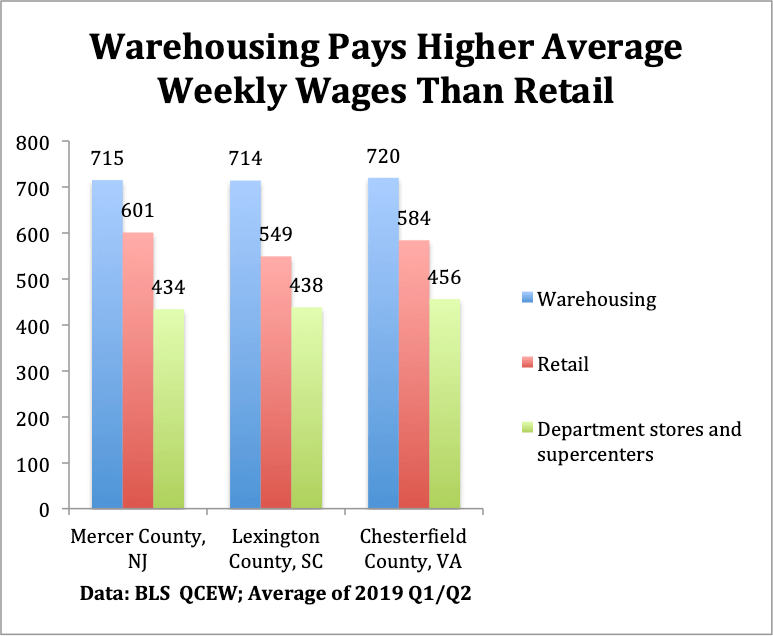
Looking at the petition in more detail, it argues that Amazon is driving down wages by expanding into what it calls “concentrated” labor markets. In particular, the petition focus on three counties: Mercer in New Jersey,; Lexington in South Carolina; and Chesterfield in Virginia. The petition claims that these examples show that Amazon is using its size to hold down wages.
But here’s the problem with that argument: in all three counties, warehousing jobs are only 3-4% of the local labor market, and Amazon is only a portion of those. For example, Mercer County is a huge and tremendously diverse labor market situated between, containing major employers such as Princeton University, Bristol-Myers-Squibb, and the state of New Jersey. In February 2020, job aggregator Indeed.com reported almost 3000 job postings for Mercer County. (Lexington County and Chesterfield County both had about 1000 job postings that month,). These are hardly “concentrated” markets where one company can have monopsony power hiring workers.
The petition cites BLS data on average weekly and annual pay in the warehousing industry as evidence that Amazon drives down wages. For example, in Lexington County weekly average wage and salaries in the warehousing industry fell from $849 in 2010 to $697 in 2012, after Amazon opened up its fulfillment center.
But in order to interpret this change, it’s important to understand the background. In 2010, there were only 147 workers employed in Lexington’s warehousing industry, down from 261 in 2007. That’s 147 with no zeroes at the end, including all the managers, and forklift drivers who had managed to outlast the deep recession.
This tiny warehousing employment was economically irrelevant for the Lexington county economy, which included 75,000 workers in 2010. And the shrinkage of the warehousing industry presumably meant that no young (and relatively cheap) managers and workers were being hired. To put it in economics terms, no warehousing jobs were available at the average wage in 2010.
Now there are more than 3000 warehousing jobs in the county. And to get there, a company like Amazon didn’t have to compete for workers with the existing warehousing operations in Lexington, which weren’t growing. Instead, the real competition was the broader labor market, and there the Lexington warehousing industry, led by Amazon, has been paying far better wages than retailers, and department stores and supercenters in particular. The same is true for Mercer and Chesterfield counties (Chart below based on averaging 2019 quarters 1 and 2. Data for quarter 3 will be released as of March 4).
To summarize: There’s precisely zero evidence that Mercer, Lexington and Chesterfield are concentrated labor markets. And the broader argument that companies engage in anti-competitive behavior by locating new operations in areas that need jobs is simply specious. For both political and economic reasons, we need more jobs spread across the country.
It’s too early to predict the fallout from the Houston Astros cheating scandal. But one thing is already clear: The players who participated and drove the signal-stealing scheme will not be fined or suspended. Following an internal investigation, Major League Baseball Commissioner Rob Manfredconcluded that with the wide scope of players involved, and the reality that many have now moved to other teams, taking disciplinary action against players would be “difficult and impractical.”
Meanwhile, Citigroup, a global banking behemoth, just suspended the head of its lucrative High Yield Bond division in London for repeatedly skipping out on his lunch bill.
Pushing the envelope to gain an edge has always been ingrained in baseball’s culture, from pine tar to spitballs. Now, with the advent of modern technology and exponentially larger revenue and payrolls, the pressure to cheat is stronger than ever. The same can be said (and quite often has been said by some leading presidential candidates) about Wall Street.
The failure of the app intended to collect results from the Democratic caucuses in Iowa wasn’t the best advertisement for the App Economy. But we have to remember that apps play a central role in the economy.
As part of a global project measuring the size of the App Economy, we estimated the U.S. App Economy to have 2.246 million App Economy jobs as of April 2019. That’s an increase of 30 percent from our December 2016 estimate of 1.729 million jobs.
Many of them are at large corporations in tech hubs like the Bay Area, New York City, or Austin. But App Economy jobs aren’t exclusive to the tech sector or major cities. In fact, a growing number have seeped into smaller metro to rural areas, the physical industries, as well as startups.
For instance, as of February 2020, small IT firm Four Nodes was hiring a mobile application developer with experience in Android in Camden, Delaware. Kent Displays, which makes e-writing displays, was looking for a mobile app developer in Kent, Ohio. Federal Home Loan Bank of Des Moines was searching for a lead IT service desk analyst with knowledge of Android and iOS in Des Moines, Iowa. Television broadcasting company CBS was seeking a frontend engineer with experience in iOS and or Android development in Louisville, Kentucky.
In terms of App developing companies, Little Rock-based Apptegy is an education technology startup that allows administrators to tailor how they market their school. Leawood, Kansas-based Farmobile allows farmers to collect and share data with agronomists and other farmers. And Fargo, North Dakota-based WalkWise uses a walker attachment to track fitness data and send alerts using its mobile app.
Indeed, the ability to code from anywhere coupled with apps’ integration with the physical world (which accounts for roughly 80 percent of the economy) has democratized opportunity in these areas for businesses and consumers alike. And the Internet of Things, which will enable individuals and companies to use mobile apps to interact with physical objects and processes such as their home, cars, equipment, and warehouses, only promises to increase the interaction between apps and the physical world.
Here are some examples of App Economy jobs in the physical industries: as of February 2020, agricultural merchandiser Tractor Supply Company was hiring a mobile apps IT architect in Brentwood, Tennessee. Medical device company Medtronic was looking for a senior software quality engineer with experience in iOS and Android in Chanhassen, Minnesota. Manufacturing company IDEX was searching for a QA test engineer with knowledge of iOS or Android in Huntsville, Alabama. As of January 2020, ecommerce company SupplyHouse.com was seeking a senior Android developer in Melville, New York.
From this perspective, apps play a critical role in spreading the information revolution beyond the traditional metro hubs and tech sector. They serve as an important means to unlocking growth for smaller metro and rural areas, the physical industries, and startups.
After signing nearly $5 trillion of new debt into law since taking office, President Trump’s Fiscal Year 2021 budget proposal provides the clearest look yet at how he intends to govern if re-elected in November. The ironically titled “Budget for America’s Future” is anything but: it proposes to slash critical public investments that lay the foundation for long-term growth, double down on reckless tax cuts for the rich, undermine health-care and safety-net programs for millions of Americans, and leave the nation on a path of trillion-dollar deficits as far as the eye can see.
The Trump administration claims its proposals would put the federal budget on a path to balance by 2035, but this relies upon economic assumptions that are downright absurd. The Office of Management and Budget projects real gross domestic product will grow more than a full percentage point faster than does the non-partisan Congressional Budget Office every single year between 2020 and the end of the projection period. That annual difference may not sound like a lot, but it adds up: the Trump administration’s fiscal estimates depend on the U.S. economy producing nearly $25 trillion more in output over the next decade than CBO projected in its most recent budget and economic outlook.
These outlandish economic growth projections enable the Trump administration to claim that it will raise $3.1 trillion more in revenue over the next decade relative to CBO’s baseline, when in reality the administration is proposing tax cuts that would actually reduce revenue. Trump proposes to extend the individual income tax cuts created by the GOP’s 2017 tax law past their scheduled expiration in 2025. But interestingly, even as Trump proposes to extend tax cuts for wealthy individuals, his budget would not extend the few expiring business provisions that some economists believe could potentially increase domestic business investment. This omission is further evidence that Trump is underestimating the cost of his policies while overestimating the boost they would give to economic growth.