Tomorrow morning, the House Judiciary Committee will mark up a series of antitrust bills that, taken together, would stifle digital innovation and hinder the United States in economic competition with China.
Alec Stapp, Director of Technology Policy at the Progressive Policy Institute (PPI) released the following statement:
“Economic concentration in many sectors of the U.S. economy is a serious issue that demands scrutiny and creative responses from lawmakers. Unfortunately these five bills fail to grapple responsibly with this challenge. Instead, they single out a handful of America’s most innovative and globally competitive tech companies for divestiture and draconian regulation. These bills would be a major blow to job creation and innovation even as our economy struggles to recover from the pandemic recession.
“We hope the Members of the House Judiciary Committee will stand up for American workers, consumers and entrepreneurs by refusing to join in an ideological crusade to dismantle “big tech.” While well-tailored regulation is certainly worth debating, the extreme provisions written into these bills would do more harm than good, and set us back in our fight against foreign dominance in the tech/e-commerce industry.”
Earlier this year, PPI released a new report on job growth in the tech/e-commerce sector, which found that this sector is now the top job creator in the U.S. economy. The sector generated more than 1.2 million net new jobs from 2016 to 2020, including during the pandemic. On average, pay in the tech/e-commerce ecosystem was 44% higher than average pay in the private sector and 21% higher than average pay in manufacturing nationally. The report also found that the growth of tech/e-commerce jobs has expanded beyond the coasts and regions known as tech innovation hot spots, including growth during the pandemic in Arizona, Ohio, Texas, Indiana, and Florida.
The Future of Mobility: Navigating the Data Value Chain
Hosted by the Mack Institute for Innovation Management at Wharton University
The ability to move people and goods easily is key for thriving in business and society today. The worldwide disruption caused by mobility restrictions due to the coronavirus pandemic is stark proof. At this conference, the Mack Institute will bring together industry professionals, researchers, and policy experts, and will explore current mobility challenges, such as the pandemic’s impact on ride-hailing and public transit, as well as opportunities.
Date: Tuesday, June 22, 2021
Time: 1:30-2:20 p.m.
Panel:
Scott Snyder Senior Fellow, Mack Institute for Innovation Management; Adjunct Faculty, Penn Engineering, University of Pennsylvania
Michael Mandel Senior Fellow, Mack Institute for Innovation Management; Chief Economic Strategist, Progressive Policy Institute
A new report released today by the Progressive Policy Institute (PPI) offers new solutions to closing the connectivity gap and expanding access to broadband across the country. The report, titled “A Radically Pragmatic Agenda to Connect Rural America,” is authored by Dr. Michael Mandel and Elliott Long.
“We have a once in a lifetime opportunity to finally connect all of rural America, but only if we don’t repeat the mistakes of the past. It’s time for the Biden administration and Congress to work together to bring broadband to unserved communities across America and reach the president’s target of 100% connectivity. By following our pragmatic roadmap, the United States can finally achieve this goal,” said report authors Dr. Michael Mandel and Elliott Long.
The report outlines the main issues impeding access to broadband in rural areas, and provides radically pragmatic solutions to cut government red tape and target broadband regulations so the industry is more efficient. The Progressive Policy Institute’s roadmap includes these key principles:
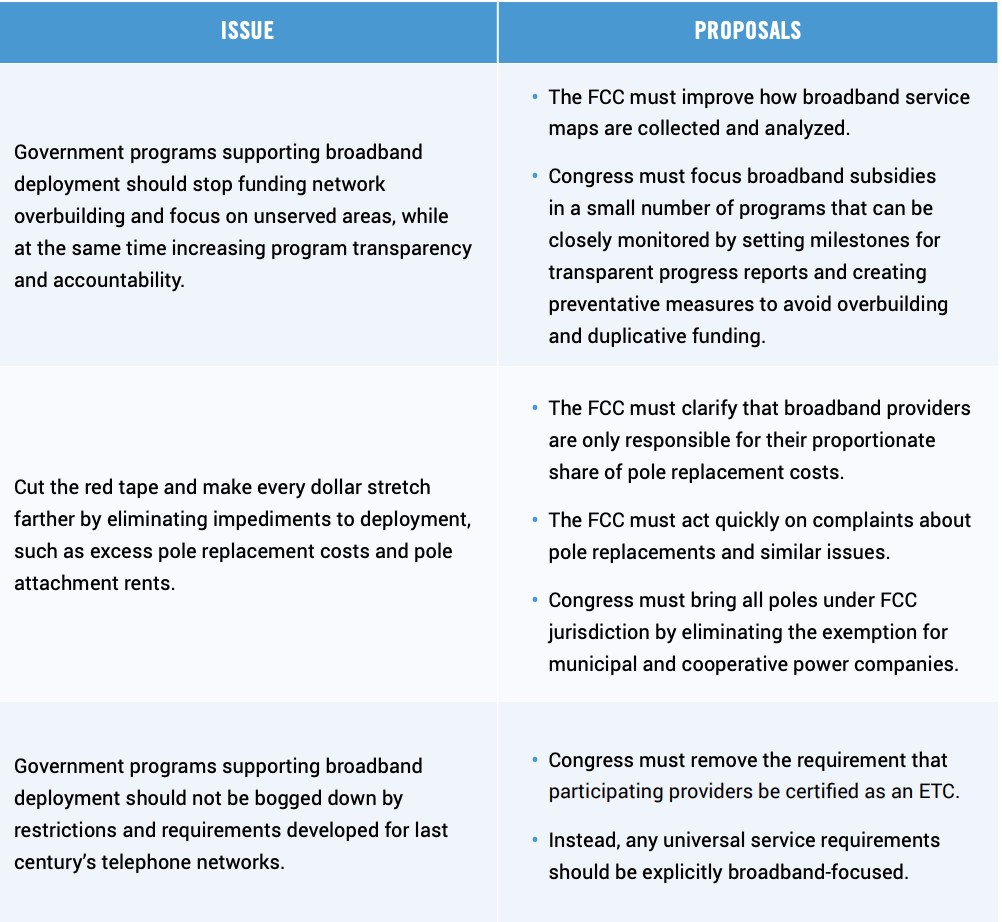
History shows us that government programs supporting broadband deployment should stay away from funding network overbuilding and focus solely on unserved areas. To achieve the goal of 100% connectivity, Congress needs to increase program transparency and accountability.
The Federal Communications Commission (FCC) and Congress need to make every dollar stretch further by eliminating expensive impediments to rural deployment. These include excess rents for attaching broadband cables to existing utility poles and being forced to bear too much of the share of replacing poles that were already aging.
Government programs supporting broadband deployment should not be bogged down by restrictions and requirements developed for last century’s telephone networks. In particular, Congress should remove the requirement that participating providers be certified as “Eligible Telecommunications Carriers.” This category, dating back to the 1996 Telecommunication Act, discourages providers that are best suited to build in rural areas.
The report also finds America has comparatively made remarkable progress in connecting rural communities. However, gaps remain, and the ongoing pandemic has only brought the consequences of those gaps into sharper focus. The Biden administration must require pro-competitive, innovative, and efficient broadband policies that streamline rural broadband deployment.
The Progressive Policy Institute (PPI) is a catalyst for policy innovation and political reform based in Washington, D.C. Its mission is to create radically pragmatic ideas for moving America beyond ideological and partisan deadlock. Learn more about PPI by visiting progressivepolicy.org.
The COVID-19 pandemic showed the strength of broadband networks in the United States, yet it also underscored that all Americans need — and deserve — better access to the economic, educational, health care, and civic opportunities that have moved increasingly online.
Fortunately, closing the rural broadband gap has gained bipartisan support and is a priority for both Congress and the White House. President Joe Biden’s American Jobs Plan calls for $100 billion in federal funding to bring high-speed broadband coverage to 100% of Americans, including those living in rural areas that have been left behind. Data collected by the Federal Communications Commission (FCC) indicates that nearly 5% of the U.S. population does not have access to fixed broadband service that provides a minimum of 25 megabits per second (Mbps) download and 3 Mbps upload — the so-called “25/3” standard the FCC currently uses as the definition for “broadband.”
The light touch regulatory approach in the U.S. has encouraged substantial private investment for broadband networks in both urban and suburban areas of the country. Over the past quarter century, the broadband industry has invested almost $2 trillion to build infrastructure that brings broadband access to nearly 96% of Americans. This is commendable progress and unparalleled innovation, but it is simply not enough when more than 14.5 million Americans are unable to access high-speed internet (25/3 Mbps) at home, and more than 11 million of those people live in rural areas.
This paper examines past achievements and failures to close the rural broadband gap and proposes pragmatic changes to ensure that future attempts to connect rural America are poised for success.
Broadband Funding Challenges
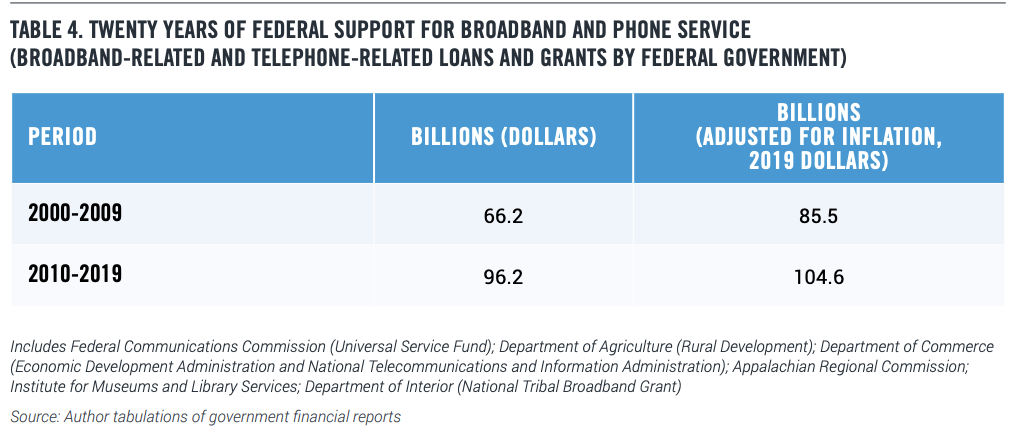
As policymakers work toward a solution, history tells a cautionary tale about how easy it can be for federal funding to be misspent in ways that do not appreciably contribute to enhancing rural broadband access and closing the digital divide. By our count, the federal government has spent $105 billion on broadband- and telephone-related initiatives from 2010 through 2019, on top of $86 billion from 2000 to 2009. (These figures include both grants and loans and are reported in 2019 dollars).
Where did this federal money go? Some of it went toward expanding access and closing the rural broadband gap and achieved measurable success. In particular, the Connect America Fund Phase II (CAF II) and Rural Digital Opportunity Fund (RDOF) reverse auctions conducted by the FCC in 2018 and 2020 allowed providers to bid for the right to provide subsidized broadband service to unserved locations at the lowest cost to the government. The reverse auctions were troubled in some important respects, as this paper will discuss, but hold the potential to extend broadband service to rural areas if revamped. However, overall progress has been slow and does not appear commensurate with the substantial federal funding over the past two decades, especially in unserved rural areas of the country where the cost of broadband deployment is especially high.
The problems with past funding efforts fall into three categories:
Subsidizing broadband construction in areas that already have service: Previous programs and outdated coverage maps have included “underserved” as well as “unserved” areas, which quickly puts rural areas without service into competition for scarce funds with urban and suburban areas that already have service. “Future-proofing,” while sounding seemingly reasonable, makes subsidy programs far more expensive and far less targeted on connecting rural areas. One example: If a broadband subsidy program sets an expansive goal of two providers with service of at least 100 Mbps, then fully 33% of the nation’s urban population would become eligible for funding, squeezing out rural areas without service.
Utility pole owners charging excess fees for pole attachments and replacements: Exorbitant pole fees can delay the deployment of broadband in rural areas because they effectively serve as a tax, deterring providers and inflating the cost of a build out. Based on data from the CAF II auction, we find that depending on the scenario, the high pole fees charged by co-ops and muni utilities can reduce broadband deployment by 17% to 55%.
Broadband funding programs setting rules that discourage participation by many providers: Federal broadband funding programs such as RDOF often limit participants to “Eligible Telecommunications Carriers,” a seemingly innocuous requirement dating back to the 1996 Telecommunication Act. However, this requirement, by imposing potentially open-ended legacy voice obligations, discourages providers that are best suited to build in rural areas.
Pragmatic Principles for Fixing the Rural Broadband Problem
The pandemic demonstrated the growing and immediate importance of every American having access to sufficient internet speeds for work, school, health care, and social activities. President Biden and Congress seem ready to provide a sizable pot of money to bridge the digital divide gap. But no matter how many billions of dollars are allocated, history shows that the money can be spent unwisely if policymakers are not careful.
This paper will dive deeper into the challenges with previous funding programs, what has worked, and where the challenges remain. While the focus of this paper is on access and not affordability, it’s important to note that only 2.6% of personal consumer spending went to “communications services” — a basket including all consumer outlays on cable and satellite television, video and audio streaming, wired and wireless phone service, and internet service — in 2020 and fell by 3% from 2007 to 2020. At the same time, internet service providers (ISPs) have set up programs to make broadband more affordable to low-income families, which have successfully brought millions of previously unconnected Americans online.
All of this suggests we may have found a proper balance between affordability and investment, notwithstanding the apparent gap in access for rural communities. We recommend three pragmatic principles for ensuring that the rural broadband access gap is closed.
We have a once in a lifetime opportunity to finally connect all of rural America, but only if we don’t repeat the mistakes of the past. The funding for broadband after the financial crisis of 2008-2009 was supposed to close the rural accessibility gap, but the programs were mismanaged and spread out over far too many unrelated purposes. It is time to bring broadband to all of the unserved people across America and to reach the president’s target of 100% connectivity. By following this pragmatic roadmap, we can finally achieve this goal.
Broadband and the Pandemic
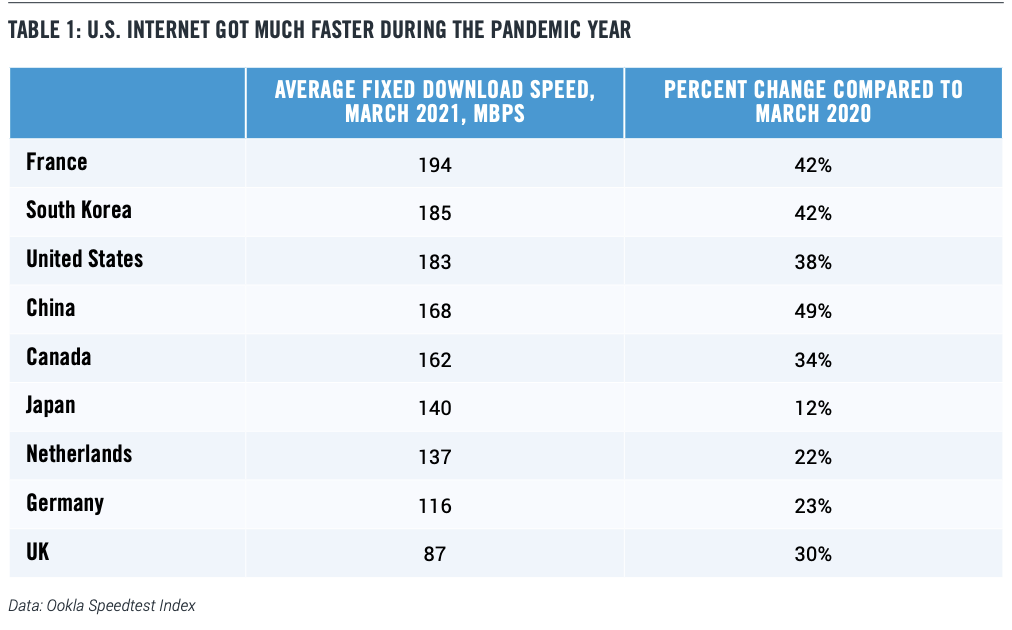
The COVID-19 pandemic has shown the strength of broadband networks in the United States. Faced with an unprecedented shift to virtual work, education, and entertainment, the nation’s broadband networks barely shrugged in handling the dramatic increase in use. Download speeds dipped very slightly at the beginning of the pandemic, then quickly rebounded. Meanwhile, the decline in download speeds in major European countries was much deeper, lasted longer, and required government officials to step in and ask YouTube, Netflix, and other streaming services to downgrade their content to prevent the internet from breaking.
Moreover, the speed of the U.S. broadband network continued to rise during the pandemic year. Average fixed broadband download speeds rose by 38% between March 2020 and March 2021, according to Ookla data. As Table 1 shows, the U.S. is clearly in the top tier of major countries based on average download speed and performance improvements, along with South Korea, China and France, and well ahead of Japan, Netherlands, Germany and the United Kingdom.
The successful and resilient performance shown by U.S. broadband networks both in the early stages of the pandemic and the year that followed was a direct result of the substantial private investment made by the U.S. broadband industry over the past quarter century. From 1996 to 2019, the broadband industry invested $1.78 trillion to build infrastructure that brings broadband access to nearly 96% of Americans.
The triumph of this private investment should remove and relieve any lingering doubts as to the relative merits of the U.S. light-touch approach to broadband regulation over the more heavily regulated, utility-style common carrier approach favored in Europe. Indeed, OECD figures show that U.S. telecommunications investment per capita in 2018 was more than twice that of Europe.
The substantial discrepancy in investment per capita can be traced to the markedly different broadband network investment incentives that have existed for some time. In the United States, ISPs own their networks and have an incentive to invest, whereas Europe has pursued the “leased access” path where transmission lines are leased at heavily regulated rates, thereby reducing the incentives for wireline incumbents to further invest in their networks for fear of not getting a sufficient investment return. The success of U.S. broadband networks during the current COVID-19 crisis is clear and worthy of the praise it has garnered from all sides. As the Broadband Internet Technical Advisory Group wrote in an April 2021 report, “available data suggests that the internet has performed well during the pandemic … and is a testament to the importance of continued investment in robust Internet infrastructure in all parts of the ecosystem.” The report went on to note that “ISPs reacted to the sudden demand increase by rapidly adding extraordinary amounts of new capacity and pledging to Keep Americans Connected.”
In 2020 the FCC also ran the Rural Digital Opportunity Fund (“RDOF”) reverse auction, which allocated $9.2 billion to 180 bidders over 10 years to provide broadband to 5.2 million locations, at an average bid of $177 per location per year. That’s the average amount of public support that providers will get if they provide the level of broadband that they bid for. Of course, the public support covers only part of the cost of rural broadband, with private sector providers in particular drawing on private funding to make up the difference.
RDOF followed in the heels of the FCC’s first broadband reverse auction (CAF II). CAF II allocated $1.49 billion over 10 years to 103 bidders to provide access to over 700,000 locations. That’s an average of $209 per year per location in public support. Reverse auctions like RDOF and CAF II have potential for funding network build-out in rural areas, with some important changes that we discuss later.
Understanding the Broadband Gap: Where Are We?
When the FCC unveiled the National Broadband Plan in 2010, it identified broadband as “the great infrastructure challenge of the early 21st century.” How well have we met that challenge so far?
The plan set the National Broadband Availability Target at “[a]ctual download speeds of at least 4 Mbps and actual upload speeds of at least 1 Mbps.” While this seems excruciatingly slow today, that target was mostly in line at the time with similar national targets in countries such as France, Germany, and the United Kingdom. The FCC estimated that 14 million people, or 4.5% of the population, did not “have access to terrestrial broadband infrastructure capable of meeting the National Broadband Availability Target.” As the plan said:
…it is unlikely that private investment alone will fill the broadband availability gap. The question, then, is how much public support will be required to fill the gap … An FCC analysis finds that the level of additional funding required is approximately $24 billion (present value in 2010 dollars)
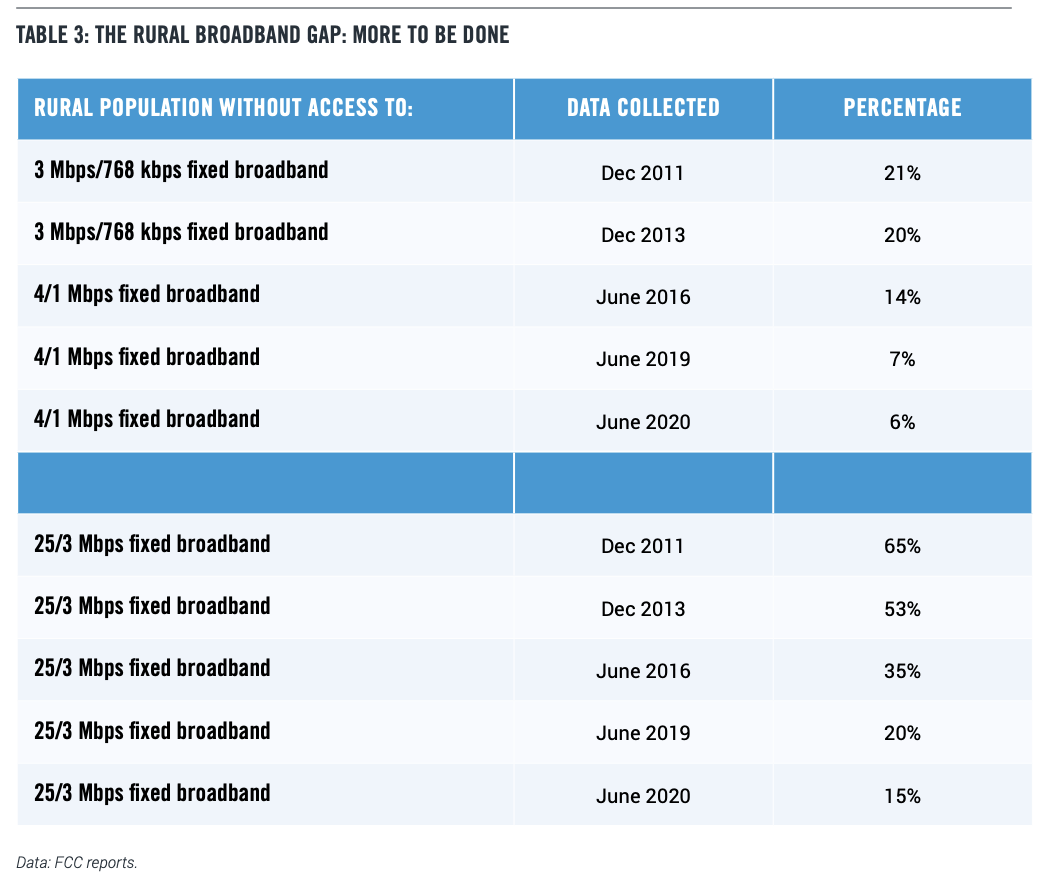
Today, 1.8% of the population does not have access to 4/1 terrestrial broadband, mostly in rural areas. This represents a bare minimum for emails.
The 2010 broadband plan also had a 10-year goal that “[a]t least 100 million U.S. homes should have affordable access to actual download speeds of at least 100 megabits per second and actual upload speeds of at least 50 megabits per second.” Today, there are roughly 130 million households in the U.S. and roughly 92% of Americans have access to 100/10 service according to June 2020 broadband deployment data. So, the download speed goal from 10 years ago has been met. These gains were made mainly through private investment. Presentations to the FCC in 2010 cited $350 billion as the estimated cost of giving every American household access to 100 Mbps service, which was virtually non-existent at that point.
This paper focuses on issues of access, not affordability. Still, it is worth noting that this mass deployment of broadband has not broken the bank for American households. Since the business cycle peak of 2007, internet access has been getting cheaper relative to most other goods and services, according to the Bureau of Economic Analysis. From 2007 to 2020, the price of internet access only rose by 4% (Table 2). US Telecom reports that the price of the most popular tier of broadband service fell by 20% from 2015 to 2020, while offering almost 16% faster service. By contrast, the overall price index for consumer spending on goods and services rose by 22% over the same stretch, while the price of eating out at restaurants rose by 43%.
We also analyzed the changing price and spending for what we call “communications services” — a broad basket including all consumer outlays on internet access, cable, and satellite television, video and audio streaming, and wired and wireless phone service. This broad basket illuminates not just the price of broadband but the way that broadband is used to enable other services.
We found that the price of communications services fell by 3% from 2007 to 2020. Moreover, we calculate that only 2.6% of personal consumer spending went to “communications services” in 2020. That’s equal to the average since 2000, with no sign of an upward trend. People are aware of how much they spend on broadband, but they forget about the long distance and local telephone bills that they used to pay.
The average, of course, doesn’t tell us about what low-income families are spending. However, major ISPs have set up programs to make broadband more affordable to low-income families, which have successfully brought millions of previously unconnected Americans online. According to an April 2021 study from BroadbandNow, 77% of Americans have access to low-priced wired broadband plans, up from 50% a year earlier.
The Rural Broadband Gap
This paper focuses on the persistent rural broadband access gap.23 While almost everyone has access to 4/1 broadband service, as Table 3 shows, the FCC’s 2020 Broadband Progress Report identifies 25/3 broadband as the target level for broadband services. That is sufficient, for example, to enable a Zoom connection for group video calls, according to the company’s published requirements.
However, by that goal, 15% of rural Americans still do not have access to sufficient broadband — a significant gap. Moreover, as discussed later in this paper, this figure almost certainly underestimates the percentage of rural Americans that are unserved by broadband.
Why the rural broadband gap? Despite the declining cost of broadband and robust competition, fixed broadband remains out of reach for many rural Americans, due largely to the economic costs and engineering challenges involved with connecting remote areas. Fewer potential customers within reach of each mile of new infrastructure means less potential revenue over time to pay back the upfront cost of the infrastructure investment.24 Indeed, deploying a robust broadband network over the wide expanse of rural areas requires not only the substantial costs to deploy wires over long distance, but the increased costs for those wires to attach to, and in many cases to replace, exponentially more poles as compared to a smaller and more densely populated urban environment.
The United States is far less dense than a country like South Korea, which is less than half the size of Minnesota with 10 times as many people. That is why connecting everyone in South Korea is easier than in the United States.
But low average density is not the only issue. The United States also has the disadvantage of a very spread-out population — many rural areas with low but significant populations. By contrast, countries like Australia and Canada have low average density, but their populations are very concentrated, making them easier to serve. In Australia, 90% of the population live in 4% of the land, concentrated on the coasts. In Canada, 90% of the population live in 3% of the land. By contrast, in the United States, 90% of the population is spread out over 31% of the land area.25 That’s a whole different engineering challenge.
As a result of these geographic and demographic characteristics in the United States, the economic margin for error for rural broadband is small for providers and the potential return on an investment is challenging. Significantly, broadband providers who build in rural areas cannot expect 25 years of technology stability and protected markets. Broadband speeds have been a moving target. What was acceptable in 2010 is no longer acceptable today. Broadband providers must upgrade their systems at substantial cost to stay current with technology, thereby further narrowing the margin for error.
Moreover, fixed broadband providers in rural areas face competition from alternative technologies such as mobile broadband, fixed wireless, and satellite internet. One can debate endlessly the degree to which a mobile connection is a full substitute for fixed broadband but that’s not the point. People who mostly use a limited number of applications such as email, e-commerce, and social networks may choose to only spend on their smartphone subscriptions, which eats away at potential revenues for fixed broadband providers, yet another reduction in the razor thin margin for error to deploy rural broadband.
Public Subsidies for Rural Broadband
Given the economics of broadband deployment, it’s clear that public subsidies have and will continue to play a critical role to make broadband infrastructure economically viable in many rural areas of the country. To date, substantial federal resources have been devoted to deploying rural broadband. For this paper, we undertook a detailed look at how much federal agencies have spent on broadband and telephone-related initiatives over the past 20 years. (We count federal spending on telephone service in the total because the earliest broadband efforts focused on DSL (digital subscriber line), which ran over ordinary telephone lines).
Our analysis shows the federal government has spent $104.6 billion on broadband- and telephone-related initiatives from 2010 to 2019 (Table 4). That’s on top of $85.5 billion spent from 2000 to 2009. These totals include both grants and loans, and are reported in 2019 dollars.
The biggest sum has come from the FCC, including the agency’s Universal Service Fund (USF) program. Funding for the USF program does not come from general tax revenues, but from telecommunications service provider contributions, the cost of which is typically passed through to consumers. The USF provided support through four programs: the High Cost program (now known as the Connect America Fund), which supports the extension of advanced communications networks to rural, insular, and high-cost areas; the E-rate program, which helps rural and urban schools and libraries obtain affordable telecommunications services and broadband; the Lifeline program, which supports low-income users; and the Rural Health Care Program, which provides funding to eligible rural health care providers for telecommunications and broadband services.
In addition to the USF, the federal government has launched multiple initiatives intended to increase broadband availability and usage, including massive efforts from the Departments of Agriculture and Commerce, and small independent agencies like the Appalachian Regional Commission and the Institute for Museum and Library Services.
The Lessons of the Past
Why hasn’t this federal expenditure been enough? Why hasn’t the rural broadband gap closed more as a result of this massive funding? While the substantial investment by the federal government demonstrates and confirms the importance policy makers have placed on broadband connectivity throughout the United States, including rural areas, the high level of, and long-standing, federal support has not delivered the universal connectivity many hoped for and expected. Indeed, most of these federal rural broadband initiatives cannot even provide a specific number as to how many previously unconnected homes were connected during the initiative.
It’s clear in retrospect that much of the money was not correctly targeted. Let’s consider, in particular, the American Recovery and Reinvestment Act (ARRA) of 2009. Like the postpandemic infrastructure proposal, ARRA used a major economic downturn as a springboard to solving the rural broadband problem.
ARRA included more than $7 billion intended to expand access to broadband in rural areas — $4.7 billion to the National Telecommunications and Information Administration (NTIA) for the Broadband Technology Opportunities Program (BTOP) and $2.5 billion to the Rural Utilities Service (RUS) at the Department of Agriculture for the Broadband Initiative Program (BIP).26
BIP missed its mark in a number of ways. In January 2011, the RUS administrator provided a report to Congress that said the program would connect nearly 7 million rural Americans.27 But “RUS admits it’s not going to provide better service to the 7 million residents it once touted; instead, the number is in the hundreds of thousands,” according to a 2015 Politico investigation.28
BIP also mishandled hundreds of millions of dollars in funding intended to connect rural Americans. The Politico investigation concluded 42 broadband infrastructure projects RUS initially awarded were canceled, rescinding more than $300 million in loans and grants. The cancellations meant as many as 430,000 residents in rural areas did not benefit from new or improved connections. Politico also found around 150 of the total 297 BIP projects had not drawn down their awarded funds as of the July 2015 investigation, leaving $277 million in potential investment that could be clawed back by Congress.
Where RUS did fund projects, they were unable to tell who they actually served. Politico noted:
In May (2015), the agency reported it has delivered new or improved services to 213,000 households and more than 15,000 businesses. But RUS, as it collected that data from awardees, never asked whether those residents live in unserved, neglected rural towns, or areas that had some broadband access before the Recovery Act.
Indeed, “RUS does not track subscribership by rural area,” a 2014 Government Accountability Office (GAO) report recognized, concluding “RUS has not shown how the approximately $3 billion in funds awarded to BIP projects have affected broadband availability.”29
A broader criticism leveled not just at BIP but at RUS as an agency is that RUS often awarded projects outside of rural areas. An April 2011 study analyzed three projects subsidized by BIP that received a total of $231.7 million in support and found “RUS’ history of funding duplicative service has continued under BIP “with [m]ore than 85% of households in the three project areas … already (being) passed by existing cable broadband, DSL and/or fixed wireless broadband providers.”30 A September 2005 audit by the Office of the Inspector General at the USDA (before the creation of BIP) found that due to RUS’s ambiguous definition of what constituted a rural area, “the agency has issued over $103.4 million in loans to 64 communities near large cities.”31 The audit also found RUS approved $137.4 million in loans despite borrowers’ applications being incomplete or inaccurate, $59.3 million in approved grants and loans not to have been spent, and $30.4 million in loans being in default due to inadequate servicing.
BTOP, the other major broadband program funded by ARRA, shows what happens when a federal subsidy suffers from too many goals, beyond connecting unserved rural households. The single most expensive infrastructure project funded by BTOP was $155 million towards improving the Los Angeles public safety communications systems.32 That may have been a worthwhile project, but Los Angeles is not an unserved rural community.
Two other expensive infrastructure projects funded by BTOP were connecting “community anchor institutions” like schools and hospitals in West Virginia and Maryland with fiber. Once again, these may have been very worthwhile projects, but they explicitly were not designed to build out broadband connections to unserved households. “I was disappointed in the impact that the infusion of $126 million had,” the West Virginia state secretary of commerce told a reporter in 2017. “I would have thought it would have had more impact than it did.”33
Beyond BIP and BTOP, other broadband funding initiatives spent federal money on building networks that didn’t add to rural connectivity. For example, in 2012, the Department of Commerce’s Economic Development Administration (EDA) gave a grant of $2.1 million to San Leandro, California, a middle-income suburb of San Francisco, to build a fiber optic network, even though the Bay Area is probably one of the most wired regions in the world.
In 2017 the EDA gave $1.9 million to the City of Eugene in Lane County (Oregon), home of the University of Oregon, to fund the installation of fiber-optic cable in Eugene’s Central Business District area. True, the rural residents of Lane County might have needed some broadband assistance, with 52% not having access to 25/3 fixed broadband in 2017.34 But overbuilding in the center city did nothing to help them. That same government money could have been used to provide broadband to 2,000 rural households who don’t have it now.35
How Federal Funding for Rural Broadband Is Wasted
As we have just seen, the United States has far too much experience with programs that are supposed to deliver better broadband to rural areas but fail to reach their objective. In this section we will consider in more depth the specific reasons why these efforts did not succeed. In particular, we can identify three categories of problems with previous broadband funding initiatives:
Subsidizing broadband construction in areas that already have service. This issue includes imprecise mapping; overbuilding of existing networks and focus on “underserved” rather than “unserved” areas; and the desire of municipalities to build their own networks. All of these divert federal funds away from closing the rural broadband gap.
Excess charges for pole attachments. The key element for wired broadband connections in rural areas has always been the attachment of lines to existing electric and telephone poles and the replacement of obsolete poles. Much of the cost in rural areas is not simply the labor to attach the lines, but the price paid to the owners of the existing poles. In particular, the FCC does not have the power to regulate pole attachment fees for cooperative and municipal utilities.
Broadband funding programs often discourage participation from key providers. For historical reasons, broadband funding programs, including the FCC reverse auctions, limit participants to “Eligible Telecommunications Carriers.” We will show how this apparently innocuous requirement, dating back to the 1996 Telecommunications Act, acts to discourage providers that are best placed to build in rural areas, by imposing certain legacy voice obligations that are potentially very costly. We will discuss each of these in turn.
Subsidizing Construction in Areas that Already Have Service
It is clear from the history of past broadband programs that running broadband to unserved rural areas is expensive, while building additional networks in urban or suburban areas is much cheaper. As a result, the first step in closing the rural broadband gap is to make sure that money is getting to where it is needed most and not overbuilding areas which have service already.
Imprecise Mapping
Currently fixed broadband providers file Form 477 twice a year, which consists of a list of census blocks where the provider offers service to at least one location. This data forms the basis of the broadband deployment reports that the FCC issues annually, and the rural broadband coverage estimates cited earlier in this paper.
But Form 477 does not give a full picture of unserved areas, since just because one location is served doesn’t imply anything about the rest of the census block. Indeed, some studies conclude that the true number of unserved Americans is twice the official figure.36
For this reason, in August 2019, the FCC launched a new process called Digital Opportunity Data Collection (DODC) for collecting more granular data on broadband coverage.37 DODC includes requirements for fixed broadband providers to submit geospatial polygon coverage maps like mobile operators do depicting the areas where they offer service, a public map reflecting where fixed broadband is and is not available, and a crowdsourcing portal allowing consumers and governments to submit input on the accuracy of the data.
In March 2020, the bipartisan Broadband Deployment Accuracy and Technological Availability (DATA) Act was signed into law.38 Congress put aside $65 million for broadband mapping as part of December’s COVID-19 relief bill. The FCC set up a Broadband Data Task Force to coordinate the agency’s mapping efforts.39
With geospatial polygon maps, broadband operators will submit where they either supply or could supply service within a reasonable time, providing more detailed, granular data on broadband coverage. Such shapefile mapping will provide more accurate information about which areas are truly unserved, which in turn will prevent overbuilding and ensure that limited taxpayer resources are targeted to closing the gap for those who have lacked access to broadband for too long.
The Soft Fallacy of ‘Underserved’
Better mapping will make it easier to identify which locations and areas are “unserved” — that is, don’t have access to the minimum target level of broadband. Currently under the RDOF program, an “unserved area” is a census block where no service provider is offering a fixed voice service and a broadband service with speeds of at least 25/3 Mbps (download/ upload), and no service provider has committed to offer such service under another federal or state broadband subsidy program.40 As noted above, as mapping gets more granular, the number of unserved locations will likely increase.
But the concept of an “underserved” area is much more ambiguous and troubling. For example, under RDOF, the FCC defined an “underserved” area as a census block that is only partially served by the target broadband service. That’s straightforward. But other organizations use the term “underserved” to mean less than two providers at the target service level. For example, the Wisconsin Public Service Commission defines an “underserved” area as a census block
… that is served by fewer than 2 broadband service providers, or an area that an applicant has demonstrated in its application is underserved.41
A 2020 Pew report on state broadband programs defined an “underserved area” as having:
… internet service at speeds higher than those that are defined as unserved but lower than those that have broadband service as defined by the state program.42
This vague definition simply means that state government sets two target levels, with the idea of encouraging areas to shoot for the higher one.
It seems innocuous to specify a stretch goal. But in reality, “underserved” becomes a way of justifying spending scarce federal funds in urban and suburban areas that already have broadband service, as opposed to rural areas that are actually unserved. For example, suppose that an “underserved” area was to be defined as one with less than two providers with service of at least 100 Mbps. Suddenly 42% of the population would live in “underserved” census blocks, including 33% of the urban population. The consequence is that the U.S. will have taken on a much more expensive task, and rural areas with no broadband service would once again be competing for funds with urban areas which already have broadband service.
To put it another way, the “underserved” concept encourages overbuilding of existing networks. Competition is a plus if it arises naturally. But if building an additional network in an urban area draws government funds away from rural areas without any service, then it moves us further from 100% coverage.
The Municipal Broadband Fallacy
One important case of the overbuilding problem is the question of municipal broadband networks in areas that already have existing broadband networks. The American Jobs Plan, proposed by President Biden, specifically called for “lifting barriers that prevent municipally-owned or affiliated providers and rural electric co-ops from competing on an even playing field with private providers.”
This is not the right place to consider the broad plusses and minuses of municipal broadband. Nevertheless, there is no evidence that municipal broadband networks outperform private networks. A 2019 paper from the Technology Policy Institute found no empirical support for positive effects of municipal broadband on employment or broadband subscription rates.43 Moreover, municipal broadband systems do not necessarily offer lower rates than private providers. For example, as of early 2021, a 1,000 Mbps broadband connection from publiclyowned Greenlight Community Broadband in Wilson (NC) cost $99.95 per month. In the nearby city of Raleigh, AT&T offered a 1,000 Mbps broadband connection at a promotional rate of $60/month and a regular rate of $60 per month.
If the federal government has a limited pot of money to fund broadband construction, it should go to connecting unserved rural areas, rather than subsidizing municipal networks that overbuild existing private networks. Municipalities have limited funding capacity and a multitude of potential uses, including roads and highways, airports (if applicable), and water systems. Charles City, Iowa, for example, was unable to raise the money in 2020 for a municipal fiber broadband system, putting the project on indefinite hold.44
Excess Charges for Pole Attachments
Sometimes what seems like a small problem can turn out to be a big one. Logically speaking, the easiest way to bring broadband to many rural households is by stringing the new connection along existing utility poles. Indeed, all comers must have access to the same set of poles, no matter who they are owned by, in order to provide critical services such as electricity, telephone, video, and now broadband service.
However, problematic behavior by rent-seeking pole owners makes the already difficult economics of rural broadband even worse. The owners of those poles — frequently the local electric and phone companies — can impose excessive non-recurring and recurring costs on broadband providers, which directly reduces their ability to deploy more broadband. Non-recurring costs include something called “complex make-ready” requirements where pole owners require broadband providers to bear the entire cost of replacing the poles they own. Recurring costs include the rental rates that “attachers” pay to maintain on-going access to poles year after year. Depending on who owns the poles and how they are regulated, these rates can vary dramatically.
Regulation is patchwork and inconsistent. Some poles — those owned by investor owned utilities and incumbent telephone companies — are regulated at the federal level or at the state level while other poles — owned by municipalities and electric cooperatives — are regulated at the state or local level or not at all.45 In addition, poles owned by the approximately 165 southeastern electric cooperatives and municipally-owned utilities supervised by the Tennessee Valley Authority are regulated completely separately from all other poles.46
Pole Replacement Issues
On top of the inconsistent approach to pole regulation, this infrastructure is aging and is not being maintained, updated, and replaced in a manner to ensure that we reach our goal of closing the digital divide for deployment of broadband to unserved rural areas. As a result, the time and expense required to replace aging poles and to pay attachment fees is a significant obstacle to broadband deployment in unserved areas. As noted in an NCTA filing to the FCC in 2020:
… in one major broadband construction project that has included (to date) over five thousand miles of new rural plant, Charter has encountered situations in which as many as one out of every twelve poles needs to be replaced, with the average replaced pole already several decades into its service life. In a major expansion to over 57,000 rural homes and small businesses, pole replacement costs alone have accounted for approximately 25% of the total cost of construction (including applications, surveys, permitting, labor, and material).47
NCTA further noted that “[u]tilities frequently treat deployment projects by broadband providers as opportunities to shift the utilities’ own inevitable infrastructure upgrade costs onto third parties.” The result is that broadband providers are effectively financing utility investors.
The FCC’s response to the NCTA petition in January 2021 made it clear that “it is unreasonable and inconsistent … for utilities to impose the entire cost of a pole replacement on a requesting attacher when the attacher is not the sole cause of the pole replacement.”48 Still, that ruling leaves questions open. The issue of how pole replacement costs are divided is especially important at a time when the federal government is likely about to lay out large sums to provide broadband to unserved rural areas. The more federal broadband subsidies that are diverted into paying for replacing utility poles, the more expensive closing the rural broadband gap will be. Pole replacement costs need to be allocated more fairly between pole attachers and pole owners if we are going to close the rural broadband gap once and for all.
The impact of recurring pole attachment fees on broadband deployment projects has been hotly debated. The National Rural Electric Cooperative Association (NRECA) has argued that pole attachment rental rates are not an important barrier to rural broadband deployment, accounting for only “a fraction of the overall cost to build broadband systems in rural areas.”49 Meanwhile the NCTA has argued that the rates pole owners charge to access the poles are “often excessive and can stop a broadband provider from being able to provide service to an area that lacks it.”50
To shed light on this debate, we can look at the results from the 2018 CAF II reverse auction. In both cases, each winning bid represents the broadband provider’s public assessment of how much public support it needs per location to make the proposed deployment economically feasible over the next ten years.
We can then compare the estimated cost of pole attachment fees per location with the size of the public support required for broadband deployment. That is the correct comparison, because it tells us how much of public support is being absorbed by the pole owners. In addition, the auction results allow us to estimate the “elasticity” of broadband deployment relative to pole attachment costs.
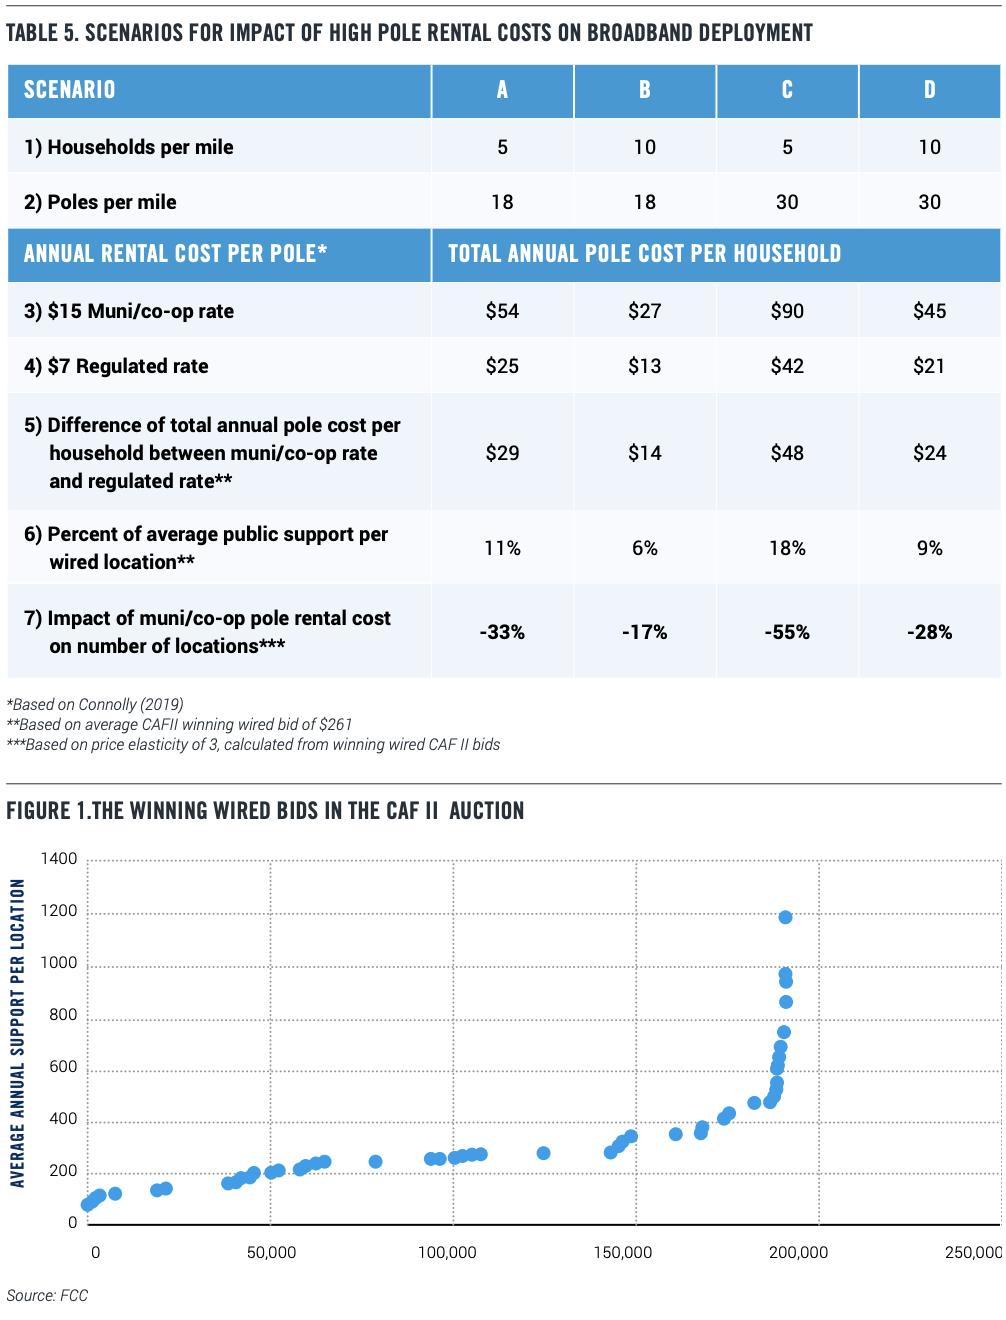
Based on the published numbers, we calculate that the average winning bid for wired broadband locations in the CAF II auction was $261 per location per year. That is, each bidder, on average, required $261 in support each year for each wired location to make the build-out worthwhile. (As this paper is being written, winners of the RDOF auction have not yet submitted enough information to determine which ones will be using wired technologies).
How does the cost of pole attachments affect these bids? It depends on the number of households per mile, the number of poles per mile, and the price elasticity of broadband deployment relative to public support per location. Table 5 lays out four scenarios, depending on different typical values of households and poles per mile for rural situations. The two values of rental cost per pole is drawn from a 2019 paper.51 The lower value corresponds to FCC-regulated poles, and the higher value corresponds to poles owned by cooperatives and municipal utilities, which are not regulated by the FCC.
Line (5) calculates the difference in total annual pole cost per household for the muni/co-op rate and the regulated rate, for each scenario. Line (6) shows that difference as a percentage of the average public support for winning wired bids. So, depending on the scenario, the higher pole rates charged by co-ops and municipal utilities absorb, on average, 6% to 18% of public support for rural broadband.
How much does that affect deployment? Figure 1 below plots the average annual support per location for the winning wired bids in the CAF II auction against the cumulative number of locations reached. (We omit the non-wired bids because they don’t depend on the cost of poles in the same way).
We see that the curve is quite flat around the average bid of $261, implying that bidders in the aggregate are behaving as if they are sensitive to the level of public subsidy or support. Indeed, a 10% change in net public support per location translates into a 30% change in the number of locations served.52
This calculation enables us to estimate the impact of higher pole attachment rates on broadband deployment. Depending on the scenario, the higher fees charged by co-ops and municipal utilities can reduce broadband deployment by 17% to 55%.
What’s happening is that the fragile economics of rural broadband is, at the margin, very responsive to increases in recurring charges. The data from the auction appears to be telling us that there is a very narrow window between the cost of rural broadband and what rural Americans are willing to pay — and excessively high pole charges push providers out of that window.
This analysis illustrates that high pole attachment charges effectively function as a tax that siphons away money that would have otherwise gone to building out more broadband to more locations in rural America. The tax can be levied because municipal and cooperative electric and phone utilities have unsupervised control over their poles and can therefore extract rents.
Regulatory Requirements that Discourage Provider Participation
Too often, broadband funding programs keep out, or strongly discourage, the very providers that could most effectively close the broadband gap. The FCC’s Universal Service program and its pivot to funding broadband is particularly instructive.53
With the advent of the internet, the FCC’s Universal Service mandate was expanded from voice only to include broadband. The agency tried several different approaches before settling on distributing funding via a reverse auction, where providers would bid for 10 years of public subsidy to build out broadband to specified locations.
However, even with these incremental successes in closing the rural broadband gap, there’s a fundamental problem with the Universal Service funding mechanism — it was designed for last century’s voice-centric world. This is perhaps best illustrated with the program’s “Eligible Telecommunications Carrier” (ETC) requirement — a threshold requirement for a carrier receiving support under the High Cost and Lifeline Support programs. The ETC requirement was borne out of the 1996 Telecommunications Act. At the time, an obligation to serve everyone made sense in a heavily regulated telecom world but was hard to square with the competition that Congress sought to generate in the Act.
The solution was to create the ETC designation.54 Only an ETC can receive Universal Service Fund support in the High Cost and Lifeline programs from the government for a given area. In exchange, the ETC for that area has sole responsibility and obligation as the telephone carrier of last resort.
The ETC designation is essentially composed of two sets of rules: the federal rules, found in Section 214(e) of the Act, and the state rules, which differ in each state and create a patchwork of regulations. Under the Act, the FCC is responsible for broadly defining federal universal service programs and the overall rules for ETCs. States designate providers as ETCs for a particular territory or “study area,” and states have the authority to apply additional requirements and create additional state universal service programs.
This can subject a provider to extremely burdensome regulation that differs state-bystate. State regulations cover topics as diverse as billing format and frequency, complaints, construction, customer notifications, deposits, interconnection, late fees, marketing, network outages, advertising, privacy, record retention, reporting, and accounting standards.
Most notably, ETCs cannot relinquish their voice provider-of-last-resort responsibilities without permission from the state. That permission will ordinarily not be given unless there is another ETC in the same area. A provider that accepts an ETC designation in an area with an existing ETC may find itself involuntarily becoming the voice provider of last resort if the original ETC chooses to relinquish its status.
In other words, the lure of ETC status conceals an expensive “poison pill” with potentially unlimited responsibilities which could be quite onerous, especially in a rural area. This could rationally deter broadband providers, especially large ones operating in multiple states, from seeking out FCC universal service funding to build out high-cost broadband in outlying rural areas. But how important is it in practice? Perhaps the ETC is a vestigial category that has no real effect?
To examine this question, we took advantage of a natural experiment: the CAF II auction required winners to get an ETC designation in order to collect the support funds. As a result, a whole group of winning bidders were going to states within a very short period to get ETC approval, allowing us to observe how different states handle the approval process. In some cases, the same bidders were applying to different states, so we had a direct comparison.
We examined state public utility commission proceedings and found that 26 states adopted an “aggressive” approach towards ETC approval of these potential rural broadband providers. We identified three characteristics of an aggressive ETC approval process.
Imposition of state-specific requirements, or
Intervention by local carriers, or
Reiteration and emphasis of provider-of-last resort responsibilities.
In terms of the first requirement, various states have their own rules that apply to ETC applications, such as “cream-skimming” rules in South Carolina and Wisconsin that determine the size of the territory that the ETC can request. This requirement can be waived at the choice of the utility commission, but it still represents another hoop that the carrier must jump through.
The provider-of-last-resort responsibility was explicitly referenced in multiple states. One provider, Tri-County (Tri-Co) asked the Pennsylvania Public Utility Commission (PPUC) for authorization as an ETC after winning support from the CAF II auction. The PPUC’s order granting the request made sure to emphasize the potentially unlimited nature of the obligations.
… if all other ETCs in Tri-Co’s particular designated service area relinquish their ETC designations, Tri-Co, as the competitive ETC, may be required to ensure that all customers served by the relinquishing carriers in their respective designated service areas will continue to be served.
In Indiana, Marshall County Fiber (MCF)’s application for ETC status was subject to the same explicit requirement.55 The Indiana Utility Regulatory Commission granted the application subject to several conditions: … as an ETC serving areas known to be unserved or underserved, MCF must respond to Commission inquiries regarding its ability to serve customers in the event
… an ETC serving the same designated service area or portions thereof seeks relinquishment of its obligations as an ETC … MCF committed to offer the services that are supported by the federal universal service support mechanisms.
The 26 states with aggressive ETC policies account for 58% of rural Americans without sufficient broadband.
It is not a coincidence that large providers have been mostly unwilling to bid for support in new areas, since the benefits of Universal Service support may be easily outweighed by the prospect of a burdensome and expensive ETC application process in multiple states that leads to being involuntarily trapped as a provider of last resort. This could make the economic margins for deploying rural broadband thinner still, or evaporate completely, thereby discouraging a larger provider’s rural broadband buildout that might have been fully realized with government funding.
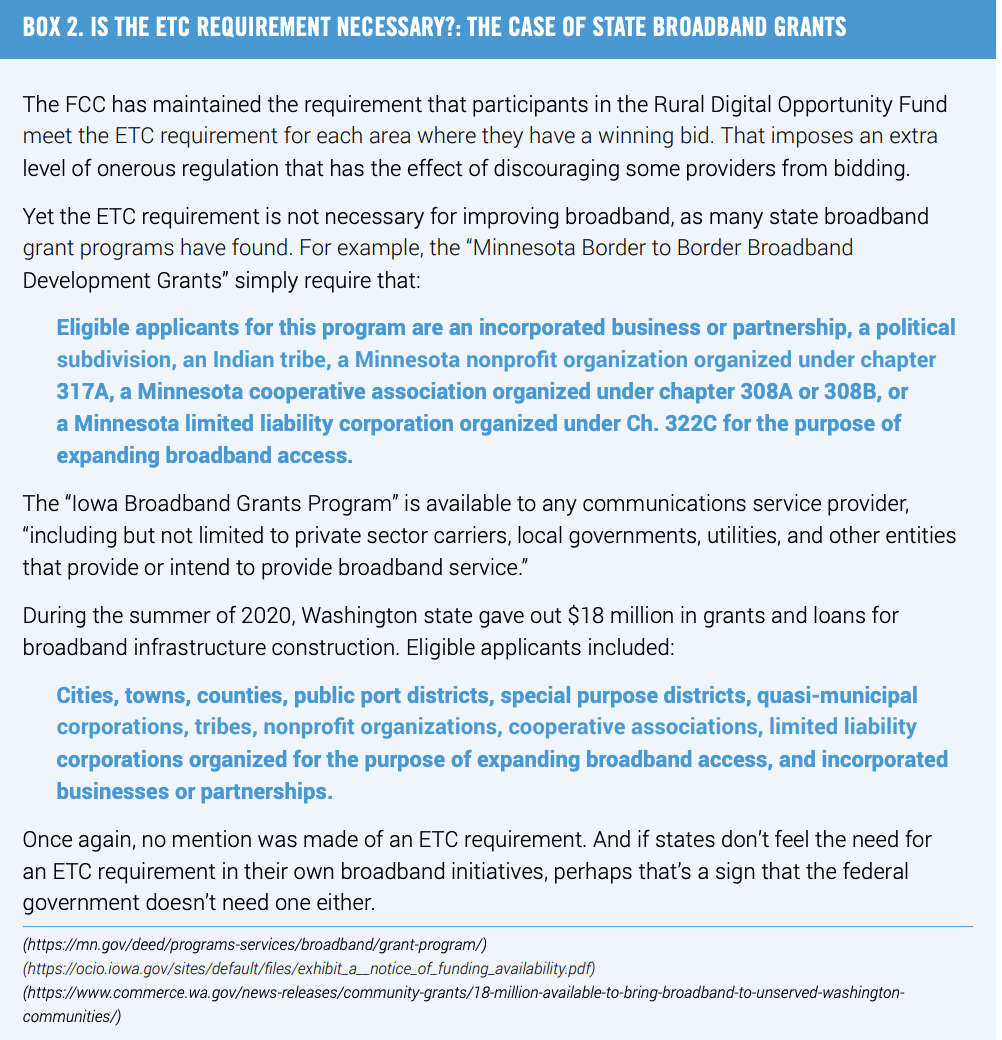
Significantly, ETC designations relate to telephone service only and do not include regulatory requirements for broadband. This shows that such a regulation makes no sense for programs focused on bringing broadband to areas that already have phone service (Box 2). Eliminating the ETC requirement will not undermine the FCC’s goals, all of which can be addressed more effectively with rules and requirements related to the broadband service that will be deployed.
Conclusion
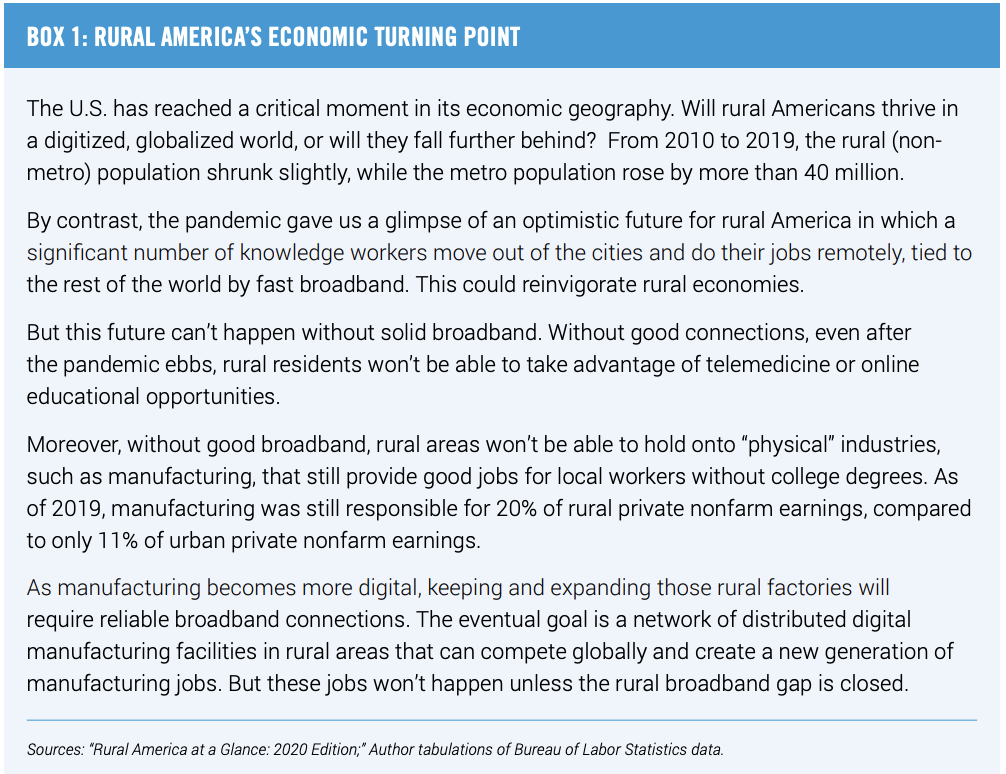
Here’s what we know. Rural broadband is essential for preventing the permanent stagnation of rural areas. We have made remarkable progress connecting rural America. But gaps remain, and the ongoing pandemic has only brought the consequences of those gaps into sharper focus. Without broadband connections, rural residents won’t be able to participate in the economic, political, cultural, and social life of America. Rural businesses won’t be able to take advantage of the technologies and market opportunities that suburban and urban businesses take for granted. And rural students will continually be at a disadvantage compared to their counterparts.
Moreover, without sufficient broadband, rural areas won’t be able to attract people and businesses from other parts of the country. Cheap real estate and low density can be a big draw to many Americans who now lead a high cost, urban existence — if they can stay connected to the rest of the world at the same time.
But rural broadband — for the very same reasons that make rural areas attractive as places to live — is an investment with a slim margin for error, or no margin at all. A low density of households means that building expensive infrastructure and charging reasonable prices is a tough combination. That makes government support essential.
The American Jobs Plan proposes $100 billion for broadband. Whether Congress ends up approving that figure or something smaller, the same questions remain: How to avoid the mistakes of the past, where a myriad of programs squandered resources on overbuilding without closing the rural broadband gap.
No matter how many billions of dollars are allocated, history shows that the money can be spent unwisely if we are not careful. The FCC has shown that reverse auctions like CAF II and RDOF, suitably improved, are a good starting point for getting providers to bid for the lowest amount of public support that they need. Better mapping, too, is essential for making sure that unserved communities get the broadband that they need.
The key step is to decide on the priorities. Some people are concerned with funding alternatives to existing systems. Other people are worried about broadband adoption rates, especially among low-income households. However, the economic evidence shows that the average share of household budgets going to communications services has been flat, not rising, and that the price of internet access has fallen compared to other goods and services. That suggests we may have found a good balance between affordability and investment.
Getting rural locations connected to fast broadband that supports uses like online education and telehealth is essential. Connecting the unconnected should be a priority. Moreover, we want our policies to be pro-competitive rather than protecting incumbents.
From that perspective, a pragmatic agenda has three parts:
First, government programs supporting broadband deployment should stop funding network overbuilding, while at the same time increasing program transparency and accountability.
It is essential to focus on truly unserved markets to stretch the taxpayer’s dollar further. Funding duplicative systems with government subsidies in areas already served by commercial networks or in dense areas that are commercially viable takes away funds that could have been used to extend rural networks.
Similarly, the government should be careful about setting an excessively high standard for communities eligible to receive broadband subsidies. “Future-proofing” sounds like a great idea, but every time the standard for acceptable broadband is raised, more urban and suburban households are counted as “unserved.” As a result, the limited pot of broadband subsidies is spread more widely, and less is available for expensive rural connections.
To accomplish these ends, Congress should focus broadband subsidies in a relatively small number of programs that can be closely monitored. When money is spent, it should include milestones for transparent reporting of progress, like the FCC’s RDOF program, and should be careful to avoid overbuilding and duplicative funding.
Second, cut the red tape and make every dollar stretch farther by eliminating impediments to deployment.
Deployment of broadband to rural areas is expensive and inconsistent regulations create impediments and increase those deployment costs. Especially when a large pot of government subsidies is involved, different groups have an incentive to slow the process down and try to get a bigger slice of the pie.
One important example: A key to rural deployment is attaching broadband infrastructure to existing poles. However, excessive rent seeking behavior from pole owners — to recover pole replacement costs and attachment charges — is driving up the cost of rural broadband deployment, thereby limiting the number of rural households that can be served in any buildout.
Steps should be taken to streamline these processes to speed rural broadband deployment, bring pole costs in line with actual costs and make every dollar of both private and public funding stretch farther. The FCC needs to go beyond its January 2021 Declaratory Ruling and clarify that broadband providers are only responsible for their proportionate share of the pole replacement cost (e.g., if a pole would need to be replaced after 20 years and it is 18 years old, a broadband provider should only pay for 2/20ths of the cost). In addition, the FCC needs to act quickly on complaints about pole replacement issues, permitting issues and the like. These can languish for years delaying or preventing build out.
At the same time, the FCC can’t do it all, since municipal and cooperative owned poles are exempted from federal regulation of pole attachments. If broadband deployment is a national priority, Congress should act to bring all poles under FCC jurisdiction by eliminating the exemption when it funds the next round of broadband investment.
Third, government programs supporting broadband deployment should not be bogged down by restrictions and requirements developed for last century’s telephone networks.
Even as federal broadband programs try to move rural areas into the 21st century, they still impose anachronistic 20th century requirements on participants. The clearest and most obvious example is the backward-looking rule that winning RDOF bidders meet the requirement to be certified as an “Eligible Telecommunications Carrier” for the locations that they receive public support for. The ETC designation was introduced in the 1996 Telecommunications Act, in an age of voice-only telecommunications networks and it carries with it certain Title II voice obligations that make no sense when the purpose of the funding is to bring broadband to areas without it. In fact, the areas that are being funded already have telephone service provided by an ETC.
This ETC requirement is a major obstacle for many companies and limits funding to providers that either have historically obtained the designation, or those providers that are willing to engage in the time-consuming and resource intensive process to obtain the designation and then comply with the onerous patchwork of state regulations that it requires.
State regulation that is not appropriate to apply to broadband services that are national — and global — in nature. We are continuing to apply legacy telephone regulations when we are trying to solve a broadband divide. It does not make sense and has slowed efforts to address this issue. The ETC requirement limits participation by providers that are otherwise well-positioned for this work and even if some providers do participate it adds unnecessary costs and requirements that do nothing to build broadband. If we are going to close the rural broadband gap, we need to get these providers onto the playing field.
So, when Congress funds the next round of broadband subsidies, the requirement that participating providers be certified as an ETC should be removed. Instead, any universal service requirements should be explicitly broadband-focused, which is in fact the point.
Those Who Ignore the Hard Lessons of Past Broadband Funding Efforts Are Doomed to Repeat Them
Our proposals are not magic bullets that will suddenly cure the rural broadband problem. But they will ensure that the money that is spent will go to where it belongs, rather than being diverted to other goals.
Devoting government resources to overbuild or upgrade existing robust networks in these areas will take away those finite government resources from those areas of the country that lack any broadband connection at all. The rural/urban divide will only be widened, not narrowed or closed for good.
Nor does it make sense for Washington to fund what the private sector is already moving to accomplish, invest in, and deploy on its own.
Infrastructure proposals should be laser-focused on connecting those areas of the country lacking any broadband access. Past experience with broadband funding has shown that will be the only way to connect 100% of the country once and for all.
This paper demonstrates that tremendous government resources have already been directed towards the problem, but the gap persists. We cannot afford to ignore the lessons of the past. The roadmap laid out in this paper will help ensure we succeed.
Recently introduced legislation would put China first and harm U.S. companies
PPI President Will Marshall today urges Congressional Democrats in Congress to reject a bundle of anti-tech bills released late last Friday by members of the House Judiciary anti-trust subcommittee.
In a memo to pro-growth Democrats, Marshall argues that the bills are intended to breakup or otherwise handcuff America’s most innovative and competitive companies as we compete with China for global economic and technology leadership.
He also warns of political backlash: “With razor-thin majorities in Congress, and a challenging midterm election next year, Democrats shouldn’t let the left’s antipathy to competitive markets, private enterprise, and disruptive innovation — also known as economic progress — define their party.”
Read the memo below:
MEMO: June 14, 2021
TO: Pro-Growth Democrats
FROM: PPI President Will Marshall
RE: How to Lose to China
President Joe Biden says that America is locked in a “strategic competition” with China for global economic and political leadership in the 21st century. Keeping the United States on the leading edge of technological innovation and entrepreneurship is how we win this contest between liberal and autocratic systems.
It’s also the key to generating more good jobs that can help our country close stark income and opportunity gaps at home, as well as demonstrating the strength and resilience of liberal democracy to doubters around the world.
That’s why it’s baffling and dismaying to see some anti-tech Democrats unveil late last week a flurry of bills aimed at breaking up and otherwise handcuffing America’s most innovative and globally competitive companies. These bills narrowly target a handful of large online platforms whose offerings are eagerly sought by people everywhere.
Nonetheless, both right-wing and left-wing populists have drawn a bead on “Big Tech” companies, the former for supposedly muzzling conservatives, the latter for alleged abuses of market power. The bills are based on a tendentious and deeply flawed report by the House Antitrust Subcommittee.
As the Progressive Policy Institute and other analysts have documented, the evidence supporting the report’s claims of systemic antitrust abuses is remarkably flimsy. It mostly consists of misleading anecdotes and alarmism about conjectural rather than actual harms.
In contrast, the benefits Americans get from big internet companies like Google, Amazon, and Apple are tangible and easy to measure. These include lower consumer prices (monopolies typically are supposed to raise them), high capital investment in the U.S. economy, and robust creation of high-wage jobs, a rare bright spot in the pandemic recession. All of these emerge from a hotly competitive and innovative digital ecosystem.
Fresh in the public mind is the essential role the major tech and e-commerce platforms played in keeping the U.S. economy afloat during the pandemic shut-downs. They enabled millions of us to work from home, stay in touch with friends and family, shop online for goods delivered swiftly and safely to our homes, learn and have medical appointments remotely, and entertain ourselves while homebound.
Of course, private companies are run by humans, not saints, and some will make errors or cheat to gain competitive advantage. Large and powerful companies of all kinds certainly merit close scrutiny, as well as government penalties and regulation if they break the law. But on close examination, the populist indictment singling out a few “Big Tech” firms mostly boils down to a vague discomfort with bigness itself.
That’s not enough to justify wrecking the most vibrant part of the still-recovering U.S. economy. We urge pragmatic Democrats to stand firm against these ill-conceived bills and instead craft well-tailored remedies where there is solid evidence of antitrust violations or other public harms arising from market concentration.
In short, as pro-growth progressives we believe there are two compelling reasons why Democrats should not allow themselves to be stampeded into an ideological crusade to break up America’s most dynamic and successful companies:
First, it would be bad for our country. Hobbling America’s most formidable competitors would be tantamount to shooting ourselves in the foot as the race with China for economic and technological primacy intensifies.
Second, it would be a serious political blunder. With razor-thin majorities in Congress, and a challenging midterm election next year, Democrats shouldn’t let the left’s antipathy to competitive markets, private enterprise, and disruptive innovation — aka economic progress — define their party.
It’s important to note that there is no public groundswell for eviscerating the nation’s leading tech companies. On the contrary, they are highly popular with working and middle-class Americans — including swing voters in key battleground states that helped Biden win in 2020. The pressure to do so comes mainly from right-wing conspiracy theorists and left-wing academics and activists besotted with anti-capitalist and neo-socialist posturing.
China’s Drive for Tech Dominance
China has made no secret of its determination to be first to scale what President Xi Jinping calls the “global peaks of technology.” The Chinese Communist Party’s (CCP) new five-year plan identifies mastery of cutting-edge technologies as a matter of national security, not just economic development, and allocates massive state resources accordingly.
The plan aims to boost spending on research and development by 7% annually, slightly more than budget increases (6.8%) for China’s military. Premier Li Keqiang has offered state support for speeding development of quantum computing, artificial intelligence, advanced semiconductors, and cloud computing.
The government clearly intends to extend its industrial policy model from manufacturing to vanguard technologies like artificial intelligence, robotics, and semiconductors. That means subsidizing national champions and steering government procurement contracts to Chinese companies. The China Development Bank recently announced plans to deploy $60 billion in loans to 1,000 firms developing key innovations.
According to a Brookings Institution report, China sees leadership in 5G technology and other emerging technologies as a way to expand its global power. Stung by the Trump administration’s blacklisting of Huawei and other Chinese tech companies, Beijing has proclaimed a goal of “technology independence.”
Just how realistic that is in a world of intertwined supply chains remains to be seen. But knowledgeable observers believe we are headed for “bifurcated” U.S. and Chinese digital ecosystems over the next decade. In any case, Beijing has set its sights on being the global standard setter for the next generation of high-tech industries.
In addition to its advantages on 5G, China leads the world in electric car sales and is investing heavily in biotech. Then there are the CCP’s chilling efforts to harness high tech to Xi’s totalitarian political aspirations, such as the use of AI surveillance technology to monitor its people’s “social profile” and modify “antisocial” behavior.
Meanwhile, Chinese hackers who apparently are backed by the central government are unrelenting in their attempts to steal intellectual property from U.S. tech companies
(Microsoft has reported recent attacks on its email server), defense contractors, universities, infectious-disease researchers, and U.S. government agencies.
Unlike the backers of the anti-tech bills, the Chinese understand that competing on a global scale requires large-scale companies. In fact, about half the world’s largest tech companies are Chinese, including Huawei (with 197,000 employees, bigger than any U.S. tech company except Amazon), Alibaba (117,000), and Tencent (86,000).
With strong backing by the Chinese government, these companies all are — like America’s tech giants — making big capital investments in future growth. “If we don’t get moving, they are going to eat our lunch,” President Biden has warned, in making the case for his ambitious jobs and families bills.
Now is the time for Democrats to embrace economic patriotism — and optimism. By boosting public investment in science and applied research, encouraging private companies to boost their capital spending, and unleashing the inventive and entrepreneurial genius of a free people, the United States can out-innovate and out-compete an increasingly repressive China.
But the anti-tech bills released last week point in the opposite direction. They are a formula for losing to China. Democrats and true progressives should reject them.
The Progressive Policy Institute (PPI) is a catalyst for policy innovation and political reform based in Washington, D.C. Its mission is to create radically pragmatic ideas for moving America beyond ideological and partisan deadlock. Learn more about PPI by visiting progressivepolicy.org.
TO: Pro-Growth Democrats
FROM: PPI President Will Marshall
RE: How to Lose to China
President Joe Biden says that America is locked in a “strategic competition” with China for global economic and political leadership in the 21st century. Keeping the United States on the leading edge of technological innovation and entrepreneurship is how we win this contest between liberal and autocratic systems.
It’s also the key to generating more good jobs that can help our country close stark income and opportunity gaps at home, as well as demonstrating the strength and resilience of liberal democracy to doubters around the world.
That’s why it’s baffling and dismaying to see some anti-tech Democrats unveil late last week a flurry of bills aimed at breaking up and otherwise handcuffing America’s most innovative and globally competitive companies. These bills narrowly target a handful of large online platforms whose offerings are eagerly sought by people everywhere.
Nonetheless, both right-wing and left-wing populists have drawn a bead on “Big Tech” companies, the former for supposedly muzzling conservatives, the latter for alleged abuses of market power. The bills are based on a tendentious and deeply flawed report by the House Antitrust Subcommittee.
As the Progressive Policy Institute and other analysts have documented, the evidence supporting the report’s claims of systemic antitrust abuses is remarkably flimsy. It mostly consists of misleading anecdotes and alarmism about conjectural rather than actual harms.
In contrast, the benefits Americans get from big internet companies like Google, Amazon, and Apple are tangible and easy to measure. These include lower consumer prices (monopolies typically are supposed to raise them), high capital investment in the U.S. economy, and robust creation of high-wage jobs, a rare bright spot in the pandemic recession. All of these emerge from a hotly competitive and innovative digital ecosystem.
Fresh in the public mind is the essential role the major tech and e-commerce platforms played in keeping the U.S. economy afloat during the pandemic shut-downs. They enabled millions of us to work from home, stay in touch with friends and family, shop online for goods delivered swiftly and safely to our homes, learn and have medical appointments remotely, and entertain ourselves while homebound.
Of course, private companies are run by humans, not saints, and some will make errors or cheat to gain competitive advantage. Large and powerful companies of all kinds certainly merit close scrutiny, as well as government penalties and regulation if they break the law. But on close examination, the populist indictment singling out a few “Big Tech” firms mostly boils down to a vague discomfort with bigness itself.
That’s not enough to justify wrecking the most vibrant part of the still-recovering U.S. economy. We urge pragmatic Democrats to stand firm against these ill-conceived bills and instead craft well-tailored remedies where there is solid evidence of antitrust violations or other public harms arising from market concentration.
In short, as pro-growth progressives we believe there are two compelling reasons why Democrats should not allow themselves to be stampeded into an ideological crusade to break up America’s most dynamic and successful companies:
First, it would be bad for our country. Hobbling America’s most formidable competitors would be tantamount to shooting ourselves in the foot as the race with China for economic and technological primacy intensifies.
Second, it would be a serious political blunder. With razor-thin majorities in Congress, and a challenging midterm election next year, Democrats shouldn’t let the left’s antipathy to competitive markets, private enterprise, and disruptive innovation — aka economic progress — define their party.
It’s important to note that there is no public groundswell for eviscerating the nation’s leading tech companies. On the contrary, they are highly popular with working and middle-class Americans — including swing voters inkey battleground states that helped Biden win in 2020. The pressure to do so comes mainly from right-wing conspiracy theorists and left-wing academics and activists besotted with anti-capitalist and neo-socialist posturing.
China’s Drive for Tech Dominance
China has made no secret of its determination to be first to scale what President Xi Jinping calls the “global peaks of technology.” The Chinese Communist Party’s (CCP) new five-year plan identifies mastery of cutting-edge technologies as a matter of national security, not just economic development, and allocates massive state resources accordingly.
The plan aims to boost spending on research and development by 7% annually, slightly more than budget increases (6.8%) for China’s military. Premier Li Keqiang has offered state support for speeding development of quantum computing, artificial intelligence, advanced semiconductors, and cloud computing.
The government clearly intends to extend its industrial policy model from manufacturing to vanguard technologies like artificial intelligence, robotics, and semiconductors. That means subsidizing national champions and steering government procurement contracts to Chinese companies. The China Development Bank recently announced plans to deploy $60 billion in loans to 1,000 firms developing key innovations.
According to a Brookings Institution report, China sees leadership in 5G technology and other emerging technologies as a way to expand its global power. Stung by the Trump administration’s blacklisting of Huawei and other Chinese tech companies, Beijing has proclaimed a goal of “technology independence.”
Just how realistic that is in a world of intertwined supply chains remains to be seen. But knowledgeable observers believe we are headed for “bifurcated” U.S. and Chinese digital ecosystems over the next decade. In any case, Beijing has set its sights on being the global standard setter for the next generation of high-tech industries.
In addition to its advantages on 5G, China leads the world in electric car sales and is investing heavily in biotech. Then there are the CCP’s chilling efforts to harness high tech to Xi’s totalitarian political aspirations, such as the use of AI surveillance technology to monitor its people’s “social profile” and modify “antisocial” behavior.
Meanwhile, Chinese hackers who apparently are backed by the central government are unrelenting in their attempts to steal intellectual property from U.S. tech companies
(Microsoft has reported recent attacks on its email server), defense contractors, universities, infectious-disease researchers, and U.S. government agencies.
Unlike the backers of the anti-tech bills, the Chinese understand that competing on a global scale requires large-scale companies. In fact, about half the world’s largest tech companies are Chinese, including Huawei (with 197,000 employees, bigger than any U.S. tech company except Amazon), Alibaba (117,000), and Tencent (86,000).
With strong backing by the Chinese government, these companies all are — like America’s tech giants — making big capital investments in future growth. “If we don’t get moving, they are going to eat our lunch,” President Biden has warned, in making the case for his ambitious jobs and families bills.
Now is the time for Democrats to embrace economic patriotism — and optimism. By boosting public investment in science and applied research, encouraging private companies to boost their capital spending, and unleashing the inventive and entrepreneurial genius of a free people, the United States can out-innovate and out-compete an increasingly repressive China.
But the anti-tech bills released last week point in the opposite direction. They are a formula for losing to China. Democrats and true progressives should reject them.
Progressives are supposed to care about jobs. Yet the collection of anti-tech bills just released by members of the House Judiciary Committee go after the companies and industries that have been the most reliable source of job creation in recent years.
Using the methodology developed in our April 2021 paper, Innovative Job Growth in the 21st Century, we calculate that the tech-ecommerce sector has replaced the healthcare sector as the biggest creator of jobs in the U.S. economy. In the five-year stretch from 2015 through 2020, the tech-ecommerce sector added more than 1.7 million jobs. That’s compared to almost 1.2 million jobs for the healthcare sector, including social assistance.
Moreover, these tech-ecommerce jobs are spread over the entire country. Tech-ecommerce job growth from 2015 to 2020 exceeded healthcare job growth in 36 states, including the District of Columbia. The top ten states for tech-ecommerce job growth start with California, Texas and Washington, but also include Florida, Georgia, Ohio, Pennsylvania and Illinois (see table below).
In terms of jobs, the top tech-ecommerce companies compare well to the great manufacturing companies of the past. The top five tech-ecommerce firms—Apple, Alphabet, Microsoft, Facebook, and Amazon—employed 1.8 million workers globally as of early 2021. By comparison, the top five industrial firms by stock market value in the peak manufacturing employment year of 1979—GM, GE, IBM, Kodak, and Dupont—had a total global employment of 1.9 million, just slightly more.
What about pay? The average annual pay in the tech-ecommerce sector is higher than average annual pay in healthcare in every state except for one (Oklahoma). This includes all positions and roles, across the whole universe of tech-ecommerce jobs, from fulfillment center workers to software developers. Average tech-ecommerce pay is higher than average manufacturing pay for 43 states, including the District of Columbia.
Note that these figures include a large number of non-college workers. Our analysis of government data shows that roughly 40% of workers in tech-ecommerce industries have less than a bachelor’s degree. On average, they are earning at least as much or more as they would be making in manufacturing, with the big difference that tech and e-commerce firms are hiring non-college workers without experience at a much faster rate than manufacturers are.
As the saying goes, if it ain’t broke, don’t fix it. Progressives should appreciate the job creation record of the tech-ecommerce companies rather than trying to break them up.
Top states for tech-ecommerce job creation
Job change, thousands, 2015-2020
Tech-ecommerce
Healthcare and social assistance
California
331.8
267.7
Texas
170.7
109.8
Washington
107.1
40.2
Florida
100.8
95.1
New York
85.4
142.6
Georgia
63.9
39.4
New Jersey
61.7
5.9
Ohio
60.4
6.0
Pennsylvania
57.2
56.6
Illinois
57.0
6.3
North Carolina
51.3
16.7
Arizona
46.8
56.8
Colorado
41.9
22.6
Virginia
40.4
16.7
Tennessee
37.1
16.5
Maryland
35.9
3.4
Massachusetts
34.6
2.6
Indiana
33.8
25.7
Michigan
29.3
-2.5
Nevada
26.3
20.3
Missouri
24.3
18.2
Oregon
24.2
42.8
Utah
24.1
20.2
Kentucky
20.9
11.7
South Carolina
17.8
14.8
Note: The tech-ecommerce sector includes four tech industries and three ecommerce industries. The four tech industries are software publishing (NAICS 5112); data processing and hosting (NAICS 518); Internet publishing and search, and other information services (NAICS 519); and computer systems design and programming (NAICS 5415). The three ecommerce industries are electronic shopping and mail order houses (NAICS 4541); local delivery (NAICS 492); and ecommerce fulfillment and warehousing (NAICS 493).
New legislative package would be a devastating blow to American technological leadership
Today, Members of the House of Representatives introduced a new package of bills aimed at stifling digital innovation through extreme antitrust legislation.
Alec Stapp, Director of Technology Policy at the Progressive Policy Institute (PPI) released the following statement:
“The package of bills proposed by Members of the Judiciary Committee would be a devastating blow to American technological leadership at a time when that leadership is more necessary — and more at risk — than ever. While the current system isn’t perfect — the FTC and DOJ urgently need more resources, for example — our antitrust institutions are part of the overall pro-innovation ecosystem that has enabled the United States to produce technology companies that are the envy of the world. These companies create good jobs for American workers — both directly and indirectly — as well as provide innovative products for consumers around the world.
“It makes no sense to apply a drastically different set of rules to a small handful of companies without clear evidence of consumer harms, and a compelling story for how these new rules would remedy those harms. On the contrary, radical measures such as line of business restrictions and bans on self-preferencing would destroy many of the integrated products consumers currently enjoy.
“Apple would no longer be allowed to make its own apps (the iPhone would arrive out of the box with an empty home screen). Google would no longer be allowed to offer Google Maps on Android devices or use it to show map results in search. Amazon would no longer be allowed to offer generic goods at lower prices (just as Walmart, Costco, and every other large retailer do). It’s hard to see how these rules would benefit anyone other than the small handful of competitors that have been trying to use regulation to kneecap America’s most successful companies.
“Lastly, the bill related to mergers is written so broadly that it would effectively ban all future acquisitions by large tech companies. This might have the unintended consequence of decreasing investment in startups because acquisitions are by far the most common way that founders, investors, and employees earn a return on their equity. Reforms are certainly necessary, especially on issues related to privacy, misinformation, and election interference, but these bills would do nothing to address those concerns and would cause more harm in the process.”
The Progressive Policy Institute (PPI) is a catalyst for policy innovation and political reform based in Washington, D.C. Its mission is to create radically pragmatic ideas for moving America beyond ideological and partisan deadlock. Learn more about PPI by visiting progressivepolicy.org.
In an op-ed recently published in USA Today, I urged Congress and the Biden administration to take the simplest, most direct path to universal broadband connectivity by moving past the Far Left’s obsession with government-owned networks and misguided “future proofing” symmetric speed mandates:
There are two paths Congress can take: a relatively simple, direct approach that builds on the strengths of our current broadband ecosystem and closes the digital divide in rural and urban areas with targeted, laser focused subsidies.
Then there is the speculative, over-regulatory approach pushed by some beltway zealots and special interests — unnecessarily overcomplicating this challenge with far-left shibboleths that have failed miserably in the past.
This isn’t that complicated; the shortest distance between two points is a direct line. To get the job done, we should focus on the most direct path and be willing to take yes for an answer.
A new analyst report recently issued by New Street Research, a top independent research firm, provides additional quantitative backup for this argument.
In a detailed analysis, New Street’s Jonathan Chaplin, who focuses on the tech and communications sector, explains how efficiently and competitively distributing funds to proven, capable providers could wire every unserved home across rural America well within the $100 billion budget President Joe Biden has put on the table — and even within the $65 billion compromise number.
But the price tag balloons massively if the targeted goal of universal access is replaced with scatter shot programs to subsidize new networks, give preference to government-owned broadband networks (GONs) and nonprofit providers, and impose price controls.
Chaplin concludes:
1) We can close the broadband gap with a subsidy of $35 billion to $75 billion;
2) We can close the gap and have two future-proof providers in 90% of the country with a subsidy of $99 billion to $227 billion;
3) Those costs would increase to $53 billion to $90 billion and $158 billion to $298 billion if subsidies go to new entrants (municipalities; co-ops);
4) The cost goes up considerably from there if the administration also mandates lower prices.
Based on the above, the administration should absolutely fund closing the gap; it is far better to fund existing carriers than new entrants. Funding competition would be economically, politically and legally challenging. All objectives are less achievable if coupled with price regulation.
These findings shouldn’t come as a surprise to anyone who has followed broadband policy debates over the past decade.
It’s clear that closing the deployment gap is well within reach given the budgets on the table. If the money is spent well and targeted at truly unserved areas, universal deployment can, finally, be achieved.
But New Street’s modeling confirms that $65 billion won’t be nearly enough funding if Congress decides to redefine “unserved” homes to include any not currently reached by symmetric 100/100 Mbps networks. Under that definition, almost 60% of all homes nationwide would be considered “unserved.” And funds would flow to places like Aspen and Palm Beach rather than unconnected rural families. There is simply no empirical evidence to support an eligibility standard of 100/100. To the contrary, all evidence is that broadband use is and will remain asymmetrical. Downstream-to-upstream ratios steadily increased from 3:1 in 2010 to 14:1 in 2019 before dipping slightly to 12:1 during the pandemic. Setting a symmetrical 100/100 Mbps eligibility standard would result in truly unserved areas being left out again.
In addition, GONs are not the panacea advocates like to pretend. Many cities have tried — and failed — to make a go of municipal broadband. University of Pennsylvania Professor Christopher Yoo surveyed every municipal fiber project that publicly reports its financial results, and found that over half could not cover their operating costs. Provo, Utah, taxpayers lost almost $40 million when it sold its failing municipal broadband network for just $1. Burlington, Vermont, saw its credit rating downgraded to junk bond status after spending $33.5 million on a municipal network that failed to keep up with its debt. Accordingly, New Street recognizes that new providers that have little if any experience will require even greater subsidies, thus ballooning the costs further.
These data points ultimately validate the simpler, more direct approach to broadband infrastructure buildouts represented in the Manchin-Cornyn framework. There is broad, bipartisan support for a rural broadband package targeting taxpayer dollars to unserved areas in an accountable manner that encourages every broadband provider to compete on equal footing to close broadband gaps as quickly and cost-effectively as possible.
Now, it’s up to Congress and the administration to take “yes” for an answer.
While other companies cut back on spending as the coronavirus pandemic took hold last year, e-commerce giant Amazon boosted its domestic capital investments by 75% to nearly $34 billion—and helped set the stage for a robust economic recovery, according to a new report from the Progressive Policy Institute.
KEY FACTS
Capital investment by Amazon and its peers in the e-commerce, broadband and tech industries helps spur job creation, boosts production and distribution capacity and combats inflation by shoring up supply, the report’s authors argue.
In Amazon’s case, the extra investment on property and equipment last year was driven by the need to meet an enormous surge of demand during the pandemic, the report notes.
Those investments put the firm in PPI’s top slot on its list of “Investment Heroes.”
Verizon was second on PPI’s list with $16.1 billion in domestic capital investment last year, AT&T was third on the list with $15.6 billion invested, and Alphabet and Intel rounded out the top five with $14 billion and $12.5 billion invested, respectively.
BIG NUMBER
500,000. That’s how many workers Amazon added in 2020, according to the report.
CRUCIAL QUOTE
“The willingness of these companies to keep spending essentially made it possible for large chunks of the economy to move forward, despite the pandemic,” the report states.
KEY BACKGROUND
Despite its major investments in the U.S. economy last year, Amazon’s business practices have also been the target of criticism. The firm was recently sued by the attorney general of the District of Columbia over allegations that it engaged in anticompetitive practices that “have raised prices for consumers and stifled innovation and choice across the entire online retail market.” Rep. David Cicilline (D-R.I.) said Amazon’s recent purchase of film studio MGM is a sign that the company is “laser-focused on expanding and entrenching their monopoly power.” And that’s not to mention criticism over the way the company handled safety protocols for workers and drivers during the pandemic.
Amazon’s $34 Billion Makes It an ‘Investment Hero,’ Study Says
The e-commerce giant was far and away the leader in U.S. capital spending in 2020, according to a Progressive Policy Institute analysis.
By Peter Coy
Democratic and Republican politicians alike are dumping on Amazon.com Inc. over its ceaseless expansion—marked most recently by its agreement to buy the movie studio with the roaring lion logo, Metro-Goldwyn-Mayer. Representative David Cicilline, a Rhode Island Democrat, says “they are laser-focused on expanding and entrenching their monopoly power,” while Senator Josh Hawley, a Missouri Republican, tweets that Amazon “shouldn’t be able to buy anything else. Period.”
But not everybody is mad at Amazon. A new study from the Progressive Policy Institute, which was founded in 1989 as a centrist Democratic think tank and promises “radically pragmatic thinking,” calls Amazon its No. 1 “investment hero.” It estimates that Amazon boosted its U.S. capital spending by 75% in 2020, to $33.8 billion, from the year earlier, which was more than twice that of any other company.
The study names 25 investment heroes based on their U.S. capital spending. The rest of the top five for 2020 are Verizon Communications, $16.1 billion; AT&T, $15.6 billion; Google’s parent Alphabet, $14 billion; and Intel, $12.5 billion.
“The willingness of these companies to keep spending essentially made it possible for large chunks of the economy to move forward despite the pandemic,” says the report. “Investment by broadband and tech companies kept people connected at home during the shock of the lockdown; and the investment by e-commerce firms helped keep essential goods flowing while many Americans could not go out shopping.”
The report is by Michael Mandel, the institute’s chief economic strategist, and Elliott Long, a senior economic policy analyst. Mandel was chief economist of BusinessWeek, the predecessor to Bloomberg Businessweek (making him my former boss). He is also a senior fellow at the Mack Institute for Innovation Management of the Wharton School at the University of Pennsylvania.
Critics of Amazon say it costs jobs by putting smaller retailers out of business. But in an email exchange, Mandel wrote that “the number of workers added by e-commerce exceeds jobs lost by brick and mortar.” The main reason, he wrote, is that e-commerce customers are creating jobs for drivers, warehouse workers, and others, who are freeing them from having to shop in person. “Investment in e-commerce is job-creating because it replaces unpaid household shopping hours, which have fallen dramatically,” Mandel wrote.
This is the 10th annual edition of the investment heroes report by the Progressive Policy Institute. It’s based on gross investment—i.e., before accounting for the effects of depreciation. The numbers come from company reports. The authors made estimates when the companies didn’t break out U.S. investment separately. Most financial companies, excluding health insurance companies, were excluded. For Amazon, which relies heavily on finance leases, the report included principal repayment on those leases as a form of investment.
The report takes a shot at critics in the camp of Cicilline and Hawley, without naming names. “It seems odd that Congress seems more interested in sharply questioning companies that are investing heavily in America, rather than those that have reduced investment or actually disinvested in this country,” it says.
The Progressive Policy Institute gets general funding from some of the companies on the heroes list, Mandel wrote in an email. But he says “the methodology only uses publicly available data and a consistent procedure that can be replicated.”
The MGM deal was announced after the report was completed. (Acquisitions don’t count toward companies’ capital spending numbers in the report.) In an email, Mandel wrote, “This deal potentially increases the level of competition in the growing market for streaming content. The key is to watch Amazon’s investment behavior. If Amazon invests in producing more content based on MGM intellectual property, as seems likely, that means lower prices for consumers and more content production jobs.”
In announcing the deal on May 26, the company stated, “Amazon will help preserve MGM’s heritage and catalog of films, and provide customers with greater access to these existing works.” Amazon didn’t immediately respond to a request for comment on this story.
The PPI report is lukewarm on President Joe Biden’s American Jobs Plan. The authors praise its provisions for investment in infrastructure, research and development, and manufacturing. But they write that the corporate income tax increases in the plan “could discourage business investment at a time when capital spending is already weak.”
Not every economist agrees with that. Thomas Philippon, a finance professor at New York University’s Stern School of Business, argues that for many companies, a higher tax on their profits would not induce them to decrease investment significantly because a substantial share of their profits are “excess”—meaning they’re above what companies require to justify investment for growth. (Excess profits, an economic concept rather than an accounting one, are generated by companies with monopolies or near-monopolies in their market sectors.)
Mandel wrote, “The weight of the evidence shows that corporate tax rates adversely affect investment.”
In 2020 U.S. businesses cut back domestic capital investment by seven percent, in response to the Covid-19 pandemic, lockdowns and recession. The decline was broad-based, from transportation equipment to industrial equipment to energy investment.
But amidst this slowdown, Amazon boosted its domestic capital expenditures by 75 percent in 2020, according to new estimates by the Progressive Policy Institute (PPI). The ecommerce giant invested a stunning $33.8 billion in the United States last year, a record for the 10 years that PPI has been doing the Investment Heroes report.
Amazon’s capital investment performance illustrates just how critical the tech-broadband- ecommerce sector has been to keeping people working and propping up the economy. The second company on our list, Verizon, invested $16.1 billion in the U.S. in 2020, AT&T $15.6 billion, Alphabet $14 billion, and Intel $12.5 billion. Eight out of the top 10 companies in our list—Amazon, Verizon, AT&T, Alphabet, Intel, Facebook, Microsoft and Comcast—are in the tech, ecommerce, and broadband sectors.
The willingness of these companies to keep spending essentially made it possible for large chunks of the economy to move forward despite the pandemic.
Capital investment is critical because it enables the creation of high-productivity, well-paying jobs. Collectively the top 10 companies in the Investment Heroes list added 483,000 jobs in 2020, led by Amazon’s dramatic leap from 798,000 workers in 2019 to 1,298,000 workers in 2020. Just looking domestically, the industries represented by the top 10 Investment Heroes added 234,000 jobs between the start of the pandemic in February 2020 and April 2021, while the rest of the private sector lost more than 6 million jobs.1
Capital investment is also essential for creating more production, communications and distribution capacity. This was essential during the pandemic, when investment by broadband and tech companies kept people connected at home during the shock of the lockdown; and the investment by ecommerce firms helped keep essential goods flowing while many Americans could not go out shopping.
As the Broadband Internet Technical Advisory Group wrote in an April 2021 report, “available data suggests that the Internet has performed well during the pandemic…. and is a testament to the importance of continued investment in robust Internet infrastructure in all parts of the ecosystem.”2 The report went on to note that “ISPs reacted to the sudden demand increase by rapidly adding extraordinary amounts of new capacity and pledging to Keep Americans Connected.”
Capital investment also helps hold down prices by creating more supply—and the lack of investment creates the conditions for overall price inflation. Prices in the tech-broadband-ecommerce sector were mostly flat or down in 2020, as investments in new capacity helped meet soaring demand. For example, the surge of new broadband capacity meant that the price of telecommunications services to consumers fell by 2 percent in 2020, and the price of Internet access fell by 1 percent, according to data from the Bureau of Economic Analysis.
Similarly, one big reason for the recent return of inflation in 2021 has been production and supply bottlenecks caused by a lack of investment during 2020. Net domestic business investment totaled an anemic 1.9 percent of net domestic product in 2020.3 To put this in perspective, that was a sharp fall-off from 2.8 percent, which was net domestic business investment’s average share of net domestic product from 2008 to 2019. And that in turn was down from the business cycles running from 1991 to 2000 and 2001 to 2007, when net domestic business investment’s share of net domestic product averaged 4.5 and 3.5 percent, respectively (Figure 1).
THE REPORT
Which companies are fighting this downward trend? Since 2012 PPI has provided unique estimates of domestic capital spending for individual major U.S. companies. Currently, accounting rules do not require companies to report their U.S. capital spending separately. To fill this gap in the data, we created a methodology using publicly-available financial statements from non-financial Fortune 150 companies to identify the top companies that were investing in the United States.
We call these companies “Investment Heroes” because their capital spending is helping create good jobs and boost capacity across the country. In 2020, the 25 companies on our list invested $216 billion in the U.S. This year’s list includes 11 tech, broadband and ecommerce companies; six energy production and distribution companies; three transportation companies; two automotive companies; two retail companies; and one entertainment company.
In terms of government policy, U.S. regulators and policymakers have an ambivalent attitude towards corporate capital investment. On the one hand, companies that don’t invest are decried as suffering from “short-termism,” being more concerned about current profits than long-term growth.4
On the other hand, the tech, broadband, and ecommerce companies that do make long- term investments in American workers and the American economy are often accused of unfair competition and monopolistic business practices, precisely because of their large capital expenditures. It seems odd that Congress seems more interested in sharply questioning companies that are investing heavily in America, rather than those that have reduced investment or actually disinvested in this country.
President Biden’s American Jobs Plan shows the same ambivalence towards business investment leaders. The plan would spend $2 trillion over the next decade on infrastructure, research and development, and manufacturing among other public investments.5 The avowed goal is to stimulate productivity-enhancing investments in the U.S., which is a goal that PPI favors.
On the other hand, the plan would pay for these proposals by raising the federal corporate income tax rate from 21 to 28 percent and imposing a 21 percent minimum tax on overseas corporate profits among other tax changes. While the package would generate $2.1 trillion over a decade, these tax increases could discourage business investment at a time when capital spending is already weak.
U.S. INVESTMENT HEROES: THE 2020 LIST
Using the methodology described in the appendix, we estimate domestic capital spending for large U.S. non-financial companies based on publicly available data. We then rank the companies to give us the top 25 Investment Heroes.
The top 25 Investment Heroes invested $216 billion in the U.S. in 2020, according to our estimates (which are based on companies’ most recent fiscal year through January 31, 2021). That’s a decrease of 11 percent compared to last year. 18 of our 25 Investment Heroes posted a decrease in U.S. capital expenditures relative to our 2019 estimates, with an average decline of 21 percent.
Amazon by far leads our Investment Heroes this year, spending an estimated $33.8 billion on domestic capital expenditures in 2020. Second is Verizon Communications, investing an estimated $16.1 billion on capital expenditures in the U.S. on the basis of increased broadband spending. AT&T came in third, spending an estimated $15.6 billion on domestic capital expenditures. Alphabet and Intel are fourth and fifth, respectively, investing $14 billion and $12.5 billion.
Four “newcomers” made our list this year. We estimate that Lumen Technologies (formerly CenturyLink) spent $3.7 billion on U.S. capital expenditures in 2020, a three percent increase compared to our estimates for CenturyLink’s 2019 domestic capital spending. Disney returns to the top 25 this year for the first time since our 2013 report. Kroger makes our list this year, investing an estimated $3 billion on domestic capital expenditures in 2020. And Union Pacific cracks the top 25 after making our non-energy list the last two years.
Four companies from our 2019 list didn’t make our 2020 list. Southern Company fell out of the Fortune 150 and thus out of the purview of our analysis. Marathon Petroleum cut its U.S. capital expenditures by more than $2 billion in 2020 compared to 2019 by our estimates. Delta Air Lines decreased its domestic capital expenditures by more than 60 percent according to our estimates as fears of Covid ravaged the travel industry. And ConocoPhillips missed our top 25 list by $8 million.
At the sector-level, our 11 tech, broadband and ecommerce companies invested an estimated $141.4 billion in domestic capital expenditures (Table 2). This category comprises six tech and ecommerce companies (Amazon, Alphabet, Intel, Facebook, Microsoft, and Apple) and five broadband companies (Verizon Communications, AT&T, Comcast, Charter Communications, and “newcomer” Lumen Technologies).
The next category includes six energy production and distribution companies, with total estimated domestic capital expenditures of $42.2 billion. This category is made up of Exxon Mobil, Chevron, Duke Energy, Exelon, Energy Transfer, and Enterprise Product Partners.
Coming in third is transportation, spending a total of $11.2 billion on U.S. capital expenditures by our estimates. This category consists of FedEx, UPS, and “newcomer” Union Pacific.
The retail sector, which included Walmart and “newcomer” Kroger, came in fourth. These retailers invested a combined $10.8 billion by our estimates, a 37 percent increase compared to 2019 as a result of Kroger making our list.
The last two categories were automotive and entertainment. Our automotive category was made up of General Motors and Ford Motor, investing an estimated $3.8 billion and $3.2 billion respectively. The lone entertainment company to make our list was Disney, investing $3.3 billion by our estimates.
COMPANIES
Next we delve deeper into each of our Investment Heroes’ capital spending.
Amazon spent an estimated $33.8 billion on U.S. capital expenditures in 2020, a 75 percent increase compared to 2019 as
the ecommerce company sought to meet increased demand from Covid protocols like social distancing and work from home. We note that Amazon turned in a historically high investment performance. The company’s global capital expenditure of $45.7 billion (the sum of purchases of property and equipment, net of proceeds from sales and incentives, plus principal repayments of finance leases) exceeds the peak capital spending by such industrial giants as General Motors, General Electric, and IBM, even after adjusting for inflation.6
Verizon Communications spent an estimated $16.1 billion on U.S. capital expenditures in 2020, up slightly relative to our 2019 estimates. Verizon continued to invest in expanding its 4G LTE network and deploying its 5G and Intelligent Edge networks, despite the pandemic.
Third was AT&T, spending an estimated $15.6 billion in 2020. AT&T continues to invest in expanding its networks.
Alphabet invested $14 billion on U.S. capital expenditures in 2020 by our estimates. “We continue to make significant R&D investments in areas of strategic focus such as advertising, cloud, machine learning, and search, as well as in new products and services. In addition, we expect to continue to invest in land and buildings for data centers and offices, and information technology assets, which includes servers and network equipment, to support the long-term growth of our business,” the company writes in its 10-K.
Coming in fifth was Intel, spending an estimated $12.5 billion on U.S. capital expenditures in 2020, a decrease of 7 percent relative to our 2019 estimates.
Facebook spent an estimated $11.8 billion on U.S. capital expenditures in 2020, a decrease of 6 percent from our 2019 estimates. The social media company continues to invest in data center capacity, servers, network infrastructure, and office facilities.
Seventh was Exxon Mobil, investing $11.2 billion on U.S. capital expenditures in 2020 by our estimates. That’s a decrease of 33 percent compared to our 2019 estimates. The energy company cut its upstream capital investment in the U.S. by nearly $5 billion in 2020 according to its 10-K.
Microsoft spent an estimated $11.1 billion on U.S. capital expenditures during the fiscal year ending June 2020, the mostrecent 10-K available. The software company continues to invest in new facilities, data centers, computer systems for research and development, and its cloud offerings. We note that this estimate has not been updated from our previous Investment Heroes report, because we moved up the timing of the report.
Duke Energy invested $9.9 billion on U.S. capital expenditures in 2020 by our estimates, a decrease of 11 percent compared to 2019. The energy company decreased capital investment in its electric utilities, gas utilities, and commercial renewables segments.
Comcast invested $9.6 billion on U.S. capital expenditures by our estimates. Comcast continued to spend on customer premise equipment, scalable infrastructure, line extensions, and support capital.
Exelon spent an estimated $8 billion on U.S. capital expenditures in 2020, an increase of 11 percent relative to our 2019 estimates. The utility company increased capital investment in every segment except Exelon Generation.
Walmart spent an estimated $7.8 billion on U.S. capital expenditures in 2020. The retailer’s capital investments were relatively flat compared to our 2019 estimates.
Charter Communications invested $7.4 billion in domestic capital expenditures in 2020, a slight increase of 3 percent compared to 2019. The broadband company spent on line extensions and support capital according to its 10-K.
Chevron spent an estimated $6.1 billion on U.S. capital expenditures in 2020. That’s a 40 percent decline compared to 2019. The energy company spent about $3 billion dollars less in its upstream segment and about $800 million less in its downstream segment in 2020 compared to 2019.
Apple invested an estimated $5.9 billion on domestic capital expenditures in 2020. Apple’s figures are based on its latest 10-K for its fiscal year ending September 2020.
FedEx invested $4.6 billion in domestic capital expenditures by our estimates. The shipping company continued to spend on aircraft, equipment, vehicles, information technology, and facilities. We note that this estimate has not been updated from our previous report, as FedEx’s fiscal year ends on May 31st and thus their FY 2021 10-K was not published at the time of this writing.
General Motors spent an estimated $3.8 billion on U.S. capital expenditures in 2020, a 22 percent decline relative to our 2019 estimates.
Energy Transfer spent an estimated $3.8 billion on U.S. capital expenditures in 2020. Energy Transfer continued to invest in natural gas transportation and storage.
Lumen Technologies, formerly known as CenturyLink, invested $3.7 billion on domestic capital expenditures in 2020
by our estimates. That’s an increase of 3 percent compared to our 2019 estimates for CenturyLink. The broadband company continued to spend on enhancing network efficiencies and supporting new service developments.
UPS invested an estimated $3.6 billion on U.S. capital expenditures in 2020. UPS continued to spend on buildings, equipment, aircraft, vehicles, and information technology.
Enterprise Product Partners spent $3.3 billion on domestic capital expenditures in 2020 by our estimates, a 27 percent decline compared to our 2019 estimates. Enterprise Product Partners continued to invest in facilities and projects to gather, transport, and store natural gas and crude oil.
Disney invested an estimated $3.3 billion on U.S. capital expenditures in 2020, a decrease of 19 percent relative to our
2019 estimates. The entertainment company decreased spending in every segment except its direct-to-consumer and corporate segments.
Ford Motor invested $3.2 billion on domestic capital expenditures in 2020 according to our estimates, a decline of 50 percent compared to our 2019 estimates.
Kroger spent an estimated $3 billion on U.S. capital expenditures, a slight decline of 5 percent compared to 2019.
Union Pacific invested an estimated $2.9 billion on U.S. capital expenditures in 2020. Union Pacific continued to invest in new locomotives and freight cars, maintenance, and safety improvements.
INVESTMENT-RELATED POLICY
President Biden has proposed the American Jobs Plan, which includes $621 billion for transportation infrastructure, $300 billion to bolster manufacturing, $180 billion for research and development, and $100 billion for broadband among other proposals.7 Each of these areas has been an important source of economic growth historically. For example, manufacturing employment peaked in 1979 at nearly 20 million but has been on the decline since, employing about 12 million people
today.8 President Biden’s plan would restore manufacturing supply chains and provide capital to revitalize manufacturing.
Similarly, R&D investment is key to commercializing new technologies and fueling growth of industries. A few key innovations that were made possible by federal R&D funding include the internet, smartphone technologies, global positioning systems, the human genome project, and hydraulic fracturing.9 Unfortunately, federally sponsored R&D has declined from its peak of 1.8 percent of GDP in 1965 to .74 percent in 2020.10, 11 The American Jobs Plan’s $180 billion investment would provide additional funding for the National Science Foundation, the development of technology to address the climate crisis, and R&D that spurs innovation and job creation.
These increases in infrastructure and other public spending are highly desirable for growth. However, the plan would pay for these proposals by raising the federal corporate income tax rate from 21 to 28 percent and imposing a 21 percent minimum tax on overseas corporate profits among other tax changes.12 While the plan would generate $2.1 trillion over a decade, policymakers should be mindful of potentially discouraging business investment, which would prolong the economic recovery. Raising the corporate income tax rate to 28 percent would create a federal-state combined corporate income tax rate of 32.8 percent, returning the U.S. to the highest combined rate in the OECD.13
We also note that policymakers often misunderstand the link between strong corporate investment and creation of good jobs. True, in some cases, companies have invested in automation that reduces employment. But more recently, we have seen that companies making the biggest capital investments, like Amazon, may also be the biggest job creators. In particular, Amazon’s spending on fulfillment center automation has boosted productivity, enabling the company to pay a minimum wage of $15 per hour that is comparable with advertised entry-level manufacturing hourly wages of $15-$17 in many parts of the country.14 Indeed, a recent PPI analysis shows that most Americans live in states where the tech-ecommerce ecosystem, including all positions and skill levels from fulfillment center and delivery workers to website designers, pays better than manufacturing.15
The bottom line: As the U.S. struggles out of recession, and faces the worries of inflation, we should be lauding companies that invest in America during the pandemic, rather than denigrating them.
APPENDIX: METHODOLOGY
Our U.S. Investment Heroes ranking for 2020 follows the same methodology as our most recent report in 2019. We started with the top 150 companies of the 2020 Fortune 500 list as our universe of companies. We removed all financial companies and all insurance companies except health insurance companies. We also omitted the financing operations of non- finance companies when possible.
Except as noted, we use the global capital expenditure reported on the most recent 10-K through January 31, 2021, as the starting point for the analysis. In this report, we refer to all estimates as “2020,” even if the fiscal year ended in 2021. Capital expenditures generally cover plant, equipment, and capitalized software costs. For energy production companies, capital expenditures can include exploration as well.
For broadband companies, we did not include their often sizable spending on purchases of wireless spectrum as part of capital expenditures, since that category is not counted as investment spending by the economists at the Bureau of Economic Analysis. Companies purchasing spectrum in 2020 include Verizon ($2.1 billion); AT&T ($1.6 billion); Comcast ($459 million); and Charter ($464 million).
The companies in these rankings are all based in the United States. Non-U.S. based companies were not included in this list because of data comparability issues, although there are many non-U.S. companies that invest in America.
For transportation companies our report estimates the booked location of spending on capital expenditures for the company’s most recent fiscal year, rather than how much of those acquired assets are actually being used within the U.S.
Most multinational companies do not provide a breakdown of capital expenditures by country in their financial reports. However, PPI has developed a methodology for estimating U.S. capital expenditures based on the information provided in the companies’ annual 10-K statements and other financial documents. After developing our internal estimate, we contact the companies on our top 25 list to ask them to point us to any additional public information that might be relevant. Notwithstanding these queries, we acknowledge that the figures in this report are estimates based on limited information.
Our estimation procedure goes as follows:
If a company has no foreign operations, we allocated all capital spending to the United States.
If a company reported U.S. capital spending separately, we used that figure.
If a company did not report U.S. capital spending separately, but did report changes in global and U.S. long-lived assets or plant and equipment, we used that information plus depreciation to estimate domestic capital spending. As appropriate, we adjust for large acquisitions.
If a company has small foreign operations that were not reported separately, we allocated capital spending proportionally to domestic versus foreign assets, revenues, or employees.Some adjustments of note:
For Amazon, the methodological issue was their extensive use of finance leases. We chose to specify global capital expenditures as purchases of property and equipment (net of proceeds from sales and incentives) plus principal repayments of finance leases. We then used reported changes in U.S. and non-U.S. property and equipment, net and operating leases to allocate global capital expenditures, taking into account depreciation and removing the effect of operating leases.
Verizon does not report long-lived assets by geographic region. As a result, we used the most recent available data for Verizon’s domestic employment as a share of global employment to allocate Verizon’s capital spending between the United States and internationally (https://www.verizon.com/ about/sites/default/files/esg-report/2019/ social/human-capital/v-team.html)
As noted in the report, our estimates for Microsoft and FedEx remain the same as our 2019 estimates because their fiscal years end June 30th and May 31st, respectively, and thus updated 10-Ks were not available at the time of this writing. For Microsoft, we used the capital expenditures data found online at https://www.microsoft.com/ en-us/Investor/earnings/trended/capital- expenditure.aspx
In the case of Comcast, we allocated all of its cable operation and corporate capital expenditures, including cash paid for intangible assets such as software, to the U.S. For NBC Universal’s capital expenditures, including cash paid for intangible assets such as software, we assumed the same domestic vs. foreign revenue share from our 2019 estimate for 2020 to allocate capital spending as Comcast did not report updated revenue information for FY 2020.
As part of our calculations for Facebook, UPS, and Kroger, we included principal repayments on finance leases reported onthe company’s 10K or estimated principal repayments on finance leases based on 10K data.
For consistency, we omitted capital spending by the finance arm of companies such as General Motors and Ford, which reflects the financing of leased equipment rather than actual direct investment.
NON-ENERGY U.S. INVESTMENT HEROES
As a supplement to our complete U.S. Investment Heroes rankings, we also present a non-energy list for 2020 (Table 3). This list ranks the top U.S. companies investing domestically, according to our estimates, that are both non- financial and non-energy. The energy sector is one of the most capital intensive sectors of the economy and thus can heavily influence the top 25 results. The non-energy ranking includes the non-energy companies from our complete ranking but has also made room for other companies. For example, PepsiCo spent $2.8 billion on domestic capital expenditures by our estimates in 2020, a 26 percent increase compared to 2019.
Merck invested an estimated $2.7 billion on U.S. capital expenditures in 2020, a 42 percent increase compared to 2019. The pharmaceutical company spent on new capital projects focused primarily on increasing manufacturing capacity for its products.
Target invested $2.6 billion on domestic capital expenditures in 2020 by our estimates. The retailer increased its investments in information technology and new stores, while decreasing its spending on existing stores.
CVS Health spent an estimated $2.4 billion on U.S. capital expenditures in 2020, a relatively flat amount compared to our 2019 estimates for the company. Technology made up the majority of the health retailer’s capital expenditures, while store and fulfillment expansion and improvements and new store construction made up a minority share.
Home Depot invested $2.3 billion on domestic capital expenditures in 2020 by our estimates, a slight decrease of 5 percent relative to our 2019 estimates for the company.
Rounding out our top 25 non-energy list is Johnson & Johnson, spending an estimated $2.3 billion on U.S. capital expenditures in 2020. Johnson & Johnson continues to invest in its consumer health, pharmaceutical, and medical device segments, and of course vaccine production.
The Progressive Policy Institute (PPI) is pleased to host U.S. Congresswoman Suzan DelBene, OneRedmond, Tabor 100, and the Washington Technology Industry Association (WTIA) for a virtual event highlighting the role that technology has played in driving Washington’s economic growth and recovery during the COVID-19 pandemic.
The event will highlight the importance of technology platforms and digital tools for empowering Washington businesses, especially during the COVID-19 pandemic. The discussion will also cover the need for elected officials to recognize and promote continued economic development and investment in Washington spurred by the technology sector, in addition to preserving the accessibility and affordability of critical digital services that have supported minority-owned businesses, in particular, this past year.
The gig economy has provided opportunities for workers who aren’t able to find or aren’t interested in full-time regular employment. Traditional jobs require workers to show up at a particular location and work a predetermined schedule set by the company. Ride-hailing and delivery gigs allow workers to set their own schedules and work as much or as little as they like. This flexibility is a key component of why independent workers choose to participate in the gig economy. But that doesn’t mean the current arrangement is perfect.
Gig workers often aren’t able to access the benefits that regular employees tend to receive in addition to their wages. Health insurance, retirement plans, vacation days, and other benefits are highly valuable pieces of total compensation for full-time employees. If gig companies were to provide independent workers with benefits, they would be forced to reclassify them as employees, which brings a host of onerous rules and regulations that are incompatible with the dynamic and flexible nature of the gig economy.
Fortunately, it seems there is another way forward to improve the lives of gig workers by securing them benefits while maintaining the flexibility they desire. As Michael Mandel and I detailed in a paper last year for the Progressive Policy Institute (PPI), Congress should allow gig companies to opt into an alternative model. Under our proposal, workers would be able to accrue benefits in proportion to the hours they work across a wide array of platforms and then select which benefits they want from a cafeteria style plan (the ability to choose is critical because sometimes workers already receive benefits such as health insurance from a spouse or other family member).
Voters seem to like this approach of offering more benefits to gig workers while letting them keep their flexibility. Last year, California voters approved Prop 22, which overturned AB-5, a controversial state bill that reclassified a broad array of independent contractors as employees. The results of this ballot proposition were not particularly close: 59% voted in favor, 41% voted against. According to the Los Angeles Times, Prop 22 found its highest support in low-income and minority communities:
A Times examination of precinct-level data in Los Angeles County shows the companies’ argument held sway in its dense core, finding support in lower income areas including plurality-Black neighborhoods such as Inglewood and Compton, and majority-Latino East Los Angeles. It also won suburbs in the San Fernando Valley, affluent communities such as La Cañada Flintridge, and rare Los Angeles precincts where President Trump was victorious in Beverly Hills and Santa Clarita.
A band of wealthy or increasingly affluent liberal-leaning neighborhoods stretching from Santa Monica and Venice, across to Los Feliz, Highland Park and South Pasadena mounted the strongest opposition, decisively voting down the measure.
So, what did drivers get in exchange for maintaining their classification as independent contractors? According to Quartz, Prop 22 “guarantees gig workers new, limited healthcare subsidies and accident insurance, some reimbursement to account for gas and other vehicle costs, and a ‘minimum earnings guarantee’ equal to 120% of the minimum wage applied to the drivers’ ‘engaged’ time.” Not only do voters approve of this model, but drivers do too. According to one survey of Uber and Lyft drivers, around 70 to 80% of respondents prefer being independent contractors to employees.
A broader survey from the Bureau of Labor Statistics found that “Independent contractors overwhelmingly favored their alternative employment arrangement (79 percent) to a traditional one (9 percent) in May 2017.” In total, these data points show that worker benefits and flexibility are a winning combination for the gig economy.
Replacing gasoline cars with electric vehicles is a pillar of President Biden’s strategy for tackling climate change. But even if the administration sets a deadline to sunset sales of gas-powered passenger vehicles, the export of used cars abroad could stall the global reductions needed to stave off catastrophic warming.
Every year, the United States ships hundreds of thousands of its oldest and dirtiest cars overseas to predominantly poor countries in a trade that is largely unregulated. In other words, cars that would fail safety, fuel economy and emissions standards in the United States or Europe are dominating the roads in countries that rely on imported vehicles.
In Kenya and Nigeria, for example, more than 90% of vehicles are foreign imports.
“The pollution and gas guzzling continue on even after the vehicle is removed from America’s roads,” said Dan Becker, head of the safe climate transport campaign at the Center for Biological Diversity. “It’s essentially a Cheshire cat issue.”
Worldwide, there are about 1.4 billion cars on the road. That figure is expected to more than double by 2050, with 90% of growth coming from the sale of used vehicles in lower-income countries. That means emissions from the global transportation fleet — which currently account for a quarter of total carbon dioxide emissions worldwide — also could double.
If left unchecked, the global trade in secondhand cars could have bleak consequences for climate change, air quality and, by extension, public health, according to a pioneering U.N. report released last year.
The study found that between 2015 and 2018, the United States, Japan and the European Union exported 14 million used passenger cars, with 70% winding up in developing countries in Africa, Eastern Europe, Asia, the Middle East and Latin America. Two-thirds of countries surveyed in the study lacked adequate policies to regulate the quality of imported cars. Consequently, the majority of used vehicles imported were inefficient, unsafe and old.
In Uganda, for example, the average age of a used diesel import in 2017 was more than 20 years.
“The majority of the vehicles being exported do not have a valid road worthiness certificate,” said Rob de Jong, head of the U.N. Environment Programme’s Sustainable Mobility Unit and an author of the report. “The trade in used vehicles is not a bad thing per se, but in the total absence of standards, it’s a free-for-all.”
A few countries have started cracking down on dirty, unsafe imports. Some countries, such as Egypt, India and Brazil, have outright banned the import of used vehicles. Others, like Iran and Iraq, have implemented age limits, while still others, such as Singapore and Morocco, have issued vehicle emissions standards.
Mauritius, a small island nation in the Indian Ocean, banned used vehicles over 3 years old and issued a vehicle carbon tax. As a result, the country has seen a major increase in the import of used electric and hybrid cars.
Still, there is no regional or global standard to regulate the flow of used vehicles as a climate mitigation or air pollution control mechanism. De Jong of the U.N. said there needs to be a streamlined approach to curbing the sale of unsafe and inefficient vehicles.
“The risk of not doing this,” he said, “is not meeting the Paris climate agreement,” which aims to keep warming below 2 degrees Celsius.
Roger Gorham, a transport economist and urban development specialist with the World Bank, said there is an emerging consensus that regulating the secondhand vehicle trade should be a joint responsibility between exporting and importing countries.
“Exporters need to be able to distinguish between legitimate exports of vehicles that can actually be used safely, reliably and in line with environmental and climate objectives in their destination countries, as opposed to cars and trucks that do not meet even the most basic safety and environmental standards,” he said in an email. “But importer countries also have an obligation to be clear about the acceptable performance thresholds of cars (and fuels) they will allow to be imported into their country.”
In the United States, the export of used cars and trucks accounts for a small fraction of the domestic used vehicle market. In 2019, more than 40 million used vehicles — and 17 million new ones — were sold, according to Edmunds. Of those 40 million, less than 1 million were exported overseas, according to Commerce Department data.
Still, the United States is the third-largest exporter of used vehicles, behind the European Union and Japan. Additionally, dramatic action is required in the next decade if humanity is to stave off catastrophic warming, according to an International Energy Agency report released this week (Climatewire, May 18).
Electric vehicles currently make up 5% of global automobile sales. That number will need to increase to 60% by 2030, IEA said, and the sale of traditional gasoline- and diesel-powered cars will need to end by 2035.
Ray LaHood, who served as Transportation secretary under former President Obama, said the Biden administration should try to regulate the export of dirty vehicles.
“Part of our responsibility is to clean up the environment in whatever ways we can, not only for our own country but for the world,” he said in an interview. “That has to be a priority.”
Biden administration officials “are going to have to think about whether they take these cars in as trade-ins,” added LaHood, who now serves as co-chair of the Building America’s Future Educational Fund, a bipartisan infrastructure coalition.
Under the Obama administration, LaHood oversaw a federal program called the Consumer Assistance to Recycle and Save (CARS) program — also known as Cash for Clunkers — which provided financial incentives for car owners to trade in their vehicles for new, more fuel-efficient cars and trucks. The program, which was intended to stimulate the post-recession economy and promote the sale of cleaner cars, was enormously popular.
Consumers who traded in their older automobiles and purchased new ones received cash rebates on the spot. Within six weeks of authorizing a $1 billion disbursement, Congress appropriated an additional $2 billion for rebates.
According to a Congressional Research Service report, more than 677,000 rebates were processed, increasing the U.S. gross domestic product by billions of dollars, creating or saving thousands of jobs, reducing fuel consumption by millions of gallons, and significantly slashing carbon emissions.
Traded-in vehicles were supposed to be smashed or otherwise destroyed, but a 2010 Transportation Department Office of Inspector General report found disposal hard to verify. Of the disposal facilities surveyed, the report found that 32% were not in compliance with DOT standards, which required facilities to report the disposal to the National Motor Vehicle Title Information System (NMVTIS).
But at the time of the OIG report’s release in 2010, only 15 states fully participated in the NMVTIS database, which was created to deter vehicle theft and fraud. After Hurricane Katrina, for example, cars that had been declared total losses to be scrapped were resold in other states with forged titles, a process known as title washing. Today, 48 states participate in the program, according to its website. Hawaii, Kansas and the District of Columbia are listed as “in development.”
“[O]ne facility, which received 357 CARS vehicles at the time of our audit, was not aware of NMVTIS and therefore, had not reported any information on the status of those vehicles,” the investigation found. “In addition, one facility we visited did not sign or date the disposal certification forms for the 27 trade-in vehicles it handled.”
Paul Bledsoe, who served as a Department of Energy consultant under Obama and worked on climate change in the Clinton administration, said he worries that many Cash for Clunkers vehicles may have ended up being exported.
“They were shipped overseas to Africa or South America,” Bledsoe, now a strategic adviser for the Progressive Policy Institute, said in an interview last month. “So the Biden team has to make sure [retired vehicles] are permanently retired.”
Today, the Innovation Frontier Project (IFP), a project of the Progressive Policy Institute, released a new report from James Bessen, an economist and Executive Director of the Technology & Policy Research Initiative at Boston University School of Law.
In the report, Bessen argues that new information technology has delivered more and unprecedented convenience for consumers, and good-paying jobs that contribute to overall economic growth. However, limited access to the technology is also contributing to the major economic and social issues of the day: the growing dominance of large firms and the struggle to increase the flow of knowledge, slow productivity growth, rising economic inequality, and the failure of regulation. The challenge for policymakers is to mitigate these negative effects while preserving as many of the benefits as possible to consumers, to workers, and to the economy.
“James Bessen provides a policy framework for thinking about the diffusion of these important digital technologies. The productivity gains that have resulted from proprietary IT investments are vitally important, but now we need to make sure the whole economy can benefit from these advancements.” said Caleb Watney and Alec Stapp, co-leads of the Innovation Frontier Project.
The report draws from his forthcoming book, “Superstar Capitalism”, to be published by Yale University Press.
Based in Washington, D.C. and housed in the Progressive Policy Institute, the Innovation Frontier Project explores the role of public policy in science, technology and innovation. The project is co-led by Caleb Watney and Alec Stapp.
The Progressive Policy Institute (PPI) is a catalyst for policy innovation and political reform based in Washington, D.C. Its mission is to create radically pragmatic ideas for moving America beyond ideological and partisan deadlock. Learn more about PPI by visiting progressivepolicy.org.