FACT: The U.S. collects more tariff money on Pakistani goods than on British goods.
THE NUMBERS:
Imports from U.K., 2022: $63.8 billion
Imports from Pakistan, 2022: $6.0 billion
Tariffs on Pakistani goods, 2022: $607 million
Tariffs on U.K. goods, 2022: $578 million
WHAT THEY MEAN:
National Security Advisor Jake Sullivan in April asserted (mistakenly) that the U.S.’ “trade-weighted average tariff rate is 2.4 percent.” His source for this number is unclear; the actual figure, via the U.S. International Trade Commission (see below for detail on authoritative estimates) for 2021 was 3.0%, and pending their official word the 2022 rate looks like 2.8%.
A single number like this, though, is useful but blurry. The blurriness reflects the fact that the actual 11,414 official tariff rates vary greatly. The 5,864 ad valorem tariffs alone start at 0.1% and go as high as 48.0%, the 1,078 specific duties and compound tariffs add complexity, and both are then complicated by thousands of special waivers and surcharges. Therefore as a buyer, the rates you pay depend both on what you’re buying and from whom you got it, and as a country, it’s unusual to get a rate very close to the ‘average.
To oversimplify, the permanent “MFN” tariff system raised about $45 billion last year. It taxes low-priced clothes, shoes, and other consumer goods most heavily, natural resource products and high-tech goods most lightly, and heavy-industry and food in between. Therefore it hits lower-income families hardest. The Trump era’s administratively created “232” tariffs on metals and “301” tariffs on about half of imports from China brought in about the same amount of money (mainly from Chinese goods), but mainly cover industrial inputs such as metals, auto parts, and electronics, and so fall most heavily on industrial-sector buyers like auto plants, construction firms, and repair shops. Meanwhile, the U.S.’ 20 FTAs and three currently operating developing-country “preference” programs waive most tariffs for buyers of things from Canada, Mexico, Australia, South Korea, 16 other FTA partners, and also for countries in sub-Saharan Africa and the Caribbean littoral. Putting all these things together, in practice the 2.8% average becomes a range rising from 0% (for Cuba) to 15.0% (for Bangladesh), with natural-resource exporters and most African countries near the bottom, high-income countries a bit below the world average, diversified middle-income states very close to the average, and low-income Asian countries along with China at the top.
Here’s a look as of 2022, with a few entries from earlier years to illustrate the impacts of the 232 and 301 tariffs:
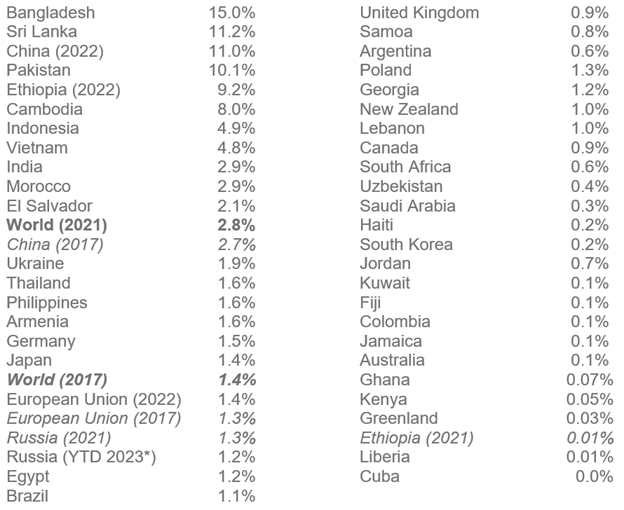
Three explanatory notes for this pattern:
High tariffs on low-income Asia: The high rates at the top reflect the specialization of many lower-income Asian countries — Bangladesh, Sri Lanka, and Pakistan in particular, Cambodia now a bit less so — in exports of clothing and home textiles. This explains why buyers of Pakistan’s modest $6 billion worth of shirts, towels, and similar goods pay fourteen times more than buyers of Norway’s slightly larger $6.7 billion in salmon, oil, and pharmaceuticals, and in fact more than buyers of $63 billion in British medicines, art auction proceeds, and aircraft parts. Ethiopia also shows up here, having lost its AGOA tariff waiver in January 2022 but still exporting somewhat smaller quantities of clothes.
Low-to-medium rate on others: The lowest rates show up for countries that are (a) natural resource exporters (oil for Kuwait and Saudi Arabia, fish for Fiji and Greenland); and (b) FTA partners and special program beneficiaries, with Canada, Jordan, El Salvador, South Korea, and Colombia representing the first group; and Kenya, South Africa, Ghana, Haiti, and Jamaica the second. Larger upper-middle-income and high-income countries — Germany, Poland, Brazil, Argentina, Thailand, Japan — have diversified export mixes, typically with a lot of zero-tariff products, a lot of mid-tariff products, and some high-tariff goods, and usually wind up in a range from 1% to 3%. India is also now in this range, though still a lower-middle-income country. There was only one actual zero-tariff country in the world — meaning, some imports but no tariff revenue collected at all. This weirdly turns out to be Cuba, where trade remains mostly banned, a few licensed U.S. buyers have been buying Cuban artwork, and tariffs on paintings, sculpture, antiques, etc. are all permanently set at zero.
301 & 232 effects: The U.S. worldwide tariff average — that is, the statistic Sullivan was looking for — doubled from 1.4% in 2017 to 2.8% in 2022. The effect of the Trump administration’s “232” steel and aluminum tariffs was small, affecting only about 1.5% of imports and changing average rates for suppliers like the EU, Japan, and Brazil only modestly. The higher global average mainly results from the “301” tariffs on Chinese goods: following these, though China lost some “import market share,” total imports of Chinese goods remained at $500 billion, tariff revenue rose about four-fold, and the average tariff paid by buyers of Chinese goods accordingly rose from 2.7% to 11.0%. This 11.0% is quite high in comparison to the world average — but, pretty remarkably, is still below the normal rates imposed on buyers of Bangladeshi and Sri Lankan goods.
FURTHER READING:
Sullivan’s April global-economy talk.
… and a worried response from PPI’s Ed Gresser.
At home:
PPI’s take on the tariff system as a form of taxation, and its impact on low-income American families and communities.
Case study 1: PPI’s Valentine’s Day blast against the unfair, gender-biased U.S. underwear tariff system.
Case study 2: And reports on the contrast between high tariff rates on cheap stainless-steel spoons, and low ones on sterling silver.
“Average tariff rate”:
The NSC’s neighbors at the Office of Management and Budget report $99.9 billion in “customs duties and fees” in FY2022. This makes the tariff system the fourth-largest federal tax, about equal to the combined revenue totals from the $32.5 billion inheritance taxes, the $46.6 billion gas tax, and the $10.2 billion alcohol and $11.3 billion tobacco excise taxes. Subtracting the two main fees from this total (CBP’s Merchandise Processing Fee and Harbor Maintenance Fee revenue), the result is an average of about 2.8%. The U.S. International Trade Commission annually reports “duties” without the “fees”, but hasn’t yet released its final 2022 figure. For 2021 it got $84.5 billion in tariffs, $2.824 trillion in imports, and a 3.0% overall rate. Their preliminary figure for 2022 is a bit lower, with $90.1 billion in tariffs on $3.277 billion in imports, or 2.75%.
OMB’s Historical Tables offer comparisons with other taxes.
… CBP explains the “fees.”
A long view – The U.S. International Trade Commission tracks U.S. tariff rates from the McKinley Tariff of 1890 to 2021.
The tariff system itself:
From the first chapter (01 for live animals) to the last, (97, for artwork), the tariff system’s 11,414 different eight-digit “lines” are meant to give every physical thing a number and a tax rate. The first line, “0101.21.00” stands for “purebred breeding horses” and is set at zero. The last, “9706.90.00,” is for antiques between 100 and 249 years old and is also zero. Overall, the 11,414 lines include (a) 4,315 set at zero (say, for natural gas, smartphones, paper, toys, and medicines); 5,864 with above-zero “ad valorem” (i.e., percentage) tariffs ranging from 0.1% to a peak of 48% for cheap sneakers; and 1,078 “specific duties” (flat fees) and “compound” tariffs (percentages plus flat fees), where tariff change each year with prices. For example, pinking shears used by tailors and dry cleaners are set at 8% plus 8 cents for each. Adding to the confusion are thousands of exemptions and surcharges coded via letters or set down in alternative chapters 98 and 99.
From the ITC, a two-page summary of the 11,414 U.S. tariff lines — how many zero? how many duty-free under FTAs and preferences? how many “specific duties” and compounds? — etc.
And the actual U.S. tariff system, by chapter or the full 4,352-page book in PDF.
International comparisons:
The World Bank’s interactive table of average tariff rates worldwide and by country uses the same “weighted” approach. It has a worldwide average of 2.6% as of 2017, and rates by country for the most recent available year. The world’s highest rate is Bermuda’s 24.1%, followed by Belize at 18.7%, Gambia 17.8%, and Djibouti 7.6%. The lowest are the zeroes for Hong Kong and Macao. Use this with care; its 1.5% figure for the U.S., though correct for 2017, is dated “2020” and isn’t right.
The WTO’s World Tariff Profiles 2022 has more detail, with simple averages, trade-weighted averages, “tariff peak” counts, ag vs. non-ag., and more for 151 countries.
ABOUT ED
Ed Gresser is Vice President and Director for Trade and Global Markets at PPI.
Ed returns to PPI after working for the think tank from 2001-2011. He most recently served as the Assistant U.S. Trade Representative for Trade Policy and Economics at the Office of the United States Trade Representative (USTR). In this position, he led USTR’s economic research unit from 2015-2021, and chaired the 21-agency Trade Policy Staff Committee.
Ed began his career on Capitol Hill before serving USTR as Policy Advisor to USTR Charlene Barshefsky from 1998 to 2001. He then led PPI’s Trade and Global Markets Project from 2001 to 2011. After PPI, he co-founded and directed the independent think tank Progressive Economy until rejoining USTR in 2015. In 2013, the Washington International Trade Association presented him with its Lighthouse Award, awarded annually to an individual or group for significant contributions to trade policy.
Ed is the author of Freedom from Want: American Liberalism and the Global Economy (2007). He has published in a variety of journals and newspapers, and his research has been cited by leading academics and international organizations including the WTO, World Bank, and International Monetary Fund. He is a graduate of Stanford University and holds a Master’s Degree in International Affairs from Columbia Universities and a certificate from the Averell Harriman Institute for Advanced Study of the Soviet Union.
Read the full email and sign up for the Trade Fact of the Week