One of the hottest social media apps these days is Paris-based BeReal. Released in 2020, BeReal encourages users to share a photo of themselves and their immediate surroundings at a random time every day.
BeReal is more than a fun app: It’s also part of France’s dynamic App Economy, which is helping to drive the country’s job growth and the development of core IT skills. For example, as of May 2023, BeReal was looking to hire a QA Engineer to create automated testing for the company’s iOS and Android apps.
But the French App Economy is not just light-hearted entertainment. The Directorate General for Armaments (DGA), a directorate of the French Ministry of the Armed Forces, was advertising for an “Ingénieur développeur iOS ou Android cybersécurité.” Indeed, such cybersecurity skills are essential to every part of the modern economy.
From social media to defense and health and manufacturing, and everything in between, the French App Economy includes 611,000 jobs. That’s according to the Progressive Policy Institute’s latest estimate, and it’s up 41% from our pre-pandemic 2019 estimate.
None of these jobs existed 15 years ago, when Apple first opened the App Store on July 10, 2008, in the middle of the global financial crisis. Android Market (which later became Google Play) was announced by Google shortly after. These app stores created a new route through which software developers could write programs for smartphones. These mobile applications — called “apps” — could then be distributed to the rapidly growing number of smartphone users around the world.
The jobs generated by the app stores became an important part of the recovery from the financial crisis of 2008-2009, the subsequent economic expansion, and the response to the pandemic. More than that, app development and the app stores became a key route by which young people can develop tech skills and became an integral part of the digital economy.
This report describes some important aspects of the French App Economy. We also give some examples of App Economy jobs and skills development.
2023 marks the 15th anniversary of the creation of the App Economy, which has played a significant role in the United Kingdom’s economic growth. Today, the Progressive Policy Institute (PPI) released a new report “The UK App Economy: 2023” finding that the App Economy is responsible for 667,000 jobs in the United Kingdom as of May 2023. That accounts for roughly 20% of the total net gain in U.K. jobs since 2008, when the Apple App Store and the Android Market, precursor to Google Play, first opened.
Report authors Michael Mandel, Vice President and Chief Economist, and Jordan Shapiro, Director of the Innovation Frontier Project, outline the new estimates of the job growth created by the App Economy, as well as how the App Economy has provided a route into the digital workforce for people who come from varied backgrounds.
“The App Economy has helped drive job growth in the United Kingdom for the past 15 years,” said Dr. Michael Mandel.“These positive trends seem to be continuing and it’s important to continue to expand the digital workforce to reflect these new opportunities.”
As digital jobs continue to grow, so does the demand for new digital skills. But supply for these skilled jobs continues to lag as workforce shortages persist across the tech industry. To address this issue, Taylor Maag, Director of Workforce Policy at the Progressive Policy Institute, released a new report titled “Closing the Digital Skills Gap: Unveiling Insights for Four Countries.” The report outlines the barriers confronting workers who want to acquire skills and examines four countries’ efforts to address the digital skill divide.
By the numbers:
667,000 jobs in the U.K. App Economy, up 75% since 2019
Across Europe and the U.S., job requirements for digital skills have increased by 50%
On Tuesday evening, PPI and its Mosaic Project will host a panel event with the British Computer Society and Women Who Code London, celebrating the 15th anniversary of the app economy and discussing these new reports.
Read and download the “UK App Economy” report here and the “Closing the Digital Skills Gap” report here.
The Progressive Policy Institute (PPI) is a catalyst for policy innovation and political reform based in Washington, D.C., with offices in Brussels, Berlin and the United Kingdom. Its mission is to create radically pragmatic ideas for moving America beyond ideological and partisan deadlock. Learn more about PPI by visiting progressivepolicy.org.
What is the future of the U.K. App Economy? According to the Progressive Policy Institute’s latest estimate, the United Kingdom App Economy includes 667,000 jobs.
None of these jobs existed 15 years ago, when Apple first opened the App Store on July 10, 2008, in the middle of the global financial crisis. Android Market (which later became Google Play) was announced by Google shortly after. These app stores created a new route through which software developers could write programs for smartphones. These mobile applications — called “apps” — could then be distributed to the rapidly growing number of smartphone users around the world.
The jobs generated by the app stores became an important part of the recovery from the financial crisis of 2008-2009, the subsequent economic expansion and the response to the pandemic. More than that, app development became a key route by which young people can develop tech skills and became an integral part of the digital economy.
This report describes some important aspects of the U.K. App Economy. We also give some examples of App Economy jobs and skills development.
Just decades ago, the internet was an entirely new concept, but it’s become second nature for billions of people and is now embedded into daily life across the world. While the internet is old news, there are recent technologies like blockchain, artificial intelligence (AI), and the cloud that have gone from niche, specialized roles in the global economy to the mainstream. This rapid and widespread digitalization has changed the nature of work, and as a result, digital skills are now regarded as essential for the modern workforce — across Europe and the U.S., job requirements for digital skills have gone up by 50%.
While this transformation has been underway for decades, the pandemic accelerated it. Not only did the crisis change how businesses operate and the way we work, but it also influenced people’s reliance on technology. Individuals and businesses were suddenly dependent on the internet, their smartphones, and their mobile applications for critical daily activities like work, shopping, and communication with loved ones. A 2022 report from PPI found that the App Economy became an increasingly indispensable part of the U.S. economy during the pandemic. Existing mobile applications were able to respond to soaring demand without significant outages and app developers were also able to quickly create new apps to meet the human and economic needs.
Additionally, this year’s World Economic Forum Jobs report — which lifted up perspectives from 803 companies that collectively employ more than 11.3 million workers across 27 industry clusters and 45 economies across the world — found that technology adoption will remain a key driver of business transformation for the next five years, with over 85% of organizations identifying that increased adoption of new and frontier technologies and broadening digital access will be priorities for their organization. Eighty-six percent of companies surveyed also stated that digital platforms and apps are the technologies most likely be incorporated into their operations in the next five years.
It’s clear the reliance on technology from individuals and business is not going away anytime soon and will continue to grow as emerging technologies and solutions are developed and adopted. To keep pace with this demand — while also ensuring business has the skilled talent to remain competitive — digital and tech-related skills will be increasingly necessary for workers to succeed in the global labor market.
While demand for digital skills is growing, unfortunately supply is lower than it needs to be. Workforce shortages persist across the tech industry with employers struggling to find skilled talent that is prepared for digital roles. And this gap continues to widen. A 2021 Rand Corporation report found that the global digital skills gap was widening due to the following factors: tech talent outpacing an already short supply (in fact, 54% of American workers believe technology will advance faster than workforce skills); high costs and disorganized approaches to traditional education that increase barriers to learning; access to digital infrastructure and skills limited by socio-economic status (76% of global workers don’t feel they have the resources needed to learn digital skills).
These findings highlight the barriers confronting workers who want to acquire digital skills. The report also estimates that because of digital skills gaps, 14 of the G20 countries could miss out on $11.5 trillion in cumulative GDP growth. Policymakers around the world need to tackle this problem, both to ensure their industries and businesses can keep pace with the rate and scale of technological innovation, but also to ensure current and future workers will have more opportunities to develop the skills needed to succeed in changing labor markets.
Join the Progressive Policy Institute (PPI), its Mosaic network, and Women Who Code Berlin in celebrating the tremendous growth of the App Economy over the past 15 years!
First, hear from a series of notable speakers on the growth of the App Economy over the past 15 years. Then, hear from an impressive panel of policy experts and local app developers about their experience working in the App Economy, the development of digital skills and the value apps add to the broader German economy.
Please note: The opening remarks and panel discussion will be conducted in English.
Cocktail reception begins at 18:30
Following the panel, we will host a reception where folks can network with likeminded technologists, app developers and coders. Enjoy free food and drinks while building new connections with tech professionals from around the world.
Join the Progressive Policy Institute (PPI) and its Mosaic network in celebrating the tremendous growth of the App Economy over the past 15 years!
When: Thursday, 22 June 2023 from 17:00–20:00
Where: STATION F: (Open Stage): 5 Parv. Alan Turing, 75013 Paris, France
Doors open at 17:00
First, hear from a series of notable speakers on the growth of the App Economy over the past 15 years. Then, hear from an impressive panel of policy experts and local app developers about their experience working in the App Economy, the development of digital skills and the value apps add to the broader French economy.
Cocktail reception begins at 18:30
Following the panel, we will host a reception where folks can network with likeminded technologists, app developers and coders. Enjoy free food and drinks while building new connections with tech professionals from around the world.
More panelists to be announced…
Please note: The opening remarks and panel discussion will be conducted in English.
Join the Progressive Policy Institute (PPI) and its Mosaic network in celebrating the tremendous growth of the App Economy over the past 15 years!
When: Tuesday, 20 June 2023 from 17:00–20:00 BST
Where: BCS, The Chartered Institute for IT (Ground Floor): 25 Copthall Avenue, London, EC2R 7BP
Doors open at 17:00 BST
First, hear from a series of notable speakers on the growth of the App Economy over the past 15 years. Then, hear from an impressive panel of policy experts and local app developers about their experience working in the App Economy, the development of digital skills and the value apps add to the broader UK economy.
Cocktail reception begins at 18:30 BST
Following the panel, we will host a reception where folks can network with like-minded technologists, app developers and coders. Enjoy free food and drinks while building new connections with tech professionals from around the world.
Japan has embraced the need for a “digital transformation” to boost productivity and spur regional growth. Achieving this digital transformation will require innovative and secure mobile applications in industries such as healthcare, manufacturing, agriculture, energy, and transportation.
However, the creation and adoption of the next generation of innovative and secure mobile apps could be slowed by regulations now being considered for mobile platforms in Japan, according to a new report released March 17 by the Progressive Policy Institute. Such regulations could unintentionally open the door to cybersecurity threats and undermine the very features of app stores that make them so effective in encouraging innovation and security. The result: A slower pace of digital transformation. The report is titled, “How the Economics and Regulation of Mobile Platforms Affects Japan’s Digital Transformation and Cybersecurity” and is authored by PPI’s Vice President and Chief Economist Dr. Michael Mandel.
The analysis in this report, while focused on Japan, is applicable to other countries as well. “Mobile apps are essential for digital transformation. Today’s app stores play a key role in ensuring that mobile apps are both innovative and secure,” said Dr. Michael Mandel. “Mobile platform regulations should be carefully scrutinized to avoid a ‘race to the bottom’ that would reduce cybersecurity, slow innovation and hinder digital transformation.”
The Progressive Policy Institute (PPI) is a catalyst for policy innovation and political reform based in Washington, D.C. Its mission is to create radically pragmatic ideas for moving America beyond ideological and partisan deadlock. Learn more about PPI by visiting progressivepolicy.org.
In 2018, the Ministry of Economy, Trade, and Industry (METI) published the “Digital Transformation (DX)” report, warning the Japanese economy would suffer from massively slower growth without increased investment in IT hardware and software. Moreover, Japanese companies were encouraged to place a greater emphasis on digital business models. A series of follow- up reports, notably DX Report 2.1, identified four different strategies companies can employ toward transforming to create a digital industry.
More recently, Prime Minister Fumio Kishida has described his vision of a Digital Garden City Nation, where investment in innovative digital technologies would help revitalize regional economies. This includes implementing digital services to solve rural issues.
An essential aspect of digital transformation and innovation is the heavy use of mobile platforms and apps to provide these digital services to users. Mobile apps are essential for the digital transformation of industries such as healthcare, manufacturing, agriculture, energy, and transportation. For example, the digital transformation of health care requires linking doctors, nurses, and other health care professionals wirelessly with patients and with electronic health records. Digital transformation of agriculture requires the use of precision wireless sensors and mobile apps to allow farmers to monitor conditions in the fields for optimal productivity. Digital transformation of manufacturing requires mobile apps that allow factory workers to monitor robots and sophisticated machinery.
How important are mobile apps and mobile platforms for digital transformation and innovation? By PPI’s analysis, roughly 25% of the help-wanted ads for tech workers in Japan mention the need for App Economy skills such as knowledge of the iOS or Android mobile operating systems. That suggests that Japanese employers see a strong need for workers who have the ability to develop and maintain mobile applications.
Indeed, the current mobile application ecosystems, built around the iOS and Android operating systems and the mobile app stores, can provide a good role model for overall digital transformations. These ecosystems have proven successful over the past 15 years in accelerating innovation and encouraging the development of new applications. First, the mobile application ecosystems provide low-cost distribution services for small- and medium-size app developers that they cannot provide themselves. Second, while the iOS and Android ecosystems take somewhat different approaches, the current mobile app stores devote large amounts of technological and human resources to screening out malware and enforcing security standards. The result is that users are willing to download and adopt innovative apps.
Given the effectiveness of the current system in encouraging innovation, this paper addresses the question of whether new regulations now being considered for mobile app stores have a negative impact on security and business activities, with the potential to delay or hinder the digital transformation of the Japanese economy. The problem is that regulators may accidentally undermine the very features of the app stores that make them so effective at encouraging innovation. In particular, regulations that mandate sideloading make it more difficult for the existing app stores to screen for malware and other security issues can lead users to be less trusting of innovative new applications that might control their homes, their cars, their medical devices, and their factories.
Already, Japanese government websites have come under attack by Russian hackers. National security considerations suggest that the security of the mobile application ecosystem should be a high priority for regulators. Less effective screening of new apps, if mandated by government regulators, will also make the digital transformation of the Japanese government more difficult.
• In section 2, “The App Store Ecosystem and Digital Transformation (DX),” we show how app innovation is essential to Japan’s digital transformation (DX). In particular, mobile apps are essential for allowing users to interact with enterprise-level IT systems.
• In section 3, “Quantifying the Economic Importance of the App Store Ecosystem for Digital Transformation and Innovation,” we estimate the contribution of the app store ecosystem to digital transformation. As noted earlier we find that roughly 25% of tech job postings in Japan require app economy skills. Our methodology is described in the Appendix to the paper.
• In section 4, “The Economic Link Between Innovation and a Secure App Store Ecosystem,” we show that developers and consumers both benefit from a secure app store ecosystem. The ability of users to download new apps in safety has fostered innovation, and the expansion of app markets, which in turn had fed back to more innovation.
• In section 5, “Allowing Sideloading and Other New App Store Regulations May Hinder Digital Transformation,” we show how new app store regulations can reduce security
and hurt developers and users. The result, from an economic perspective, will be to hinder the process of digital transformation.
• In section 6, “Why the European model of tech regulation doesn’t work in Japan,” we discuss the European model of tech regulation, and show how it has led to slower productivity growth and less innovation. This has important implications for Japan, which has been considering an even stricter version of the European approach.
As we move into 2023, the digital sector still faces the key regulatory issues that dominated the previous year: Competition, privacy, and content moderation. But as the legislative, executive, and judicial branches tackle these critical questions, it is important to look back and assess the performance of the digital sector on the key economic metrics of job growth and inflation.
For clarity we split the digital sector into three subsectors:
E-commerce/retail (“movement of goods”)
Internet/content/broadband (“movement of data”)
Computer/communication manufacturing (“hardware”)
E-commerce/retail: To compete with e-commerce leaders such as Amazon, retailers with a large physical presence such as Walmart and Target have been scaling up their investment in online sales and fulfillment. At the same time, smaller retailers increasingly use online ordering, so the boundary between “brick-and-mortar” and e-commerce has become increasingly porous. Moreover, privacy and content moderation issues such as accountability for user reviews impact all retailers. In addition to retail, this subsector also includes local delivery (NAICS 492) and fulfillment (NAICS 493).
Internet/content/broadband: With the advent of social networks and streaming, the line between content creation and content distribution has become blurry. Considerations of privacy and content moderation are high on the policy checklist. This subsector includes content creation and distribution (video, audio, print); broadband and broadcasting; wireless; software; internet publishing and search; and computer systems design.
Hardware: Especially with the funding from the CHIPS Act and the focus on export controls, this subsector is facing a different set of policy issues. We include computer and electronic equipment manufacturing, and related wholesaling.
Job Growth
(Note:These figures have been updated to account for the 2/3/23 revisions to the job data)
As of December 2022, the United States currently enjoys a 3.5% unemployment rate, the same as pre-pandemic February 2020. To a large extent, this strong labor market has been driven by job growth in the digital sector. In total the digital sector added 1.4 million net new jobs from 2019 to 2022, accounting for 67% of net private sector job gains over the same period. Table 1 breaks down the pandemic job growth by digital subsector.
We see that the e-commerce/retail subsector accounted for net job growth of 926,000 jobs from 2019 to 2022, or 44% of private sector job growth, as consumers embraced online shopping during the pandemic, and retailers and third-party logistics companies built and staffed fulfillment centers.
The internet/content/broadband subsector created 472,000 jobs, accounting for 22% of private sector job growth. Altogether, the digital sector accounted for 67% of private sector job growth from 2019 to 2022.
The importance of the digital sector for job growth is emphasized when we look at production and nonsupervisory workers, who generally are less educated and lower-paid (Table 2). The digital sector has created 1.1 million net new production and nonsupervisory jobs from 2019 to 2022, while the rest of the private sector has lost almost 500,000 production and nonsupervisory jobs.
In particular, the e-commerce/retail subsector has added 812,000 production and nonsupervisory jobs during the three pandemic years. That’s likely to reflect the growth of e-commerce fulfillment and delivery workers. This gain was essential to the recovery because the rest of the private sector has still not regained its pre-pandemic level of production and nonsupervisory employment.
From the perspective of policy, the current regulatory structure turned out to encourage strong job growth in a difficult economic environment. That’s not to say the current regulations cannot be improved, but we should be wary of making major changes without understanding the consequences for jobs.
Table 1. Digital Sector Drives Job Growth During Pandemic
2019-2022
Increase in jobs, thousands
Share of private sector growth
Private sector
2,133
E-commerce/retail*
926
44%
Internet/content/broadband**
473
22%
Hardware***
22
1%
Data: BLS, PPI calculations
Table 2. …Especially for Production and Nonsupervisory Jobs
2019- 2022
Increase in production and nonsupervisory jobs, thousands
Share of private sector growth
Private sector
665
E-commerce/retail*
812
122%
Internet/content/broadband**
306
46%
Hardware***
24
4%
Data: BLS, PPI calculations
Inflation
Before the pandemic, the digital sector had significantly lower inflation than the economy as a whole, whether measured by producer prices or consumer prices. During the pandemic period, overall consumer price inflation accelerated by approximately 3 percentage points, from roughly 1.5% annually in the pre-pandemic period (2012-2019) to roughly 4.5% annually during the pandemic years (2019-2022).
However, the acceleration of inflation was much smaller in the digital subsectors. For example, inflation in the internet/content/broadband subsector only accelerated by 0.3 percentage points when measured by producer prices, and 1.7 percentage points when measured by consumer prices.
Please note that the BLS does not publish a separate measure of e-commerce inflation for consumer goods and services, which is why that line is missing from Table 4. However, in a 2022 paper written for PPI’s Innovation Frontier Project, Marshall Reinsdorf wrote that “the pandemic greatly accelerated adoption of digital innovations such as e-commerce, so it’s reasonable to suspect that the price statistics are undercounting the impact of low digital inflation.”
From the perspective of policy, it’s reasonable to say that the current regulatory structure allowed digital companies to behave in a way that muted the pressure to increase prices. Especially given the inflationary bias in today’s economy, the government should be wary of making changes that impose large new costs on digital companies.
Table 3. Digital Producer Price Inflation Stays Low
Average annual price increase
2012-2019
2019-2022
Increase in inflation rate, percentage points
Final demand less food and energy
1.7%
4.7%
3.0%
Electronic and mail order shopping services*
1.5%
1.8%
0.3%
Internet/content/broadband**
0.7%
1.6%
0.9%
Hardware***
-1.0%
1.1%
2.1%
Based on median inflation for subsectors with multiple products or industries.
Data: BLS, PPI calculations
Table 4. Digital Consumer Price Inflation Stays Low
Average percentage price increase
2012-2019
2019-2022
Increase in inflation rate, percentage points
Consumer prices
1.5%
4.6%
3.1%
Internet/content/broadband**
-0.4%
1.3%
1.7%
Hardware***
-7.6%
-5.6%
1.9%
Based on median inflation for subsectors with multiple products or industries.
Data: BLS, PPI calculations
Appendix: Categories
In this section we define the three digital subsectors, and which statistical series we use to calculate jobs, producer price inflation, and consumer price inflation for each of them. Please note that for subsector inflation measures, we aggregate multiple price series using median inflation rather than weighted means.
*E-commerce/retail
In previous work, we distinguished between ecommerce and brick-and-mortar retail. That distinction is no longer appropriate, because retailers with large physical presence such as have also been building out their online ordering and fulfillment operations. Moreover, the latest NAICS codes do not break out electronic shopping as a separate industry anymore.
Employment data
Retail sector (including online ordering and fulfillment operations for single companies)
Couriers and messengers (including local delivery)
Warehousing and storage (including fulfillment centers)
Producer price inflation data
Electronic and mail order shopping services
** Internet/content/broadband
In earlier work, we used a narrower definition of tech. As barriers have become blurred between content and distribution, and various modes of distribution, it has become appropriate to broaden the definitions.
Employment data
Motion picture and sound recording industries
Publishing industries, including software
Broadcasting and content providers, including social networks and streaming services
Telecommunications
Computing infrastructure providers, data processing, and web hosting, including cloud computing
Web search portals, libraries, archives, and other information services.
Computer systems design and related services
Producer price inflation data
Bundled access services
Cable and other subscription programming
Data processing and related services
Internet access services
Internet publishing and web search portals (including advertising)
Software publishers
Video programming distribution
Wireless telecommunications carriers
Information technology (IT) technical support and consulting services (partial)
Consumer price inflation data
Wireless telecom services
Residential telecom services
Internet services and electronic information providers
Cable and satellite television service
Video discs and other media
Recorded music and music subscriptions
***Hardware
In previous work, we did not split out hardware. But the recent CHIPS legislation, and the focus on rebuilding the U.S. domestic semiconductor industry, means that it is appropriate to break out hardware separately. We note that the employment data includes relevant wholesalers, who may be “factoryless” firms designing and marketing digital products, but not actually manufacturing them.
Employment data
Computer and electronic product manufacturing
Computer and computer peripheral equipment and software merchant wholesalers
Producer price inflation data
Communications equipment manufacturing
Computer & peripheral equipment manufacturing
Semiconductor and other electronic component manufacturing
Consumer price inflation data
Computers and peripherals
Computer software
Telephone hardware, calculators, and other consumer information items
You’re Invited! Webinar: Platform Work and the Care Economy Wednesday, January 18th at 2:00 PM ET
On the average day, 36% of working-age Americans provide unpaid care for children, parents and other loved ones. This unpaid labor is worth $980 billion per year, according to a recent PPI report.
This webinar with Dr. Michael Mandel and joined by Cora Mandapat, a Lyft Driver and Caregiver, will discuss how the stress of this immense burden can be eased by the availability of flexible platform work, including companies such as Lyft, Uber, Doordash, and Instacart. Platform work provides an alternative that offers better scheduling and earning opportunities for unpaid caregivers. We’ll also discuss the possibility that platform work may help narrow the longstanding gender gap in unpaid caregiving.
Korea is one of the leading technology countries in the world. By some measures, Korea’s manufacturing sector is more diversified and complex than U.S. manufacturing.
In this report, we focus on one aspect of Korea’s technological strength: the App Economy, which reflects the employment of workers to develop, maintain, and support mobile applications. The global App Economy expanded rapidly during the pandemic. Individuals and businesses were suddenly dependent on the internet, their smartphones, and their mobile applications for critical daily activities like work, shopping, and communication with loved ones. The App Economy, already important, became an increasingly indispensable part of the real economy.
In Korea, the pandemic was much more controlled compared to the United States and Europe. Still, almost overnight, huge swathes of economic activity that relied on face-to-face interactions were forced into virtual mode. In Korea, time spent on mobile applications rose from 4.1 hours in 2019 to 5.0 hours in 2021, the third highest in the world.
Even as the pandemic enters a milder stage largely due to vaccines, many jobs and economic interactions are still remote, placing an increased premium on mobile communications. After a slow start because of government regulations, Korean health organizations have learned about the usefulness of telemedicine apps. Korean financial companies like Toss and Kakao Bank are increasingly doing transactions through their mobile apps. Delivery apps are also still experiencing booming business.
In Korea, as in other countries, the increased prominence of the App Economy is reflected in the growing number of jobs that required App Economy skills. We did our first report on Korea’s App Economy in 2018, using detailed data on job postings as our major tool for analysis. In this 2022 report, we update our previous estimate, finding that Korea has 516,000 App Economy jobs as of July 2022, a number that is highly competitive globally. We end with a brief discussion of policy.
MEASURING THE APP ECONOMY
As the App Economy grows in significance globally, it becomes essential to have a consistent set of App Economy job estimates so that policymakers can compare their country’s performance with that of other countries. However, official economics statistics do not provide an easy way to measure the size of the App Economy. In response, PPI developed a methodology based on a systematic analysis of online job postings. In particular, we look for job postings that call for app-related skills such as knowledge of iOS or Android. We issued our first App Economy report for the United States in 2012. Since then, this methodology has been applied to a wide variety of countries, languages, and economic environments.
Our goal is to produce a set of globally-consistent and credible estimates for App Economy employment by individual countries, by broad geographical regions, and in some cases by major cities. The ultimate objective is to be able to track the growth of the App Economy globally, and to see which countries are benefitting the most. Ideally, we should be able to link App Economy growth to policy measures implemented by governments. For this study, a worker is in the App Economy if he or she is works in:
• An information and communications technology (ICT) related job that uses App Economy skills — the ability to develop, maintain, or support mobile applications. We will call this a “core” App Economy job. Core App Economy jobs include app developers; software engineers whose work requires knowledge of mobile applications; security engineers who help keep mobile apps safe from being hacked; and help desk workers who support use of mobile apps.
• A non-ICT job (such as human resources, marketing, or sales) that supports core App Economy jobs in the same enterprise. We will call this an “indirect” App Economy job.
• A job in the local economy that is supported by the income flowing to core and indirect App Economy workers.
These “spillover” jobs include local retail and restaurant jobs, construction jobs, and all the other necessary services.
To estimate the number of core App Economy jobs, we use a multi-step procedure based on data from the universe of online job postings. Our first observation is that online job postings typically describe the skills and knowledge being sought by the employer. For example, if a job posting requires that the job candidate have experience developing apps for iOS or Android, then we can reasonably conclude that the posting refers to a core App Economy job. The methodology section at the end of the paper describes the procedure in detail.
RESULTS
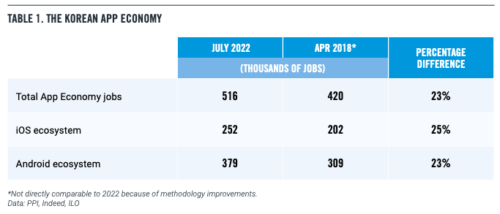
Table 1 presents an estimate of App Economy jobs in Korea. We estimate that Korea has 516,000 App Economy jobs as of July 2022. This figure includes a conservative estimate of spillover jobs. Our methodology also allows us to estimate the relative share of mobile operating systems in Korea’s App Economy. We find that the iOS ecosystem includes 252,000 jobs, and the Android ecosystem includes 379,000 jobs. The two numbers sum to more than the total because many App Economy jobs belong to both ecosystems.
These figures are 23% to 25% higher than our previous 2018 estimates for Korean App Economy employment. Because of improvements in the implementation of the methodology, the number are not directly comparable. Nevertheless, this increase across the pandemic years is similar to what we see in other countries.
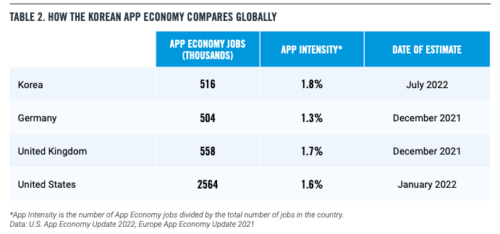
Table 2 compares Korea’s App Economy with the United States, Germany, and the United Kingdom, three large technologically advanced countries (we currently do not have a public estimate for China or a recent report for Japan). Korea has roughly the same number of App Economy jobs as Germany, somewhat less than the U.K., and much fewer than the U.S.
However, a better measure for comparing the App Economy of countries of different size is “App Intensity.” We define App Intensity as the number of App Economy jobs divided by the total size of employment. We see from Table 2 that Korea’s App Intensity of 1.8% is higher than the U.K., the U.S., and Germany.
Another way of assessing the strength of Korea’s App Economy is to look at the nationality of the companies who are doing well in terms of downloads and consumer spend. In 2021, measured by number of downloads, 9 out of the top 10 companies are headquartered in Korea, led by NAVER, Kakao, and SK Group. Measured by consumer spend, 8 out of the top 10 companies are Korean.
It’s useful to compare Korea with Germany’s App Economy. The two countries have roughly the same number of App Economy workers. But in Germany, only 3 out of the top 10 companies measured by downloads are headquartered in Germany, and only 2 of the top 10 by consumers spending. Five are headquartered in the United States, two are headquartered in the U.K., and one is headquartered in China.
POLICY AND CONCLUSIONS
Korea’s App Economy has entered an interesting period of development and regulation. Up to now, the Korean App Economy has been a sizable contributor to national employment. But notably, it was based on a system where much of the cost of building, maintaining, and supporting the Korean app infrastructure has been provided by non-Korean firms, Apple and Google. At the same time, these companies received a share of download fees and in-app purchases. In effect, Apple and Google were getting a financial return on investing in the Korean App economy.
Korea implemented new regulations on the Apple App Store and Google Play as of March 2022, which required Apple and Google to give developers more choices for in-app payment systems. In response, the two U.S. tech companies reduced their commission somewhat for developers who used alternative payment systems. In addition, Apple required developers to provide a separate binary for Korean iOS apps that use non-Apple payment systems. That’s one step toward a globally fragmented internet.
The group of Korean companies that monetize their apps through download fees and in-app purchases — many of which are gaming and entertainment companies — would prefer that Apple and Google charge even lower commission rates. However, there is a much larger second group et of Korean companies whose apps do not charge significant download fees or make heavy use of in-app purchases. This second group would likely prefer the current system, because they benefit from distribution and malware screening services for virtually no cost. This second group would include banks, retailers, manufacturers, providers of telemedicine services, providers of travel apps, and virtually any app connected with the physical economy.
Security and privacy concerns will also be important for policy going forward. Apple and Google follow different mobile app development and distribution strategies, with Google taking more of an open approach and Apple restricting app downloads to the App Store. Nevertheless, both companies devote huge technological resources to scanning apps uploaded to their official stores for malware. These investments have helped fuel the success of the Korean App Economy, which has been built on trust that downloaded apps will be safe. Regulators who underestimate security and privacy concerns run the risk of undercutting consumer trust in the mobile app ecosystems, and making it more difficult to use apps for key functions such as banking and health.
Finally, there is a broader issue as well. As one of the most technologically advanced countries in the world, Korean companies sell products and services globally, including cutting-edge chips, which embody large amounts of investment and intellectual capital. The question is whether Korea should be in favor of a global regulatory regime which intervenes in new technologies and significantly reduces the return on successfully-invested capital. That’s not the way to achieve global growth or national success.
Read the full report and download the report in English or Korean:
A new report on the Korean App Economy released today by the Progressive Policy Institute shows the prominence of the App Economy in Korea — reflecting the employment of workers to develop, maintain and support mobile applications — has grown as more jobs require app-based skills. The new report shows significant gains in App Economy jobs since our previous report on the Korean App Economy, published in May 2018. The new report also finds that Korea’s “app intensity” exceeds that of Germany, the United Kingdom, and the United States. This report is authored by PPI’s Vice President and Chief Economist, Dr. Michael Mandel.
“Korea’s App Economy is highly competitive globally,” said Dr. Michael Mandel. ”The key question is whether a new wave of regulation will help or hurt the functioning of the Korean App Economy.”
The Progressive Policy Institute has developed a methodology to measure App Economy jobs and shifting trends, publishing their first report for the United States in 2012. Since, this methodology has been applied to a wide variety of countries, languages, and economic environments. The first Korean App Economy report was published in 2018.
The Progressive Policy Institute (PPI) is a catalyst for policy innovation and political reform based in Washington, D.C. Its mission is to create radically pragmatic ideas for moving America beyond ideological and partisan deadlock. Learn more about PPI by visiting progressivepolicy.org.
In the second year of the pandemic, European App Economy jobs continued to grow. Looking at the largest countries where we have the most reliable data, France has an estimated 484,000 App Economy jobs as of December 2021, Germany has 504,000 App Economy jobs, and the United Kingdom has 558,000 App Economy jobs (table below).
We estimate that the 30-country total (the European Union plus United Kingdom, Norway, and Switzerland) is 3.034 million App Economy Jobs. That’s up 28% from a revised 2019 App Economy employment level of 2.378 million. (For more information on the underlying methodology used for these estimates, see the appendix to “The App Economy in Europe: Leading Countries and Cities, 2017.” For details of the latest updated methodology, see section below. Note that the estimates in Table 1 are not directly comparable to previously published European country estimates for 2019 and 2020, which have been revised.)
Focusing on mobile operating systems, we estimate that 2.276 million European App Economy workers belong to the iOS ecosystem as of December 2021, up 28% from 2019’s revised numbers. We estimate that 2.486 million European App Economy workers belong to the Android ecosystem as of December 2021, also up 28% from 2019.
In other words, the App Economy has been a major source of job growth for the broader European economy during the pandemic. These App Economy jobs kept the economy going during the tough early months and then continuing to expand even as the pandemic moved into a new phase.
Some examples: Handelsblatt, Germany’s leading business and financial newspaper, is looking for an IOS developer as of early January 2022. TWT Digital Health in Heidelberg was looking for a mobile developer with iOS skills. In Paris, Withings, a consumer electronics company building an ecosystem of connected devices and apps, was looking for an Android developer to help develop health-related applications. In Bristol, UK, Dyson was hiring an iOS mobile developer. In London, Plum Fintech, a developer of personal savings assistants for consumers, was hiring an Android Engineer. In Barcelona, wefox, one of Europe’s largest insurance startups, was looking for an iOS developer. In Valencia, Happÿdonia, a startup founded in 2018 that provides custom corporate social networks, was looking for an Android developer.
Looking at more recent App Economy job postings, as of May 2022, Albert Heijn, the largest supermarket chain in the Netherlands, was looking for an iOS Mobile developer in Zaandam, just north of Amsterdam. ABN AMRO, a large bank, was looking for an Android developer in Amsterdam. In May 2022 the Italian software company Zucchetti posted a job opening for an IOS / Android developer in Perugia, in the Umbria region. MindTek, an app developer firm based in Bergamo, Italy, was looking for an iOS/Android mobile application developer.
In Göteborg, Sweden, the Volvo Group was advertising for an Android developer as of May 2022. Perigee was looking for an iOS developer in Malmö, Sweden, to help build apps that promote healthy habits. Electrolux was looking for an Android developer in Stockholm. London-based WeAre8 was looking for an Android developer in its new R&D center in Thessaloniki, Greece, to help build a socially-minded digital ad platform.
Table 1. The European App Economy, December 2021
December 2021 (preliminary)
Thousands of jobs
Total App Economy
iOS ecosystem
Android ecosystem
Austria
33
23
29
Belgium
43
34
36
Czech Republic
52
38
41
Denmark
54
46
42
Finland
71
54
67
France
484
307
409
Germany
504
401
408
Greece
19
13
15
Hungary
31
21
25
Ireland
31
25
23
Italy
127
88
107
Luxembourg
5
4
4
Netherlands
267
219
197
Norway
53
39
46
Poland
121
81
99
Portugal
57
42
42
Romania
35
28
29
Spain
159
121
135
Sweden
134
96
114
Switzerland
68
56
54
United Kingdom
558
442
457
30 countries*
3034
2276
2486
*Includes estimates for Bulgaria, Croatia, Cyprus, Estonia, Latvia, Lithuania, Malta, Slovakia, and Slovenia.
Data: ILO, Eurostat, Indeed, PPI
Revisions and Updated Methodology
To better track App Economy jobs during the pandemic, we updated the methodology that was described in detail in the appendix to “The App Economy in Europe: Leading Countries and Cities, 2017.” The biggest change was to construct more timely estimates of the number of “information and communications technology (ICT) professionals” by country, which form an essential input into our estimation methodology.
In the past we had used the most recent available government data, which sometimes lagged by a year or more. That’s obviously not sufficient during the pandemic. Instead, now we use a procedure that generate a current estimate of ICT professionals. We start with the most recent number of ICT professional employees, as reported by the International Labour Organisation (ILO). For example, the ILO data gives us the 2020 figure for most European countries. Then we estimated a preliminary 2021 figure based on job growth in the “information and communications” industry sector as reported by Eurostat. The preliminary 2021 figure, in turn, will be revised when better data on ICT professionals is available. (The latest figures for the United Kingdom are drawn from the Annual Population Survey, “Information Technology and Telecommunications Professionals” as reported by Nomis).
Note that the shift from lagged to current data aligns the European estimates with the methodology we use to generate the U.S. App Economy estimates. Assuming the number of ICT professionals is growing, this shift will tend to raise the App Economy estimates. As a result, our revised estimates for 2019 are now typically higher than our previously published estimates.
On the other hand, the growth rate of information and communications sector employment is generally less than the growth rate of ICT professionals, so our updated methodology tends to produce a conservative estimate for App Economy job growth in the latest year. These growth estimates will then get revised up when new data is available. As a result, our revised estimates for 2020 are generally higher than our initial preliminary estimates done last year.
One final point: The new pandemic wave hitting Europe in December 2021 produced noisy job listing data for all but the largest countries. To get more reliable preliminary results, we also drew upon the “App Economy” share of job listings by country that we calculated in 2020. These results will be updated as additional data is available.
The unprecedented challenge of the pandemic stressed crucial business and infrastructure systems in every country. Almost overnight, huge swathes of economic activity that relied on face-to-face interactions were forced into virtual mode. Individuals and businesses were suddenly dependent on the internet, their smartphones, and their mobile applications for critical daily activities like work, shopping, and communication with loved ones. The App Economy, already important, became an increasingly indispensable part of the real economy.
For the most part, the infrastructure of the global “App Economy” performed well under the strain. Existing mobile applications were able to respond to soaring demand without significant outages. App developers were able to quickly create new apps to meet the human and economic needs of the pandemic, and get them onto the Apple App Store, Google Play, and other app stores. Publishers launched 2 million new apps in 2021 alone. At both small and large companies, finding workers with App Economy skills — the ability to develop, maintain, and support mobile applications — became essential. Remote work and sales were critical to keeping businesses going. Even as the pandemic ebbs, many jobs and economic interactions are still remote, placing an increased premium on mobile communications. Health organizations have learned about the usefulness of telehealth apps. Banks and other financial companies are consolidating branches and doing more business remotely. Airlines and other transportation businesses rely on apps to communicate directly with their customers. And many restaurants, while thankful to be open for in-person patrons, still do much of their business by delivery.
In the United States, as in other countries, the increased prominence of the App Economy was reflected in the growing number of jobs that required App Economy skills. We have been estimating the number of U.S. App Economy jobs since 2012, using detailed data on job postings as our major tool for analysis. Our latest estimate, as of January 2022, was 2.564 million App Economy jobs, including a conservative estimate of spillover jobs. That is up 14% from 2.246 million as of April 2019, and up 8% from an estimated 2.417 million as of February 2020. In this updated report, we also estimate App Economy jobs by operating system, and provide estimates of App Economy jobs for leading states. These state estimates are based on a new methodology that takes account of remote work.
METHODOLOGY
For this study, a worker is in the App Economy if he or she is in:
• An IT-related job that uses App Economy skills — the ability to develop, maintain, or support mobile applications. We will call this a “core” app economy job. Core app economy jobs include app developers; software engineers whose work requires knowledge of mobile applications; security engineers who help keep mobile apps safe from being hacked; and help desk workers who support use of mobile apps.
• A non-IT job (such as sales, marketing, finance, human resources, or administrative staff) that supports core app economy jobs in the same enterprise. We will call this an “indirect” app economy job.
• A job in the local economy that is supported either by the goods and services purchased by the enterprise, or by the income flowing to core and indirect app economy workers. These “spillover” jobs include local professional services such as bank tellers, law offices, and building managers; telecom, electric, and cable installers and maintainers; education, recreation, lodging, and restaurant jobs; and all the other necessary services.
We use public job postings from the Indeed realtime database of job postings to estimate the number of core App Economy jobs. We analyze job postings for App Economy jobs based on the national methodology described in our 2017 report, “U.S. App Economy Update.” Then we use a conservative multiplier of indirect and spillover jobs to estimate overall App Economy jobs.
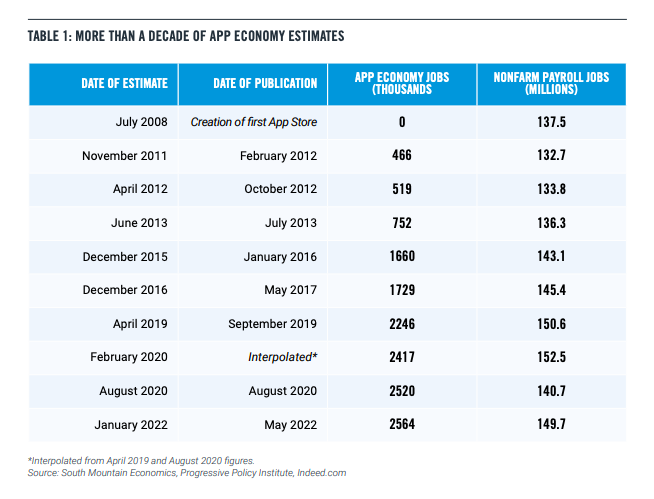
Table 1 shows the full history of our estimates of the App Economy. (The February 2020 prepandemic figure represents an interpolated data point based on the April 2019 and August 2020 figures).
Measured against the size of the whole economy, the roughly 2.6 million workers in the App Economy represent about 1.7% of total nonfarm employment of nearly 150 million. That’s significant, but not overwhelming.
But we get a different perspective by looking at the App Economy’s contribution to job growth since Apple opened the first App Store in July 2008. From July 2008 to early 2022, the economy overall added roughly 13 million jobs, while the App Economy has gone from zero to 2.564 million jobs, including indirect and spillover jobs.
That implies that the App Economy has contributed about 20% of nonfarm job growth since its inception. Perhaps more important, the App Economy has been an “autonomous” source of hiring even while other parts of the economy have faltered.
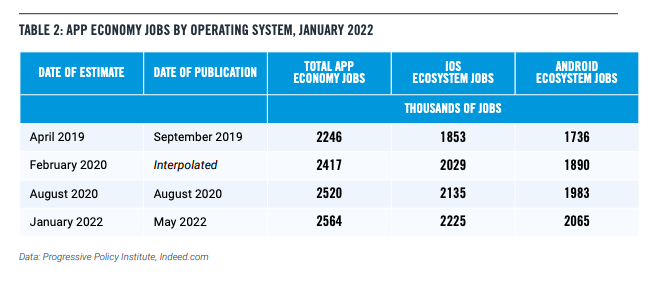
APP ECONOMY BY OPERATING SYSTEM
We can analyze App Economy job postings to see whether they refer to iOS- and/or Android-related skills. That allows us to assign App Economy jobs to either the iOS or Android “ecosystems” or both. For example, if a job posting is looking for an iOS developer without any mention of Android, then that job and the associated indirect and spillover jobs are part of the iOS ecosystem but not the Android ecosystem.
It needs to be noted that many App Economy job postings, especially in the United States, refer to both iOS and Android skills. A job posting might explicitly be directed at finding an Android software engineer, for example, but part of required or preferred experience might include previous development of either iOS or Android apps. As a result, most App Economy jobs in the U.S. belong to both the iOS and Android ecosystems. That isn’t necessarily true in other countries.
Table 2 below reports on iOS and Android ecosystem jobs as of January 2022. The iOS ecosystem included 2.225 million jobs, including indirect and spillover jobs. The Android ecosystem includes 2.065 million jobs.
This implies that the growth of the iOS ecosystem accounts for about 17% of nonfarm payroll job growth from July 2008 to January 2022. Similarly, the growth of the Android ecosystem accounts for about 16% of nonfarm payroll job growth from July 2008 to January 2022. Note that these figures are not additive.
LOCATION OF JOBS
Previous to the pandemic, our App Economy reports and updates generally included estimates of App Economy jobs by state. This was possible because, pre-pandemic, most job postings specified a location for the job. We were therefore able to distribute App Economy jobs by state and even by metro area.
The likely permanent rise of remote work means that the previous methodology no longer is sufficient. Many App Economy job postings now say “remote from” some city, meaning that the worker can be located anywhere, even if they have an “official” location. Let’s call these “tethered remote” jobs. Some job postings don’t even specify a home base, opting for “United States” or just “remote.” Let’s call these “untethered remote.” In addition, many jobs are now advertised as being based in any one of a number of different locations.
In this section we will describe a new preliminary methodology for estimating the job market impact of the App Economy by state. First, it is important to realize that this new methodology gives state estimates that are noncomparable to previous years. Second, this is a preliminary methodology and will likely change in future updates as we better understand the nature of remote work.
Recall that we divide App Economy jobs into core, indirect, and spillover jobs. Remote work means that the core jobs (such as app developers, mobile app security specialists, mobile app tech support staff) need not be in the same location as the indirect jobs (such as accounting, legal, marketing, and management). Spillover jobs (local service jobs, such as restaurants and retail, conservatively estimated) should be distributed according to the location of the core or indirect jobs.
The first step in our preliminary methodology involves searching for all job postings that contain either the term iOS or Android nationally and by state. We also identify the number of job postings that are “tethered remote.”
• Core App Economy jobs that have a location and are not remote are allocated to that location, along with the resulting indirect and spillover jobs.
• Core App Economy jobs that have a location and are “tethered remote” are allocated according to a two-step process. First, the associated indirect jobs and spillover jobs are allocated to the reported location. Second, the tethered remote core jobs are allocated by state according to the distribution of employment and jobs growth in NAICS 5415 (“computer systems design”), which is the industry where most app developers are found.
• Core App Economy jobs which have no location (“untethered remote”) are allocated by state according to the distribution of employment and jobs growth in NAICS 5415. In addition, the associated indirect and spillover jobs are allocated the same way.
Under the new methodology, California is still first on the list with 408, but the gap between California and other states has narrowed. California is followed by Texas, Washington, New York, Florida, Pennsylvania, Illinois, Virginia, and Georgia.
A bipartisan group of legislators is looking to improve competition within app stores and lower barriers to entry for developers in the market for mobile apps, though the reality of the bill’s impact is decidedly less clear. The Open App Markets Act would require that companies — namely Google and Apple — allow applications to be downloaded onto their operating systems from sources other than their respective app stores in a process known as sideloading. The bill also prohibits companies from requiring that apps facilitate in-app transactions through an operating system’s own payment mechanisms — an issue that took center stage in the 2020 lawsuit in which Epic Games sought to bypass the 30% revenue cut taken by Apple’s app store by implementing an external payment process. While the intention may be to promote competition, this bill misrepresents current industry standards by targeting practices of two major companies which are commonplace among competitors. The consequences of this action will fall on consumers, who will lose the ability to choose preferred methods of obtaining mobile apps by forcing identical business models between competing companies.
Approximately 85% of apps listed on the Apple App Store do not charge consumers or enable in-app purchases of any kind, meaning the commission fees for which this bill seeks to provide alternatives are irrelevant to the vast majority of developers utilizing the marketplace. Because of this, the 1.8 million apps available on Apple’s platform can reach billions of iOS users worldwide at a low cost. However, for those which do enable transactions — many of which operate within the realm of mobile games similar to those offered by Epic — the fees imposed by the Apple and Google app stores both currently operate at or below levels consistent with the standard set by the market. Apple and Google both collect 30% commission on digital goods and services and both implement a model where fees on subscriptions fall to 15% after a year. Both companies also lower fees to 15% for developers making under $1 million in revenue in order to lower barriers to entry for small developers. This is on par with the 30% fee charged by the Samsung Galaxy Store, Amazon App Store, and gaming platforms such as the Microsoft Store on Xbox consoles and the PC gaming store Steam.
In addition to disrupting current industry standards, efforts targeting Apple and Google’s app stores disregard the impact the bill will have on consumer choice in the market for mobile devices. Sideloading apps from sources other than Apple and Google’s approved listings is a useful feature for those who want to customize their devices and maintain a higher level of control over software installed, but there are significant security risks associated with doing so which are left unacknowledged by the Senate legislation. Google’s Android operating system currently allows users to enable the ability to sideload apps from unknown sources, but users doing so assume the risks associated with downloading untested software, potentially exposing their devices to malware. App store review processes are in place to ensure that apps work as intended and do not pose harm to users prior to becoming available to consumers. When sideloading, users have a limited amount of information about the applications source and content, and if the app has not been through the approval processes needed to list an app on a major app store, it is all too easy to misrepresent the content of the app, exposing consumers to potentially dangerous applications. This risk is heightened on any app which requires transactions, as payment information can be easily compromised by unknown third parties when operating outside an operating system’s payment platform. In 2020, Apple’s app review process rejected more than 48,000 apps containing hidden content or undocumented features, as well as 215,000 for privacy concerns, which Apple says saved consumers more than $1.5 billion in fraudulent transactions.
Despite the risks, the autonomy that comes with the Android model is a draw for many consumers as they choose between competing mobile operating systems. For the more tech-savvy consumer, security risks can be mitigated by the ability to make informed choices, and the results can be an enhanced level of functionality on mobile devices which are therefore customized to meet the needs of the individual user. But the average consumer may not want to weigh the benefits and risks of every download they make. App stores which are designed for the specific operating system ensure a level of security, and the payment systems used make it so that financial information is not compromised by exposure to unknown third parties. By requiring that Apple follow the lead of Google and enable sideloading on their devices, consumers lose the option to take advantage of this ensured security and will be open to malware — a practice which Apple has reported results in Android devices having an estimated 15 to 47 times more infections from malicious software compared to their iOS counterparts.
A common critique of this bill is that by targeting only two major companies, the Senate is artificially deciding winners and losers in a market where competition is already present. By manipulating the market to require identical business models by leading app stores, this critique appears especially salient. The assurance of safeguards for privacy and security is a feature of Apple products, and if a consumer feels confident in their ability to monitor their own security risks when downloading unapproved applications from third-party sources, switching costs to another operating system are relatively low from an antitrust perspective. It is thus not the role of Congress to regulate what is considered an ideal business model in areas where innovation and competition are present, particularly when that regulation exposes the everyday consumer to significant security risks.