Digital platforms, also known as “online intermediation services,” are increasingly important for European businesses, bringing wide-ranging benefits to both individual consumers and to the participating companies. More and more new platforms are arising – in areas such as manufacturing and healthcare. Not surprisingly, as digital platforms have become more numerous and significant, they have come under the scrutiny of regulators. In particular, the European Commission has been examining the perception that European business users are being treated unfairly by digital platforms. The result was a recently proposed new regulation “promoting fairness and transparency for business users of online intermediation services.”
In this paper, we first analyze the economic and commercial constraints facing digital platforms. In particular, we focus on two economic imperatives: First, platforms have a strong incentive to maintain user trust. Second, platforms have a strong incentive to keep transaction-related costs under control.
When the Social Security and Medicare trustees warned last week that both programs are ontenuous financial footing, Treasury Secretary Steve Mnuchinsaid: “The administration’s economic agenda — tax cuts, regulatory reform and improved trade agreements — will generate the long-term growth needed to help secure these programs and lead them to a more stable path.” He couldn’t be more wrong.
Asmore and morebaby boomers retire, Social Security and Medicare will require additional revenue just to fund the same level of benefits enjoyed by previous generations. Yet instead of raising more revenue to help fund these programs, the Trump administration and Congressional Republicans recklessly pursued a package of tax cuts that the non-partisan Congressional Budget Office projects willreduce revenueby $2 trillion over the next decade. This law put Social Security and Medicare on a decidedly less stable path.
In this post we update our October 2017 report, “The App Economy in Europe: Leading Countries and Cities, 2017.” That report found 1.89 million App Economy jobs in Europe as of January 2017. Our new results find 2.05 million App Economy jobs in Europe as of April 2018, an increase of 8.3% (or an annual rate of 6.6%). As discussed in the earlier report, our methodology is based on an systematic analysis of online job postings for jobs using App Economy skills, benchmarked to the number of information and communications technology professionals in each country, as reported by the International Labour Organization.
The table below lists the number of App Economy jobs by country, and by mobile operating system. Many App Economy jobs require both iOS and Android skills, as indicated in the online job posting, so they are listed are in both the iOS and Android ecosystems.
App Economy Jobs by Country (April 2018)
Total app economy jobs
iOS ecosystem jobs
Android ecosystem jobs
Austria
37
28
30
Belgium
30
23
24
Czech
31
20
22
Denmark
54
45
44
Finland
48
32
44
France
314
220
262
Germany
327
262
255
Greece
8
5
6
Hungary
20
14
17
Ireland
20
17
12
Italy
84
62
71
Luxembourg
3
2
3
Netherlands
201
167
155
Norway
52
46
43
Poland
75
44
59
Portugal
36
25
28
Romania
27
20
23
Spain
98
76
84
Sweden
94
70
81
Switzerland
33
28
29
United Kingdom
353
291
292
30-country total*
2049
1576
1666
*Includes estimates for Bulgaria, Croatia, Cyprus, Estonia, Latvia, Lithuania, Malta, Slovakia, and Slovenia.
Earlier this month, President Trump ordered Energy Secretary Rick Perry to intervene in electricity markets to prop up failing coal power plants, falsely claiming the effort was needed to protect electricity grid reliability for national security reasons.
In truth, the action amounts only to a war on the working- and middle-class energy consumers Trump claims to care about, all to indulge his political fixation with “saving coal.”
Yet, this unprecedented intervention in electricity markets is only the latest Trump decision that would raise consumer energy costs and put taxpayers at risk.
I write this article as a freelancer. I take Lyft to get around. I’ve booked an apartment this summer through Airbnb. I’ve been an adjunct professor. I’ve just gotten estimates for roof and other home repairs from men who work for themselves.
All of these activities are part of a large universe of what’s come to be called the “gig economy” in America, the contentious subject of a U.S. Bureau of Labor Statistics report released Thursday.
The study found that about 15.5 million Americans work in contingent, or short-term, jobs and/or in “alternative work arrangements,” including as independent contractors, on-call workers, temporary agency workers, and workers sent out on jobs by contract firms. A majority of these workers is men, and African Americans and Hispanics are disproportionately represented in the lowest-paid sectors of the gig economy. Sara Horowitz, founder of the Freelancers Union, says that 55 million Americans are independent workers, and the Government Accountability Office puts the number even higher. “Establishing a statistical definition of the gig economy is no easy task,” as a 2016 Congressional Research Service report said.
Whatever the number, the gig economy is a sign of the growing precariousness of work in America. With artificial intelligence and other technologies threatening to further reduce the need for full-time workers, it’s imperative that labor law and social policies change.
Lynnel Beauchesne’s dental office hugs a rural crossroads near Tunnelton, W.Va., population 336. Acres of empty farmland surround the weathered one-story white building; a couple of houses and a few barns are the only neighbors. But the parking lot is full. Some people have driven hours to see Beauchesne, the sole dentist within 30 miles. She estimates that she has as many as 8,000 patients. Before the office closes at 7 p.m., she and her two hygienists will see up to 50 of them, not counting emergencies.
About 43 percent of rural Americans lack access to dental care, according to the National Rural Health Association, and West Virginia, among the poorest and most rural states, is at the center of the crisis. All but six of the state’s 55 counties include federally designated “Health Professional Shortage Areas,” “Medically Underserved Areas” or both. The state’s Oral Health Program found in 2014 and 2015 that nearly half of counties had fewer than six practicing dentists, just half of adult West Virginians had visited a dentist in the previous year, and more than one-fifth hadn’t seen a dentist in five years. By comparison, a U.S. Centers for Disease Control and Prevention study in 2015 found that 64 percent of all American adults ages 18 to 64 reported seeing a dentist in the previous year. The rate of total tooth loss is 33.8 percent among West Virginians over 65, compared with roughly 19 percent for all seniors nationally.
One seemingly obvious solution is to persuade more dentists and other oral-health providers to come to places like West Virginia, a goal of various public efforts. The federal National Health Service Corps program, for example, offers up to $50,000 in loan assistance to doctors and dentists willing to work two years in a designated shortage area. And several states have passed or considered legislation authorizing “dental therapists” — midlevel providers akin to nurse practitioners — to provide certain kinds of primary dental care in areas where dentists are scarce.
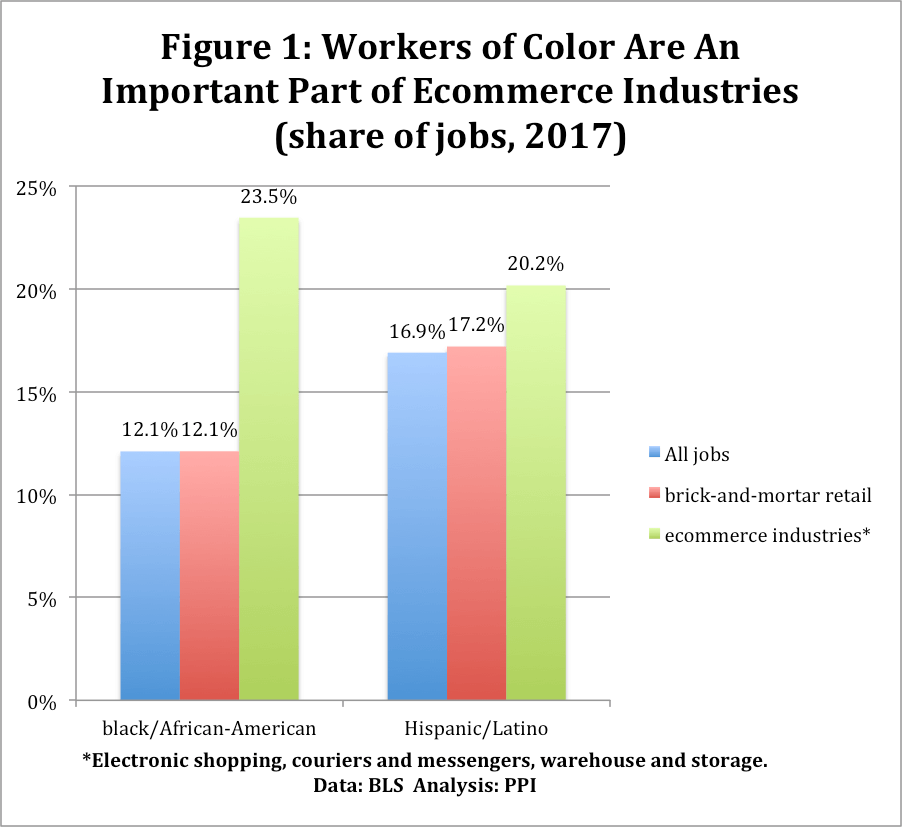
On May 8, PPI participated in a congressional roundtable on the impact of retail automation on workers of color. The roundtable was led by Representative Bobby Scott of Virginia, and moderated by Spencer Overton of theJoint Centerfor Political and Economic Studies. I presented PPI’s latest research on the impact of the ecommerce boom on black and Hispanic workers.
We found that roughly 24% of ecommerce workers identify as black or African-American, compared to 12% of workers in brick-and-mortar retail. This is based on BLS surveys. We also found that roughly 20% of ecommerce workers identify as Hispanic or Latino, compared to 17% of workers in brick-and-mortar retail (Table 1).
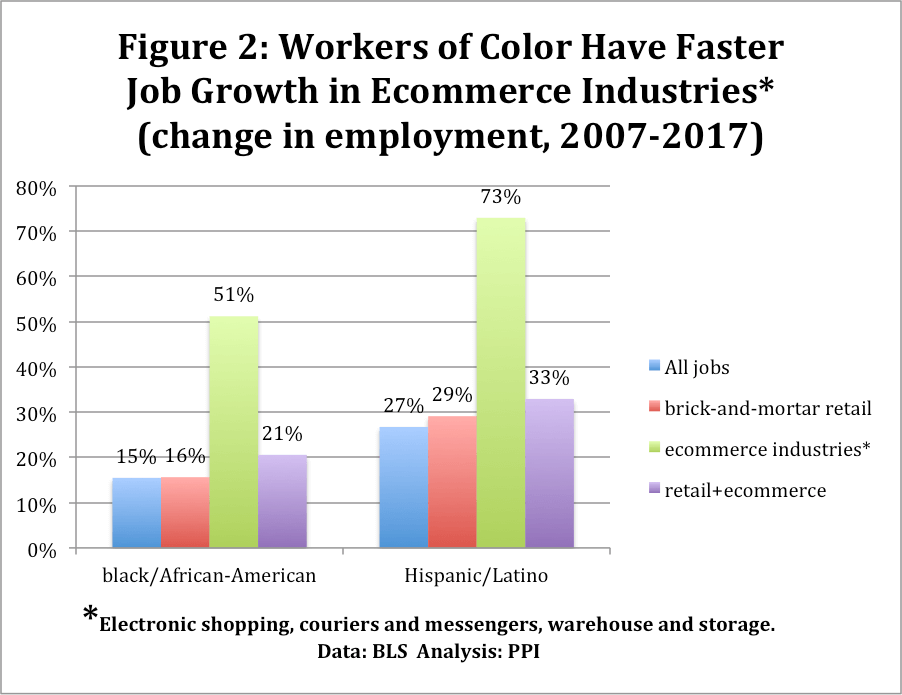
We also found that ecommerce industries are hiring workers of color at a rapid rate. From 2007 to 2017, the number of black /African-American workers in ecommerce rose by 51%, compared to a 15% gain for all jobs. The number of Hispanic/Latino workers in ecommerce rose by 73%, compared to 27% for all jobs. (Table 2)
Taken together, these results suggest that the ecommerce boom could benefit workers of color, assuming we have the right policies to allow access to the new jobs. We need to train workers for the new jobs in ecommerce, brick-and-mortar retail, and the next wave of growth in local custom manufacturing. These jobs will require a combination of technical, design, and people skills.
Moreover, we need to provide financing to enable a diverse population of entrepreneurs to take advantage of the new opportunities created by the ecommerce revolution. States must set up programs which allow potential entrepreneurs to experiment with the latest 3D printing and robotics technologies.
In recent years, innovation has become synonymous with digital companies such as Apple, Google and Amazon.The Internet, the smartphone, and the cloud have transformed daily life and the way we do business, and artificial intelligence and machine learning will continue the process.
Nevertheless, overall productivity growth remains sluggish. The reason is simple: The digital sector of the economy, where innovation today is focused, is still far smaller than the physical sector. Even today, we spend much more time interacting with the physical world than with the digital world. The chairs we sit on, the food we eat, the cars we ride in, are all made of physical materials, not intangible bits and bytes. According to recent research, digital industries such as communications, entertainment, and finance comprise only 30 percent of the economy, while physical industries such as manufacturing and construction comprise 70 percent.
A “College Finance Innovation Fund” could accelerate ideas to lower debt and make schools more accountable for their graduates’ success
For many students, the burden of student debt lingers years after leaving college, dragging down their finances and household security. New federal data find that, 12 years after enrollment, students with debt still owed, on average, two-thirds of what they had borrowed – and as many as 27 percent had defaulted.
Colleges, however, face no equivalent long-term financial stake in their students’ education: their obligations are done once the tuition is paid and the last exam is graded. Except perhaps for the pressure to put on a good show for U.S. News & World Report’s college rankings, schools have little incentive to ensure their students can land good jobs with decent pay – let alone graduate. Students bear the full risk of their investment and cope with the fallout if things don’t pan out as planned.
This lopsided burden of risk is one reason a dramatic expansion in financial aid – i.e., “free college” – can’t solve the crisis in college affordability. Schools would see no need to rein in their costs or to share the risks of investing in education with their students. In fact, the opposite. If the government is willing to pick up more of the tab for students, there’s no reason that tab wouldn’t simply grow – with potentially no reduction in student debt.
Students, policymakers, and members of the American public have increasingly acknowledged the crippling impact of student loans for many college graduates. In response, a growing number of schools are offering an alternative financing option to students: so-called “income share agreements.” Instead of taking out a loan and paying it back over time with interest, students with income share agreements (ISAs) commit to pay a fixed percentage of their income for a specified number of years after graduation in exchange for tuition. Under these agreements, graduates may end up paying more than or less than the total amount of funding they received in the first place — their obligation depends on their income.
Although ISAs are still relatively uncommon in the higher education landscape, they are gaining traction with an increasing number of colleges. The most notable participant so far is Indiana’s Purdue University, whose “Back a Boiler” program uses philanthropic donations and funds from the school’s endowment[1] to offer ISAs to hundreds of students. So far, the school’s ISAs have totaled more than $6 million in financing.[2]Other schools endorsing income share agreement programs include Point Loma Nazarene University in California, Lackawanna College in Pennsylvania, and Clarkson University in New York.[3]In addition to colleges and universities, career-focused institutions such as coding schools are also adopting the model.[4]
ISAs are funded either directly by the school or administered by third-party companies such as the Virginia-based start-up Vemo. Proponents say that ISAs give colleges “skin in the game” as far as how their graduates fare after school, because they have an incentive to ensure that students obtain well-paying jobs. The same is true for ISA companies such as Vemo.[5]
But as interest in ISAs grows, there is so far very little legal guidance as to how these agreements should be structured. With more private investors entering this space, public policy should protect participants from unfair terms and facilitate clear, legally legitimate agreements between funders and students. Setting reasonable regulations around income share agreements would also help to develop a robust market for this product and ensure that “bad actors” don’t cripple the market for ISAs before it takes root.
A promising proposal to set a regulatory framework for ISAs is the bipartisan “Investing in Student Success Act of 2017” (S.268), sponsored by Sens. Marco Rubio (R-FL) and Todd Young (R-IN) in the Senate and its companion bill, the “ISA Act of 2017” (H.R.3145), sponsored by Reps. Luke Messer (R-IN), Jared Polis (D-CO), Trey Hollingsworth (R-IN), Jackie Walorski (R-IN), Erik Paulsen (R-MN), Jim Banks (R-IN), Krysten Sinema (D-AZ), and Randy Hultgren (R-IL) in the House. Both bills establish standardized terms for an ISA, including the percentage of income and duration of payment required of the graduate, terms for potential prepayment, and an explicit definition of income. Requirements such as these will ensure the creation of a uniform financial product with legal certainty for both students and institutions.
The Senate and House proposals also establish some protections for graduates regarding their ISA payments. The bills establish a “maximum commitment factor” of 2.25, which is calculated by multiplying the percentage of income required in the ISA contract by the number of years left in the agreement. By capping commitment in this manner, the legislation would prevent lenders from requiring both a very high percentage of income and long duration of payments from graduates. The bills also dictate that graduates will not be required to make any payments during periods of time when their incomes fall below a certain level ($15,000 adjusted for inflation annually in the Senate bill; 150 percent of the poverty line for a single person in the House bill). This is a key component in why ISAs are an appealing financing option for many people: during sustained periods of financial hardship, graduates are protected. The bills also establish an overall maximum commitment level for students who might have multiple ISAs (e.g. for undergrad and graduate school).
While a good start, the bills could also include explicit protections from discrimination in the administration of ISAs. While proponents argue that ISAs would allow more minority and low-income students to be able to afford higher education, skeptics argue that ISA investors could still find ways to discriminate against certain students. Specifically, “one of the major arguments against ISAs is that private investors could refuse to fund certain high-risk pools of students, such as minorities, first-generation students or those pursuing lower-paying careers.”[6]Again, regulation is key here. Through clear terms in legislation, Congress could set expectations about which students can get ISAs on what terms. By emphasizing forward-looking prospects after graduation, ISA requirements can more effectively support students coming from many different backgrounds.
ISAs are not a silver bullet for solving the problem of college affordability. For this reason, PPI has also proposed a “College Finance Innovation Fund” which can help test, evaluate, and bring to scale innovations such as ISAs — as well as other new ideas that emerge. Among other things, such a fund could help support research to examine who gets ISAs on what terms, how these programs impact the ability of low-income students to build a credit history,[7]and what implications ISAs have for the diversity of the federal loan portfolio.[8]
In the meantime, students are eager for alternatives to traditional student loans, and ISAs offer a promising way to help many young people supplement or replace their existing funding for school. Smart regulation can help ensure that ISAs live up to their potential.
America’s official unemployment rate now stands at3.9 percent, which has been cause for much crowing by President Donald Trump. New data, however, belie Trump’s triumphalism on the economy and find that many ordinary Americans are far from confident about their personal economic circumstances.
A new survey by Prudential and Morning Consult finds that just 46 percent of Americans are “hopeful” about their financial security, while 48 percent are “worried” or “very worried.” One in four say they’re saving less for retirement because of their current finances, 27 percent say they’ve taken a second job, and 34 percent say they’ve looked for a new job in an effort to increase their pay.
Fears about retirement security in fact loomed large in this survey, with 72 percent of workers saying they were concerned about their retirement and 80 percent ranking it as the top issue they’d like to see Congress tackle. According to the poll, the principal reasons workers gave for having trouble saving were “daily expenses” (29 percent), housing costs (18 percent), elder care (17 percent) and health care (13 percent).
Why so much anxiety despite nothing but positive toplines on the economy?
One reason is wage stagnation. While corporate profits might be reaching record highs, wage growth has been sluggish. According to the Bureau of Labor Statistics, real average weekly earnings in April were just0.4 percent higher than they were a year ago. Meanwhile, household expenses have been rising at a much faster pace. Average annual premiums for employer-sponsored health insurance, for instance, have risen19 percentsince 2012 and 55 percent since 55 percent since 2007, according to the Kaiser Family Foundation.
A second reason for Americans’ persistent economic anxieties is escalating levels of debt. This week, the Federal Reserve Bank of New York releasednew datashowing an increase in household debt for the 15thconsecutive quarter. As of March 31, U.S. households owed $13.2 trillion, up $63 billion from the fourth quarter of 2017. Student loans were the largest source of debt behind mortgages, outstripping auto loans and credit cards to total $1.41 trillion in the first quarter of 2018.
A third source of household anxiety is growing job insecurity, as mounting numbers of workers enter the “contingent” or “gig” economy. While the precise size of this new economy is under dispute, the Prudential-Morning Consultsurvey found that 27 percent of workers – including 35 percent of millennials – characterized themselves as gig workers and that 30 percent of respondents said someone in their immediate family worked a gig job. Despite their claimed benefits of flexibility and independence, gig work is also seen as insecure – 64 percent of Americans said gig jobs “fail to provide necessary worker benefits.”
Americans’ worries about their finances should also add to the worries of the GOP, which is already highly vulnerable this fall. The President’s much-touted tax cuts have done little to help average families, who might be starting to see the extent to which they’ve been hoodwinked by Trump and GOP promises. Surveys show, for instance, that voters are beginning to pin higher health care costs on Republican recalcitrance over Obamacare – one late 2017survey found that 50 percent of Americans would blame Trump and Republicans if costs increase and people lose coverage, versus 37 percent who would blame Democrats and former President Barack Obama.
Progressives, on the other hand, now have a chance to point out the failures of Trump’s economic plan and offer their own prescriptions for change. At the top of that list should be strategies to help Americans earn their way to greater financial security through better jobs, higher wages and greater opportunities for advancement. One promising blueprint is theeconomic opportunity agendareleased this week by the House New Democrat Coalition, which offers a smorgasbord of creative ideas for improving workers’ skills and ensuring they are well-equipped to thrive in a changing economy. Among other things, the Coalition calls for an overhaul of higher education so that students not only emerge from school with immediately marketable skills but have a chance to upgrade themselves throughout their working lives.
By embracing a forward-thinking agenda that gives Americans a clear path forward and upward, progressives can shift the political winds in their favor and help to defeat the underlying forces that propelled the rise of Trumpism and its destructive policies.
Apple’s introduction of the iPhone in 2007 initiated a profound and transformative new economic innovation. While central bankers and national leaders struggled with a deep financial crisis and stagnation, the fervent demand for iPhones – and the wave of smartphones that followed – was a rare force for growth.
Today, there are five billion mobile broadband subscriptions globally, an unprecedented rate of adoption for a new technology.Use of mobile data is rising at 65 percent per year, a stunning number that shows its revolutionary impact.
The smartphone era helped power Korea’s economic growth over the past decade. Samsung announced its first Android phone in April 2009, eventually becoming the largest smartphone maker globally measured by volume. But the smartphone was about more than hardware. Apple’s opening of the App Store in 2008, followed by Android Market (now Google Play) and other app stores, created a way for iOS and Android developers to write mobile applications that could run on smartphones anywhere.
Despite all the attention it has received in recent years, the cost of college continues to rise at both private and public institutions across the United States.
According to data from the College Board, average tuition and fees for a public four-year college is $20,770 if in-state or $35,420 for out-of-state, and $46,950 for private, non-profit institutions. This represents increases of 13, 12, and 15 percent respectively since 2014, when the Progressive Policy Institute (PPI) first called for institutions of higher learning to make a three-year bachelor’s degree the norm and cut the cost of college by 25 percent.
American college students are facing a triple whammy – out-of-control college costs, record levels of student debt, and declining real earnings for college graduates. Yet politicians from both the left and the right have done nothing to fix the problem. Republicans actually proposed cutting student aid during the debate over tax reform. Meanwhile, some Democrats are pushing “free college,” which – while well intentioned – would do nothing to restrain the rising cost of college (in fact, just the opposite) or ensure Americans access to the best colleges and universities.
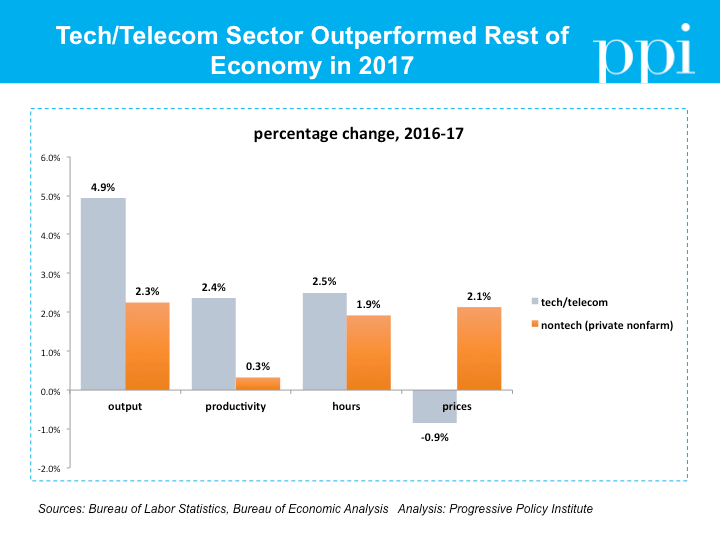
In 2017 the tech/telecom sector continued to outperform the rest of the economy, on all relevant measures: Output, productivity, hours, and prices.
I analyzed the BEA’s initial release of industry GDP datafor 2017, and combined it with BLS hours data. For the tech/telecom sector, I used computer and electronic products manufacturing; warehousing and storage (ecommerce fulfillment centers);publishing industries, including software; broadcasting and telecommunications; data processing, internet publishing, and other information services; and computer systems design and related services.
I found that in 2017, the tech/telecom sector showed 4.9% real output growth, more than double the 2.3% growth for the rest of the private nonfarm economy. Productivity growth in the tech/telecom sector was running at a strong 2.4% rate, compared to a meager 0.3% for the rest of the private nonfarm economy.
In 2017 worker hours in the tech/telecom sector grew by 2.5%, somewhat faster than the 1.9% gain in the rest of the economy. And finally, prices dropped in the tech/telecom sector, compared to an increase of 2.1% elsewhere.
Decomposing the price decline in the tech/telecom sector is particularly interesting. Historically hardware prices have declined sharply, but that’s not the main reason here. According to the BEA, the price change for value-added in the computer and electronics manufacturing industry was only -0.6% in 2017.
Instead, the main contributors to declining prices in the tech/telecom sector were broadcasting and telecommunications ( -2.2%); data processing, internet publishing, and other information services (-1.3%); and computer systems design and related services ( -0.3%). These figures are drawn right from BEA data.
Conclusion: Simple common sense says that if you own one car that’s broken down and another that makes weird noises but is still running well, you focus on fixing the broken-down vehicle first. The tech/telecom sector has some worrisome issues, but it’s still delivering value to both customers and workers. Meanwhile the rest of the economy has some bright spots, but overall most of those industries are stuck in the garage.
With productivity growth only running at 0.3% in the nontech private nonfarm economy, it’s little wonder that real wage growth has remained low across most of the economy. We need to digitize the physical industries to raise productivity and create more and better paying jobs.
As the party out of power, Democrats have the luxury of thinking big as they consider how to topple President Donald Trump in 2020. Bold, ambitious ideas are what the party sorely needs if it is to capture voters’ attention and woo them from Trump’s corrosive grip.
But if Democrats are to craft a winning agenda for 2020, bigness and boldness alone are insufficient; political feasibility and substantive plausibility are also necessary ingredients. That’s why the latest big and bold idea catching the eye of potential 2020 contenders – a federal jobs guarantee – is ultimately a disappointment.
Touted by advocates as a way to achieve “permanent full employment,” the notion of a federally guaranteed job for anyone who wants one has won support from three rumored presidential hopefuls so far, including New YorkSen. Kirsten Gillibrand, Vermont Sen. Bernie Sanders and New Jersey Sen. Cory Booker. Last week, Booker revealed draft legislationto pilot a federal jobs guarantee program in up to 15 localities nationwide, while Sanders has floated a much more ambitious national planfocused on public works projects at a scale not seen since the Great Depression. Under both proposals, participants would earn wages of up to $15 an hour, along with benefits such as paid family and sick leave and health insurance. “There is great dignity in work – and in America, if you want to provide for your family, you should be able to find a full-time job that pays a fair wage,” said Booker in a press release announcing his effort.
Booker’s endorsement speaks to the inherent surface appeal of a jobs guarantee. To borrow President Bill Clinton’s famous formulation, Americans who “work hard and play by the rules” deserve a shot at self-sufficiency, and the promise of work for all who want it invokes Americans’ innate sense of fair play. Proponents also rightly point out stark disparities in employment between certain groups, the result of discrimination and other structural barriers that guaranteed access to meaningful employment could arguably remedy.
Unfortunately, the idea also suffers from a variety of fatal defects, including its size, timing and relevance and any number of practical obstacles that make it administratively unworkable as well as politically untenable. For one thing, it rests on the dubious assumption that the American electorate – at a time when public cynicism and distrust toward government remain at all-time highs– is ready to embrace a dramatically expanded role for the federal government as the nation’s largest staffing agency and employer. More fundamentally, the idea betrays a deep lack of faith in the inherent resilience of the American economy and its people to weather disruption and change. Most Americans don’t share the left’s inordinate confidence in government’s ability to engineer shared prosperity from the top down. Aggressive advocacy of a panacea like government guaranteed jobs can only reinforce public impressions that progressives will always default to “big government” as the solution to complex economic problems.
While a federal jobs guarantee certainly passes the “bigness” test, its very bigness is a central conceptual weakness, at least in the current political environment. It is far too large a hammer in search of a nail.
According to the leading proposal for a national guaranteed jobs program, it would cost roughly $543 billiona year to create 10.7 million new federal jobs covering every worker unemployed or underemployed in January 2018 (a figure known as “U.6”). That would put the number of job guarantee participants at nearly five times the size of the entire current federal workforce.
It’s hard to fathom why proponents believe there is public appetite for a jobs program of this scale today, especially given that the nation’s official unemployment rate is at its lowest in nearly 20 years, employers in many places are complaining of worker shortages, the economy is set to grow at a solid pace and fears of inflation are currently preoccupying central bankers and financial markets. And even though workforce participation is lowerthan it could or should be compared to historical standards, the magnitude of unemployment and underemployment is nowhere near what it was the last time a massive federal works program was proposed and implemented, which was during the Great Depression. Then, unemployment rates were running at upwards of 15 to 25 percentwhile the private sector was wholly crippled.
Though some proponents might imagine an automation apocalypse that could ultimately throw millions of Americans out of work, talking about a national jobs guarantee program now is, at best, still wildly premature. Moreover, even if such a circumstance should occur, it’s far from settled that Americans would prefer a large-scale public jobs program over other strategies to manage economic disruption, including, heaven forfend, their own abilities to learn new skills and adapt to change.
A second and more serious conceptual flaw with a jobs guarantee is that it seeks to solve the wrong problem. While the lack of jobs is a continuing concern for some groups in some areas and absolutely should not be overlooked, the biggest malady ailing the middle and working classes isn’t so much the quantity of jobs as their quality – in the form of stagnant wages, declining benefits and the loss of stability and security. In this context, a national jobs guarantee program isn’t just too big a hammer, but the wrong tool altogether.
Though wages are finally ticking upward, the long-term trend toward stagnation is still far from being erased. The Brookings Institution, for example, reports that real wages for the middle quintile of workers grew by only3.4 percent between 1979 and 2016, while labor’s share of national income has also steadily fallen despite healthy corporate profits. More Americans are also losing access to traditional employer-provided benefits, such as health insurance. At the same time that the share of employers offering health insurance has dropped by 10 percentage points since 1999, according to the Kaiser Foundation, more Americans are finding themselves to be no longer employees at all but members of the ever-precarious “gig economy.”
Though wages are finally ticking upward, the long-term trend toward stagnation is still far from being erased
Especially vulnerable are the workers with the least amount of education, the one group that has remained consistently underemployed despite rising fortunes for others. In March, for instance, just 44 percent of Americans without a high school diploma were working, compared to 72.6 percent for college graduates. While a jobs guarantee program could potentially help some of these less-educated workers, a big question is why they should be shunted to relatively low-skilled public jobs rather than given the opportunity to increase their skills and compete for skilled openings currently going begging.
As for the question of wages, proponents of a job guarantee argue their plan would put upward pressure on wages by forcing private sector employers to compete for workers. This argument, however, rests on a very large and unproven assumption: that enough workers would in fact prefer a “public option” over private sector work to create that pressure. Many workers, for instance, might choose a lower-paid private sector job in the short term with the potential for advancement in the future, rather than a public job capped at $15 an hour into perpetuity. In any event, the potential impact on private sector wages would be indirect at best when other, more targeted ideas could have broader impact on workers’ incomes and financial security.
Even setting aside the conceptual and political weaknesses of a federal jobs guarantee, any number of practical obstacles could also prove insurmountable.
For instance, one such practical question is the kind of jobs government would provide. Booker’s proposal, for instance, imagines that participants would work in fields that are “currently under-provided, like child and elder care, infrastructure, and community revitalization.” What’s not clear, however, is how the government will gauge demand in a particular sector so it will know how many workers to deploy. Also unanswered are where and how to place them. These are not questions in which the federal government has a proven track record, particularly given the limited successof the more than 40 employment and job training programs the federal government already administers. If, for example, the government miscalculates and produces a surplus of elder care providers in a community with an insufficient number of potential patients, what would these workers do?
The new corps of government workers will not be fungible from one field to another, given the skills required for each of these professions, as well as licensing and other requirements. Workers cannot be working in a nursing home on one day and on a road crew the next, depending on demand.
A second set of practical concerns involves the role of the private sector and the effect these new federal workers would have on labor markets. While job guarantee advocates seek to create a new “floor” in the labor market and prompt the private sector to raise its own wages to compete for workers, it’s not clear that this is, in fact, what would happen. What could occur, however, is the displacement of private sector providers of child care, elder care and other services if the federal government ends up competing directly with existing employers. While some may not find this outcome objectionable if big companies were the ones to face the most pressure, the reality is that small businesses – such as home-based day care centers – are the least likely to survive in the face of government competition.
A third set of worries involves the preparation of workers for the jobs they would be asked to do. Current job guarantee proposals seem to assume that anyone who wants a job also has the skills and capacity to perform it, which is unrealistic. While the simple lack of available work might be all that stymies many workers, many other Americans who want to work face far more serious barriers, including the lack of skills, mental and physical disabilities that limit their capacity, caregiving obligations, mental health concerns or other issues that will need to be overcome if full-time employment is to be a reality.
Barriers like these are especially problematic if a federal work program is focused on infrastructure projects, as Sanders proposes. Though liberals romanticize the Civilian Conservation Corps and other Depression-era federal work efforts, infrastructure jobs often involve physically demanding outdoor labor in all sorts of weather, along with grueling hours. They are not for everyone.
One way to gauge the scope of the challenge around potential participants’ employability is to examine the ranks of workers “marginally attached” to the workforce, defined by the U.S. Bureau of Labor Statistics (BLS) as those who want to work and have looked for work in the last 12 months or those available to work but who have not searched for work in the last four weeks. These workers would presumably be prime targets for a federal jobs guarantee program.
Among the 1.59 million workers considered “marginally attached” in 2017, less than a third reported being “discouraged over job prospects,” while the vast majority cited other reasons for not being in the labor force, such as the lack of child care or transportation, “ill health or disability,” and family responsibilities.
If the purpose of a federal jobs program is to provide safety net employment for workers who cannot otherwise find private sector jobs, such an effort cannot succeed unless it also helps workers overcome the very barriers that made private sector work tougher for them to attain. This means the government not only needs to provide jobs, it needs to provide training so that workers can competently perform the work they’re given; affordable child care and transportation; remedial help if necessary with basic literacy and numeracy as well as so-called “soft skills”; mental health services and other accommodations. All of these are immensely complex, expensive and time-consuming services. But if the federal government is not willing to provide or at least subsidize these services, the “guarantee” of a job is meaningless unless there is some assurance of a worker’s potential success. And even then, there are a host of unanswered questions about the worker’s end of the bargain. Can a worker with a guaranteed job be fired? What if an employee is guilty of malfeasance or simply can’t perform? What rights and duties does a “guarantee” create?
Finally, there is the consideration of cost.
As mentioned above, the large-scale national job program envisioned by its leading proponents would cost $543 billion, or 3 percent of GDP, to employ 10.7 million people. This translates to a per-worker cost of $50,747 a year – or just slightly below the median household income in 2016 of $57,617. By comparison, federal spending on Social Security totaled $922 billion in 2016 while benefiting 61 million people, a relative bargain by comparison.
The $543 billion figure is also situated in the context of relatively low unemployment. At the height of the recession in 2010, the total share of workers unemployed and underemployed (“U.6”) was 17.1 percent, meaning that the cost of a federal jobs program could expect to double in a downturn, to more than $1 trillion a year.
Spending of this magnitude would crowd out spending on a host of other priorities that might be better suited to building human and social capital, such as improving early childhood and K-12 education, expanding health care or making college and occupational training more affordable. Worse yet, funding for a federal jobs program could come at the expense of other safety net programs supporting children, disabled Americans and others who cannot work. As Ernie Tedeschi, an economist who served under President Barack Obama recentlytold The Washington Post, “It would be extremely expensive, and I wonder if this is the best, most targeted use of the amount of money it would cost.”
At the same time that a federal jobs guarantee program is too big, it paradoxically also aims too low. Federally provided jobs are unlikely to be the kind of jobs that people want, nor would there necessarily be a path to upward mobility for those relegated to this work. While a federal jobs program might promise the dignity of work for all, what is delivered could still be work without dignity.
As envisioned by its advocates, the kinds of jobs the federal government could provide includesuch tasks as “the repair, maintenance, and expansion of the nation’s infrastructure, housing stock, and public buildings,” “assistance with ecological restoration,” “engagement in community development projects,” as well as jobs in child care, education and senior care.
Compared to the private sector, the federal government is relatively ill-suited to the task of creating jobs that demand workers’ creativity, innovation and commitment
While there is value in all of this work, the ranks of America’s unemployed and underemployed deserve better. Compared to the private sector, the federal government is relatively ill-suited to the task of creating jobs that demand workers’ creativity, innovation and commitment, that best fit the needs of the local and national economy at any given time and, importantly, are self-sustaining.
With many fewer dollars than a jobs guarantee program would cost, the federal government should invest in other, more effective ways to spur the creation of high-quality jobs, prepare workers for well-paying careers with opportunities for advancement and supplement the wages of the working poor.
Among the myriad of possibilities for increasing incomes is to expand the federal Earned Income Tax Credit for low-wage workers, in combination with raising the minimum wage, as Isabel Sawhill and Quentin Karpilow of the Brookings Institution recommend. Another possibility is to eliminate the payroll tax, which falls most heavily on low-wage workers as well as the self-employed, and replace it with a broad-based value-added tax (VAT) of the kind adopted in most European countries or a carbon tax, which would have the additional benefit of combating climate change.
Another option, which PPI has endorsed, is to help workers earn better wages by expanding the availability of Pell grants to students pursuing high-quality occupational credentials in IT, advanced manufacturing and other “new-collar” careers where demand is growing. This idea would allow older, lower-income and displaced workers who do not want or cannot afford to go to college with an alternative means of upgrading their skills. Government should also invest heavily in rural broadband to expand digital opportunity to all corners of the country and help rural areas decimated by the loss of manufacturing and mining jobs reinvent themselves and attract new industry. Government could also encourage new models of corporate governance and ownership, such as the “benefit corporation” model PPI has embraced, or the expansion of employee stock ownership plans (“ESOPS”), that would ensure that more of the fruits of economic growth flow to workers.
The advocates of guaranteed jobs have their finger on the right problem: far too many Americans are suffering from the maldistribution – or outright denial – of economic opportunity. But by making work a right – as a guaranteed job would do – the government would also paradoxically be diminishing its value. The fundamental nature of the American character is to strive, to achieve – and to earn. What the government should guarantee, then, is not a job but the means and opportunity for all Americans to attain their aspirations to the fullest.
Apple’s introduction of the iPhone in 2007 initiated a profound and transformative new economic innovation. While central bankers and national leaders struggled with a deep financial crisis and stagnation, the fervent demand for iPhones – and the wave of smartphones that followed – was a rare force for growth.
Today, there are five billion mobile broadband subscriptions, an unprecedented rate of adoption for a new technology.1 Use of mobile data is rising at 65 percent per year, a stunning number that shows its revolutionary impact.2
More than just hardware, the smartphone also inaugurated a new era for software developers around the world. Apple’s opening of the App Store in 2008, followed by Android Market (now Google Play) and other app stores, created a way for iOS and Android developers to write mobile applications that could run on smartphones anywhere.