PPI - Radically Pragmatic
  • Donate
Skip to content
  • Home
  • About
    • About Us
    • Locations
    • Gallery
    • Careers
  • People
  • Projects
  • Our Work
  • Events
  • Donate

Our Work

Working Latinos Need Relief from High Energy Costs: Data by State

  • February 3, 2026
  • Elan Sykes

In the scatter plots for each state, every panel reflects the relationship between the Latino population and energy burdens in one Congressional District in that state. Within each district’s panel, one dot represents each census tract in that district. The slope of each panel’s light blue line reflects the correlation between a higher Hispanic population and higher energy burdens for that district, with its confidence interval shown in gray (so a wider gray shading represents a looser fit for that panel’s blue line). Then, each Congressional District in the states included in PPI’s report “Working Latinos Need Relief from High Energy Costs” is mapped such that the fill color of each census tract scales according to the energy burden as a percent of area median income or the proportion of Hispanic households as a share of the tract’s population.

This appendix uses data from the Department of Energy’s Low-income Energy Affordability Data (LEAD) tool collected through the Census Bureau. Importantly, these estimations are not causal and only reflect the statistical level of similarity between the two characteristics across the range of census tracts in each district. Additionally, the underlying data report values for energy burden calculated from area median income and average annual energy costs, and so do not capture varying levels of energy burden within each tract or microdata like individual household burden. Even though this correlation does not allow for direct causal claims, the simplicity of this comparison provides significant insight when paired with the entire PPI report.

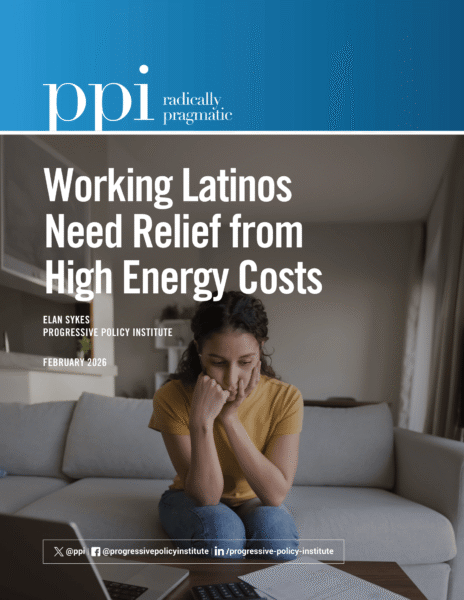
Each state listed below links to a PDF with this data, in both English and Spanish:
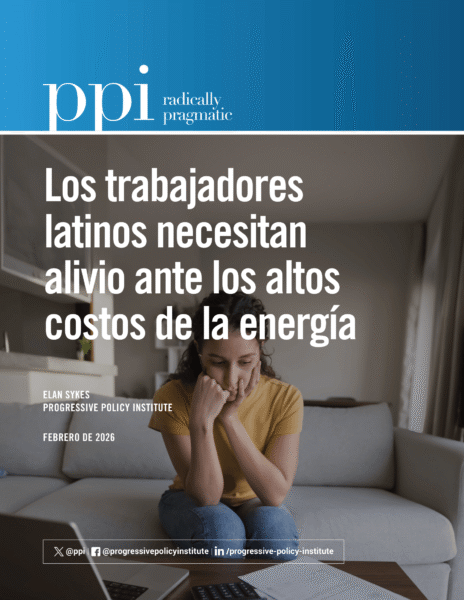
  • Arizona (English / Spanish)
  • California (English / Spanish)
  • Florida (English / Spanish)
  • Illinois (English / Spanish)
  • Massachusetts (English / Spanish)
  • New Jersey (English / Spanish)
  • New Mexico (English / Spanish)
  • New York (English / Spanish)
  • Oregon (English / Spanish)
  • Texas (English / Spanish)
  • Washington (English / Spanish)

Read the full report in English and Spanish.


Related Work

Blog  |  October 20, 2026

Brown on Radically Pragmatic: Will Democrats Repeat One of Their Party’s All-Time Greatest Mistakes?

  • Neel Brown
Press Release  |  October 5, 2026

The District of Columbia Has the Nation’s Lowest Carbon Emissions but Pays the Highest Price to Cut Them, PPI Finds

  • Neel Brown John Kemp
Publication  |  October 5, 2026

Washington DC: Lowest in Carbon Emissions, Highest in Increased Costs

  • Neel Brown John Kemp
Press Release  |  October 2, 2026

Senate Permitting Deal Tracks Closely With PPI Blueprint for Democratic Permitting Reform

  • Colin Mortimer
Press Release  |  August 27, 2026

Soaring Costs and Grid Strain Put Maryland’s Climate Goals in Doubt

  • Neel Brown John Kemp
Publication  |  August 27, 2026

Maryland’s Climate Goals Facing a New Reality

  • Neel Brown John Kemp
  • Never miss an update:

  • Subscribe to our newsletter
PPI Logo
  • Twitter
  • LinkedIn
  • Facebook
  • Donate
  • Careers
  • © 2026 Progressive Policy Institute. All Rights Reserved.
  • |
  • Privacy Policy
  • |
  • Privacy Settings