Lindsay Lewis, Executive Director of the Progressive Policy Institute (PPI) released the following statement of support for the nomination of Ketanji Brown Jackson to the Supreme Court of the United States:
“The Progressive Policy Institute applauds the Biden Administration for the historic nomination of Judge Ketanji Brown Jackson to the highest court in the land. Judge Jackson is an unequivocally qualified and highly respected judge, who has already been confirmed three times by the Senate with strong bipartisan support. We encourage Senate Republicans to put aside their typical tribalism, avoid politicizing this process, and confirm Judge Jackson in a timely manner.”
The Progressive Policy Institute (PPI) is a catalyst for policy innovation and political reform based in Washington, D.C. Its mission is to create radically pragmatic ideas for moving America beyond ideological and partisan deadlock. Learn more about PPI by visiting progressivepolicy.org.
By unleashing a Russian blitzkrieg on Ukraine, Vladimir Putin also has shattered Europe’s long peace, with enormous implications for U.S. security. The pacification of Europe – the world’s most dangerous cauldron of conflict in the last century – was the supreme achievement of American statecraft, and it may be coming undone.
The Russian strongman’s resort to brute force to crush Ukraine’s independence is a tragedy for its 40 million citizens. But by ordering the largest military mobilization in Europe since World War II, Putin also has sought to strong arm the transatlantic allies into rolling back NATO’s eastward expansion after the Cold War ended.
President Biden and European leaders have stood fast against this absurd demand. They know that appeasing Putin by giving him a free hand in Moscow’s “sphere of influence” would not bring peace. Instead, it would destabilize and re-divide Europe, subjecting nine NATO members that used to be Soviet vassals once again to Russian dictates.
World. $102.0 trillion
U.S. $24.8 trilion
EU $18.4 trillion
Russia. $1.7 trillion
WHAT THEY MEAN:
As international sanctions responses to Russia’s attack on Ukraine evolve this week, what are they working with? Some measures of Russia’s place in the world economy along seven lines of data, covering GDP, trade, energy, currency trading, FDI, financial reserves, and scientific research:
GDP: Russia’s economy is more volatile than that of most other big countries, as it inflates rapidly when energy and metal prices rise and deflates fast when prices fall. This noted, the International Monetary Fund’s most recent estimate places Russian GDP at $1.7 trillion in 2022. This places it midway between Mexico’s $1.4 trillion and Canada’s $2.2 trillion, and about 1.5% of the $102 trillion world economy. Others in the same neighborhood include Brazil at $1.8 trillion, Taiwan at $1.6 trillion, and Indonesia at $1.2 trillion. IMF estimates for other big economies include: U.S. $25 trillion, China $18.5 trillion, EU $18.4 trillion, Japan $5.4 trillion, Germany $4.6 trillion, the U.K. $3.4 trillion, India $3.3 trillion, France $3.1 trillion, and Korea $1.9 trillion.
Trade: Russian exports vary, again with energy and metal prices, in a range from $200 billion to $400 billion per year. At the high end, this is about 2% of the world’s annual $20 trillion in goods exports. Relative to output, exports accounted for 25.5% of GDP in 2020, just below the worldwide 26.5% average. The EU is the main partner, buying 40% of Russian exports and providing 31% of imports; China is next as the market for 13% of Russian exports and source of 22% of imports. The U.S. is a minor player in both accounts, at about 5% each; for the U.S., Russia’s main significance is as a supplier of some specialty metals such as titanium and palladium.
Energy: DoE’s Energy Information Administration reports that Russia is the third-largest producer of petroleum in the world (after the United States and Saudi Arabia), and holds the world’s largest proven reserves of natural gas. With respect to trade, figures compiled by BP suggest that Russia accounts for 11.4% of world oil exports (7.4 million bbl/day out of 65.1 million), and a quarter of gas exports (238 billion cubic meters out of 940 billion. This means that the Russian government is more dependent on exports for revenue, and Russian private-sector businesses less dependent, than is the case for large manufacturing or agricultural exporting economies. About half of Russian oil exports go to the EU and a third to China; with respect to gas, determined by pipeline construction, 89% of exports go to the EU, Turkey, and Belarus.
Currency: The Bank of International Settlements’ most recent triennial report (2019) reports $46 billion in daily Russian currency turnover, or about 0.5% of the daily $8.3 trillion in worldwide currency trading.
Foreign Direct Investment: Russia’s role in currency trading is minimal; the Bank of International Settlements’ most recent triennial report (2019) reports $46 billion in daily Russian currency turnover, or about 0.5% of the daily $8.3 trillion in worldwide currency trading. As reported last November by UNCTAD, about $416 billion of the world’s $41.4 trillion in foreign direct investment stock are in Russia. Measured the other way, Russian firms and state enterprises hold a similar $379 billion in other countries. These figures, however, are likely large overstatements; IMF staff research suggests that about 60% of FDI in Russia comes from “foreign phantom corporations” — that is, “empty shell corporations with no real activities.”
Financial Reserves: The IMF reports Russian financial reserves, which presumably are less vaporous than FDI figures, at $630 billion. This is a large but not extraordinary sum, just below India’s $634 billion and not vastly above those of some smaller countries; for example, Israel is at $209 billion and the Czech Republic $175 billion. China’s reserves are the world’s largest at $3.4 trillion, with Japan next at $1.4 trillion.
Science: The OECD reports Russian spending on research and development at $44 billion, which is about 2% of an identified world total (including OECD members, China, Russia, Taiwan, and a few others) of $2.2 trillion. OECD places Russia’s R&D at 1% of GDP, similar to the level for Turkey and about 40% of the 2.5% OECD. The U.S. is at 3.1%; Israel and Korea have the highest known figure at 4.9% and 4.6%.
In sum, Russia is a large country and mid-tier economy. It is significant in energy production and exports (especially as a supplier for western Europe); it can use energy income to finance a large military establishment and a modest research base; and it has a large financial reserve but also likely relies heavily on energy exports to maintain this reserve. Otherwise, its role in global growth, investment, or invention is modest.
The Treasury Department’s Office of Foreign Assets Control lists/reviews existing sanctions.
And a 2009 assessment of economic sanctions as a foreign policy tool, from Peterson Institute for International Economics scholars Hufbauer/Schott/Elliott/Clegg.
Background
The U.S. Energy Information Agency on Russia’s role in gas and oil.
PPI’s Paul Bledsoe’s report on natural gas, including the role of Russian gas.
Ed Gresser is Vice President and Director for Trade and Global Markets at PPI.
Ed returns to PPI after working for the think tank from 2001-2011. He most recently served as the Assistant U.S. Trade Representative for Trade Policy and Economics at the Office of the United States Trade Representative (USTR). In this position, he led USTR’s economic research unit from 2015-2021, and chaired the 21-agency Trade Policy Staff Committee.
Ed began his career on Capitol Hill before serving USTR as Policy Advisor to USTR Charlene Barshefsky from 1998 to 2001. He then led PPI’s Trade and Global Markets Project from 2001 to 2011. After PPI, he co-founded and directed the independent think tank ProgressiveEconomy until rejoining USTR in 2015. In 2013, the Washington International Trade Association presented him with its Lighthouse Award, awarded annually to an individual or group for significant contributions to trade policy.
Ed is the author of Freedom from Want: American Liberalism and the Global Economy (2007). He has published in a variety of journals and newspapers, and his research has been cited by leading academics and international organizations including the WTO, World Bank, and International Monetary Fund. He is a graduate of Stanford University and holds a Master’s Degree in International Affairs from Columbia Universities and a certificate from the Averell Harriman Institute for Advanced Study of the Soviet Union.
Cryptocurrency has taken the world by storm. Depending on the day, digital currencies are now cumulatively valued at several trillion dollars. Financial and non-financial corporate executives, once dismissive, increasingly understand the importance of cryptocurrency and related technologies for the future.
However, the federal government is only in the early stages of deciding how to regulate cryptocurrency, which could have enormous implications going forward.
In this condensed conversation hosted by the Progressive Policy Institute, Congressman Jake Auchincloss (D-MA) provides some remarks on his experience in the field and where he sees his role as a Member of Congress in regulating this unprecedented technology. His remarks ignited a dynamic discussion with business leaders, including Dante Disparte, Circle’s Chief Strategy Officer and Head of Global Policy, Kirsten Wegner, CEO of the Modern Markets Initiative and a Mosaic Project cohort member, and Michael Katz, Director of Legal, Digital Currency Group. PPI’s Vice President and Chief Economist Michael Mandel moderated the conversation.
On this episode of RAS Reports, Curtis Valentine, Co-Director of the Reinventing America’s Schools project, sits down with Karega Rausch, the President and CEO of the National Association of Charter School Authorizers. NACSA works to advance and strengthen the ideas and practices of charter school authorizing so students and communities – especially those who are historically under-resourced – thrive. Karega Rausch has extensive experience in charter school authorizing, education research and policy, community engagement, and strategic advocacy. In this vibrant conversation, Curtis and Karega discuss what makes charter schools successful and highlight the potential that charter schools have to provide all students, regardless of socioeconomic background, with a quality public education.
Learn more about the Reinventing America’s Schools Projecthere.
Learn more about the Progressive Policy Institutehere.
On this episode of the Radically Pragmatic podcast, Dr. Kalinda Ukanwa sits down with Jordan Shapiro, PPI’s Data and Economic Policy Analyst, to discuss her new paper entitled, “Breaking Up Big Tech Will Not Prevent Algorithmic Harm to Society.” Dr. Ukanwa and Jordan dive into what algorithms really are and how they’re simultaneously helping and harming consumers. They unpack why breaking up Big Tech is not the solution to the algorithm bias problem, and they explore what actions can be taken to remedy algorithmic harm on a societal level and in your everyday life.
Dr. Kalinda Ukanwa is an Assistant Professor at the University of Southern California’s Marshall School of Business who researches how algorithmic bias, algorithmic decision-making, and consumer reputations impact firms. Follow Dr. Ukanwa on Twitter at @KalindaUkanwa.
Follow Jordan Shapiro, PPI’s Data and Economic Policy Analyst on Twitter at @jd_shapiro.
Down in the polls and facing a difficult midterm election, Democrats must confront the myths that are hindering their attempts to build a broad and durable governing majority, according to a new study released today by the Progressive Policy Institute (PPI).
“Most Americans want evolutionary, not revolutionary, change,” the authors write in the report. “They want more government in some areas but not all, and within limits. And they want government that respects their commonsense beliefs – for example, that defunding the police is not the path to public safety, abolishing immigration enforcement is not the cure for our southern border, and that it is wrong to exclude parents from decisions about the education of their children.”
Galston and Kamarck’s second edition of The Politics of Evasion comes after their highly influential original analysis, which PPI published in 1989. The stakes are much higher in 2022, as the nation works to rebuild from the pandemic, recover from the chaotic presidency of Donald Trump, and protect our democracy.
“In these extraordinary times, only a Democratic president stands between Trump and the Oval Office. It is the president’s duty to do everything he can to win the 2024 election. There is no greater cause. To do so will require subordinating everything else to this goal — and bringing the Democratic Party along. This will not be easy, but the alternative is defeat — and the further erosion of American democracy,” write Galston and Kamarck.
“The New Politics of Evasion is both a trenchant critique of contemporary myths that hold Democrats back, and a constructive blueprint for the course corrections the party urgently needs to make,” said Will Marshall, President and Founder of the Progressive Policy Institute.
The Progressive Policy Institute (PPI) is a catalyst for policy innovation and political reform based in Washington, D.C. Its mission is to create radically pragmatic ideas for moving America beyond ideological and partisan deadlock. Learn more about PPI by visiting progressivepolicy.org.
FORWARD From Will Marshall, President of the Progressive Policy Institute
In September 1989, the brand-new Progressive Policy Institute published The Politics of Evasion: Democrats and the Presidency. Nearly 33 years later, this political study remains one of the most important and influential documents in the PPI catalogue. It holds more than historical interest today, however, as the Democratic Party once again must wrestle with basic questions of political outlook and electoral strategy.
The Politics of Evasion was written by two distinguished political scholars, Bill Galston and Elaine Kamarck. Their purpose was to explain a 20-year Democratic losing streak in presidential elections. In the six elections between 1968 and 1988, Democrats won only once — Jimmy Carter in 1976 – while averaging just 42% of the popular vote.
Their analysis refuted the principal “myths” that the party’s establishment embraced to explain away these losses and avoid confronting the fundamental reasons voters were rejecting its candidates. The Politics of Evasion laid the political predicate for the rise of the “New Democrats” and Bill Clinton and their successful efforts to infuse new ideas into a stale governing agenda and snap the string of presidential defeats.
Today, Democrats obviously face a very different political environment and set of electoral challenges. What hasn’t changed, however, is the need for unflinching honesty about the party’s struggles to consolidate a broad and a durable majority — even after four years of Donald Trump’s chaotic, divisive and lawless presidency.
Facing a difficult midterm election and the ominous prospect of a second Trump run for the White House, Democrats are once again in need of political reality therapy. Galston and Kamarck have obliged with a fresh analysis of the party’s predicament: The New Politics of Evasion: How Ignoring Swing Voters Could Reopen the Door for Donald Trump and Threaten American Democracy.
The New Politics of Evasion is both a trenchant critique of contemporary myths and a constructive blueprint for the course corrections the party urgently needs to make. It should be required reading for Democratic candidates, strategists, the media, and any citizen worried about the health of our democracy.
PPI is proud present this worthy successor to the original, and I’m personally grateful to Bill and Elaine, longtime friends and foxhole companions, for undertaking it.
INTRODUCTION
In 1989, in the wake of the Democratic Party’s third consecutive presidential defeat, we offered our thoughts for the party’s recovery and renewal. Our diagnosis was blunt. “Too many Americans,” we wrote, “have come to see the party as inattentive to their economic interests, indifferent if not hostile to their moral sentiments, and ineffective in defense of their national security.”[1] Worse, we argued, too many Democrats were explaining away these problems or denying them outright. Instead of facing reality, they had embraced a “politics of evasion” that ignored electoral reality and impeded needed change.
This was 33 years ago. But recent developments compel us to renew our warning. The resurgence of inflation caught Democrats flat-footed and was initially dismissed, making many Americans wonder whether Democrats were in touch with everyday economic reality. The way the United States left Afghanistan weakened confidence in Democrats’ management of foreign and defense policy, raising the political stakes in Ukraine. And worst of all, too many of the most vocal Democrats have adopted stances on fraught social issues — policing, immigration, public schools, and others — that repel a majority of Americans. The title of veteran political analyst Ronald Brownstein’s recent article told a hard truth: “Democrats are losing the culture war.”[2] And when they lose this war, they lose elections — as they did in Virginia last November.
In recent years, a substantial portion of the Democratic Party has convinced itself that Americans are ready for a political revolution that transforms every aspect of their lives. This assumption has crashed into a stubborn reality: Most Americans want evolutionary, not revolutionary, change. They want more government in some areas but not all, and within limits. And they want government that respects their commonsense beliefs — for example, that defunding the police is not the path to public safety, abolishing immigration enforcement is not the cure for our southern border, and that it is wrong to exclude parents from decisions about the education of their children.
Thirty-three years ago, the problems Democrats faced seemed crucial. The Reagan Revolution had attacked the safety net Franklin Roosevelt and successive Democratic presidents had built. What seemed to be at stake was the future of American liberalism.
Nevertheless, the Republican party in 1989 was still led by people like President George H.W. Bush and Senate Minority Leader Robert Dole. While we disagreed with many of their policies, they were leaders who respected the Constitution and the democratic norms that had been followed by American presidents, regardless of party, for centuries. By contrast, the Republican Party that Donald Trump created is much more than a challenge to good public policy; it is a threat to democracy itself. From the refusal to concede an election in which there was no evidence of widespread fraud to efforts to suppress the vote and politicize the apparatus responsible for counting the votes, the Republican Party Trump leads poses the most direct threat to democracy that the United States experienced in modern times.
A Democratic loss in the 2024 presidential election may well have catastrophic consequences for the country and for the nations that have long depended on our stability for their security. The party’s first duty is to protect democracy by winning the next presidential election, and every other consideration, however worthy, must yield to this overriding necessity.
We fear that the Democratic Party is not positioning itself to fulfill this duty. Once again, it is in the grip of myths that block progress toward victory; it does not recognize the new realities that shape American politics; and it has barely begun to develop an agenda on cultural issues that a majority of Americans can support. This triple failure is what we call the new politics of evasion, the refusal to confront the unyielding arithmetic of electoral success.
High ideals are important, but they mean little without the power to put them into practice. Pursuing them in a manner that undermines public support is self-defeating. In this paper, we seek to administer reality therapy to the Democratic Party to prepare the way for victory in 2024. To this end, we will critique the party’s self-defeating myths, explore the realities that must shape successful political strategies, and offer some guidelines for an agenda that can command the support of a new American majority.
THE MYTHS THAT CLOUD DEMOCRATS MINDS
In December of 2021, veteran strategist Doug Sosnik circulated a memo warning his fellow Democrats to disabuse themselves of beliefs that the 2020 presidential election and the off-year election of 2021 have proven to be false.[3] He pointed out that Trump’s victory in 2016 was not, as many Democrats think, an aberration. Trump received 11 million more votes in 2020 than 2016 and increased his share of the popular vote by about 1 percentage point.
Second, Sosnik observed, Democrats’ belief that a higher turnout is always good for Democrats is no longer true. The shift of the Republican Party toward populism and a working-class orientation has increased its share of occasional voters and people who had not previously participated in elections, especially in the midwestern battleground states of Michigan, Wisconsin, and Pennsylvania. The result is an “arms race” in which both parties vie to mobilize new and occasional voters.
We agree with Sosnik about these two myths — and their implications. If Trump seeks the 2024 Republican presidential nomination, he is likely to receive it. And if he does, he will be a formidable opponent. While Democrats must do everything in their power to mobilize voters who support them, the certainty of a strengthened Republican counter-mobilization means that the Democratic candidate must also seek to persuade swing voters, as Joe Biden did in 2020.
As Democrats ponder their future, they must face some hard facts about the current structure of American national politics. Put simply, the country is both deeply divided and closely divided, and each of these dimensions limits the party’s strategic options. Many political activists have concluded, wrongly in our opinion, that deep partisan divisions have increased the importance of mobilizing each party’s most loyal supporters (the “base”) while rendering efforts to persuade swing voters increasingly irrelevant. But the second dimension of today’s elections — how close our national elections have become — calls the exclusive emphasis on base mobilization into question. Swing voters are critical and will remain so for the foreseeable future.
Too many Democrats have evaded this truth — and its implications for the party’s agenda and strategy. They have been led astray by three persistent myths: that “people of color” think and act in the same way; that economics always trumps culture; and that a progressive majority is emerging.[4]
MYTH 1: PEOPLE OF COLOR THINK AND ACT ALIKE
Early in the 21st century, many Democrats came to believe that long-term demographic trends would move the electorate inexorably toward a Democratic majority. The expectation was that decades of robust immigration from previously under-represented countries in the Western Hemisphere and the Asia-Pacific region would steadily increase the diversity of the U.S. population. As they entered the electorate, they would join forces with other people “of color” — especially African Americans and Native Americans — to strengthen support for the Democratic Party, especially its progressive wing. Underlying this projection was the assumption that these new groups would experience various forms of discrimination that would define their political identity and unite them with African Americans and Native Americans in demands for justice and equality.
For a while there was evidence that what some called the “Rising American Electorate” would indeed transform our politics. The coalition that gave Barack Obama a strong majority in 2008 was diverse in all the expected ways, and younger voters brought new and often progressive perspectives into the political arena. Black turnout has remained high, Hispanics continue to stream into the electorate, and turnout among Asian Americans and Pacific Islanders rose by 39% from 2016 to 2020.[5]
But more recently, developments among the largest segment of this coalition, Hispanic Americans, have called into question the belief in the basic similarity among people of color. It was widely recognized that the term “Hispanic” — a census category — covered an internally diverse community from dozens of different countries. It turned out that differences of national origin shaped political outlooks: It was one thing to flee countries dominated by brutal right-wing dictatorships, quite another to hail from socialist societies like Cuba and Venezuela.
As support for socialism surged among young progressive Democrats, these differences of origin influenced voting patterns. Nationally, support for Democratic presidential candidates fell from 71% in 2012 to 66% in 2016 and 59% in 2020 among Hispanic voters.[6] In Florida, home to large numbers of Cuban and Venezuelan refugees, Joe Biden received just 53% of the Hispanic vote, compared to Hillary Clinton’s 62%. This may have cost Biden the state with its 29 electoral college votes.
Since the 2020 presidential election, Hispanics have continued to drift away from the Democratic Party. An Economist/YouGov survey conducted in late December 2021 found that only 48% of Hispanics approved of Joe Biden’s performance as president and just 47% believed that Biden “cares about people like you.” Forty-three percent of Hispanics reported that they felt closer to the Republican Party than to the Democratic Party.
At the same time, gaps widened between Hispanics and African Americans on key issues. For example, just 12% of African Americans viewed police misconduct as isolated incidents rather than systemic, compared to 40% for Hispanics. Not surprisingly, just 48% of Hispanics regarded criminal justice reform as “very important,” compared to 73% of African Americans. Across the board, Hispanics were less likely to support Biden’s handling of domestic issues, from the pandemic to jobs and the economy and health care.
Hispanics and African Americans also disagree on Critical Race Theory and its role in education. Only 35% of Hispanics have a favorable view of CRT, compared to 60% of African Americans. By 43 to 18%, Hispanics oppose teaching CRT in public schools, while African Americans favor including it, 43 to 20%.[7]
In foreign policy, Hispanics were more hawkish than African Americans; only 43% of Hispanics approved of Biden’s foreign policy, versus 60% of African Americans.[8] Democrats have long assumed that immigration is the top concern for Hispanics, a proposition that survey research does not support.
Like other immigrant groups, Hispanics have faced prejudice and discrimination. But because Hispanics are immigrants, arriving here on their own free will, equating their experience with that of African Americans is misleading. Democrats must consider the possibility that Hispanics will turn out to be the Italians of the 21st century — family-oriented, religious, patriotic, striving to succeed in their adopted country, and supportive of public policies that expand economic opportunity without dictating results. It took three generations for Italians to break down barriers to equal participation in all aspects of American life, and that may turn out to be the case for Hispanics as well. In the end, a majority of Italians became Republicans. Democrats must rethink their approach if they hope to retain majority support among Hispanics.
This case-study points to a broader truth: the phrase “people of color” assembles highly diverse groups under a single banner. The belief that they will march together depends on assumptions that are questionable at best — in particular, that not being white is more important than the differences that define their distinct identities. American history offers many counterexamples to this assumption, and Democrats would be unwise to bet their future on its validity.
MYTH 2: ECONOMICS TRUMPS CULTURE
Ever since Franklin D. Roosevelt created the modern social welfare state and a plethora of laws designed to protect workers, the Democratic party has viewed itself as the party of working-class and middle-class voters who would be bound to the party by economic and material benefits.
Much has changed since FDR took office nearly nine decades ago, but for some Democrats it will always be 1933. Too many Democrats believe that economic issues are the “real” issues, and that cultural issues are mostly diversions invented by their adversaries for political purposes. This gives rise to the “What’s the Matter with Kansas?” syndrome in which Americans are allegedly manipulated into voting against their economic self-interest.[9]
For Americans across the political spectrum, social, cultural, and religious issues are real and — in many cases — more important to them than economic considerations. These issues reflect their deepest convictions and shape their identity. Economic circumstances do not determine views on guns, abortion, or religion, and attitudes toward immigration reflect deep-seated beliefs about ethnic and national identity.[10]
The myth of economic determinism has another political downside: It leads too many Democrats to believe that showering Americans with public resources is the surest path to victory. This is true in some circumstances but not others. First, the structure of public programs must be consistent with the people’s moral sentiments. FDR understood that programs, such as Social Security, to which individuals contribute in return for future benefits are most likely to enjoy enduring political support, which is why Lyndon Johnson went down the same road with Medicare.
Non-contributory programs must pass two tests in the court of public opinion: beneficiaries must need these benefits and they must deserve them. Victims of natural disasters almost always pass these tests, and big economic downturns are the moral equivalent of natural disasters. But most people don’t understand why upper-income Americans deserve big tax breaks like deducting the full amount of property taxes on their mansions, and most people believe that it’s reasonable to ask needy beneficiaries to reciprocate by doing what they can to improve their own lot.
The myth of economic determinism goes a long way towards explaining why Democrats have had such a hard time winning back the votes of the white working class—and why they seem to be losing support among Hispanic working-class voters as well. Announcing his presidential campaign in 2015, Donald Trump pledged not to cut Medicare, Medicaid, and Social Society.[11]
In rejecting calls for “entitlement reform” in the name of fiscal responsibility, policies advocated by Speaker Paul Ryan’s wing of the Republican Party, Trump took away one of the Democrats’ best and most time-tested attacks. And by reorienting the Republican Party away from cuts in programs on which working- and middle-class voters depended for their security, Donald Trump removed the key obstacle to a cultural appeal based on anti-immigrant sentiments and nationalism. This improved his party’s prospects in states with above-average shares of white working-class voters. This cultural appeal helped move two states (Ohio and Iowa), which Barack Obama won as recently as 2012, beyond Democrats’ reach. Democrats are now unlikely to win these two states until there is a Democratic landslide — which hasn’t happened since 1964. And it has made the upper Midwest fiercely competitive, a face-off that is likely to persist until the battle lines between the parties are redrawn.
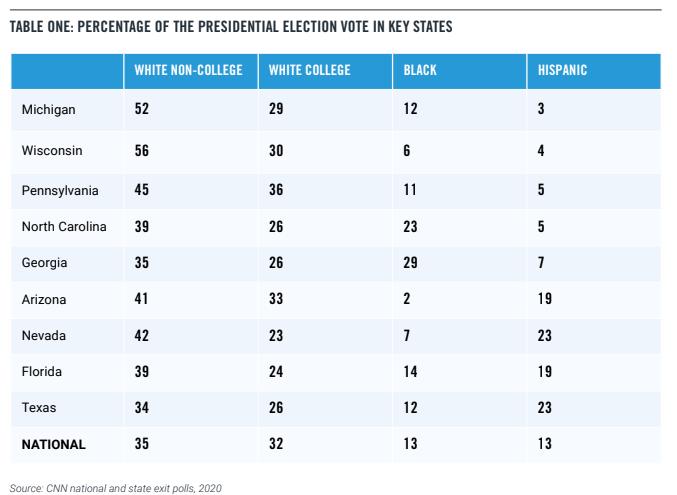
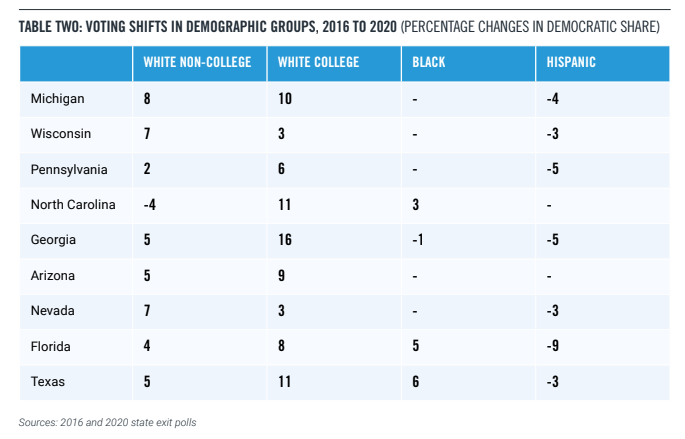
A glance at the demography of voters in swing states shows why this shift is so important.
With the exception of Georgia and Texas, white non-college voters in these swing states comprise a substantially larger share of the electorate than Black and Hispanic voters combined. Seven of these nine states have shares of white non-college voters above the national average, while the remaining two (again, Georgia and Texas) are at the average. Conversely, five of these states have below-average shares of white college-educated voters, three are average, and only one (Pennsylvania) is significantly above average. Black voters are well above the national average in two swing states (North Carolina and Georgia), while Hispanic voters are significantly above average in four states (Arizona, Nevada, Florida, and Texas). Of these states where Hispanics are strong, Biden won just two. Florida is the only swing state where Trump increased his winning margin in 2020 over 2016, while Biden’s gains in Texas, though significant, fell short of expectations.
As Table Two shows, compared to Hillary Clinton, Joe Biden scored significant gains among both college-educated and non-college white voters and equaled her showing among Black Americans. In every state Biden won, the critical change was that he managed to improve her performance among white non-college voters. If he had not done so, he would have lost in Georgia, Arizona, and Wisconsin, wiping out his advantage on the Electoral College.
By contrast, as the last column of Table Two indicates, Biden fell short of Clinton’s share among Hispanics in seven of nine swing states and could do no better than match it in the remaining two. Unless Democrats can improve their performance among Hispanics, Florida will remain out of reach, and their hopes of turning Texas blue will remain unfulfilled.
Democrats who think that the mobilization of their base will be sufficient to win elections overlook the sheer number of white non-college voters in key states. This does not mean that Democrats should ignore their base, but it does mean that they need to walk a fine line between mobilizing their base and attracting enough white non-college voters to win. In 2020, COVID had created an economic and social crisis that brought just enough of these voters back to the Democrats in key swing states. But these successes must not blind Democrats to the fact that these voters often have found Republicans’ cultural claims more persuasive than the Democrats’ economic arguments.
MYTH 3: A PROGRESSIVE ASCENDENCY IS EMERGING
The Democratic Party is a broad coalition of left-wing progressives, center-left liberals, and moderates. In the country as a whole, both conservative and moderate voters are more numerous than are those who consider themselves liberal or progressive. But despite these well-known statistical truths, many Democrats have convinced themselves that a new “very liberal” or “progressive” majority was emerging, in the party and in the country.
There is little evidence that this is true today or that the attitudes of the electorate are moving in this direction. The most recent survey of voters’ ideology found that only 7% of the
electorate considers itself very liberal.[12] Another survey found that only 9% of voters associated themselves with policies identified with leaders such as Senator Bernie Sanders and Representative Alexandria Ocasio-Cortez, compared to 26% who supported the center-left positions identified with Joe Biden.[13]
It is true that Americans turn to government when problems arise that the market cannot solve (or even exacerbate). Measures to expand investments in infrastructure, education, research, and technology enjoy broad public support, as do efforts to rein in the cost of prescription drugs. When economic inequality becomes blatant, Americans will support efforts to reduce it — for example, by increasing taxes on large corporations and wealthy individuals.
At the same time, decades of declining trust in the competence and integrity of the public sector have left Americans wary of government as the solution to social problems. Capitalism has its excesses and deficiencies, they believe, but socialism is not the answer. And when government responses to real issues — such as the hardships created by the pandemic — contribute to new problems such as inflation, support for an activist public sector quickly wanes. There is scant evidence that Americans will accept the costly government-led economic agenda of which progressives dream.
Nowhere is the myth of the progressive ascendency more powerful than in the sphere of culture. Many Democrats believe that the most progressive cultural attitudes enjoy the support of a popular majority. These Democrats are living in a bubble defined by education, income, and geography. Time after time, Republicans use progressives’ overreach in areas such as crime, immigration, and education to drive wedges between swing voters and the Democratic Party. This pattern will not end until Democrats break out of the mindset that dominates deep blue areas, familiarize themselves with the rest of the country and then carefully craft stances on these issues that move the country forward — and that a majority of Americans can embrace.[14]
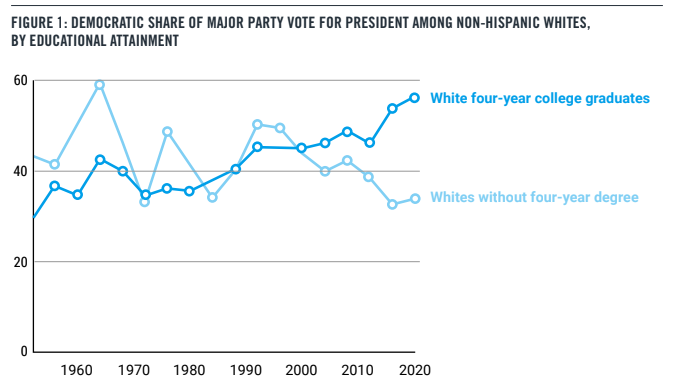
Much of this cultural bubble is a consequence of changing educational patterns in the electorate. Starting in 2000, whites with four-year college degrees moved towards the Democrats as whites without four-year degrees maintained their long-term movement away. Biden’s candidacy continued the shift of educated voters toward the Democratic Party while reversing only modestly the shift of voters without four-year degrees in the opposite direction.
Among all voters with a four-year degree or higher, Biden got 61% of the vote, up from Hillary Clinton’s 57% in 2016. This total included 57% of white voters with a college degree or more, 69% of college-educated Hispanics, and 92% of college-educated African Americans. The gap in support for Biden among whites with and without college degrees was 24 points; among Hispanics with and without college degrees, 14 points. (By contrast, there was no education gap whatsoever among Black voters.)[15]
A college degree matters in two ways: it contributes to higher incomes; and independent of income, college-educated voters have a cultural outlook that on average leans in a more liberal or progressive direction.
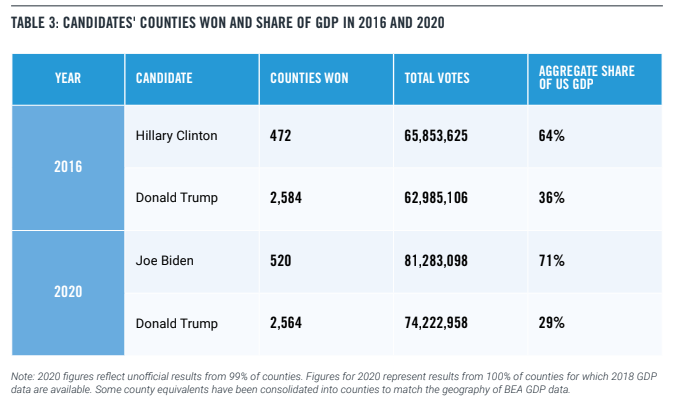
As Democrats have gained ground among college-educated voters while losing support among less-educated voters, they have increased their support in upper-income jurisdictions. Although the popular vote in 2016 was fairly close, Hillary Clinton won counties accounting for 64% of GDP. Although the popular vote remained relatively close in 2020, Biden won counties totaling an astounding 71% of GDP.
The cultural bubble is also the result of the increasingly intense geographic polarization that has shaped the outlook of a new generation of political activists. In deep blue states like Massachusetts and California, the political spectrum runs from the far left — where a concept like democratic socialism, for example, is very popular — to the center. In these states, groups like Justice for All, wage war against officials in the center, whom they often refer to as “corporate Democrats.” A generation of political office holders and activists has come of age never having to speak to evangelical Christians, pro-life advocates, or just plain old Republicans.[16]
In sum: for reasons of education, income, and geography, many Democratic voters and leaders are far removed from the daily experiences and cultural outlooks of non-college voters. For example, in the wake of the George Floyd murder in Minneapolis, whites joined Blacks all over the country to protest police brutality. Out of this was born a reinvigorated interest in police reform as many whites learned more about the experiences of African Americans at the hands of the police. Much of the work on police reform was broadly popular since it focused on commonsense measures to make policing more accountable and getting others to do the work that diverts police from their mission of fighting crime.[17] But then advocates settled on a disastrous slogan — defund the police — to describe their aims. For prosperous whites living in safe urban neighborhoods or the suburbs, this label and the polices were unfortunate, but not a deal breaker. But for whites and others living in or near neighborhoods with high crime rates, it was.
As it turned out, African Americans in high-crime neighborhoods didn’t think much of the idea either. A reform ballot initiative in Minneapolis (George Floyd’s city) and the mayoral candidate who supported it went down to defeat. The opposition to this initiative included African American voters, 75% of whom were opposed to shrinking the size of the police force.[18]
Although most high-profile Democrats explicitly rejected the “defund the police” language, Republicans worked overtime to ensure that the public knew the phrase and associated it with the Democrats. Congressman Jim Clyburn, the Majority Whip in Congress, believes that it cost the party as many as a dozen seats in the House of Representatives in the 2020 election.[19]
This should not have come as a surprise. Since the late 1960s, Republicans have made unprincipled but effective use of Democrats’ vulnerabilities on social and cultural issues, especially those with racial overtones. There’s a straight line from Willie Horton, the Black rapist and murderer who featured prominently in George H. W. Bush’s 1988 campaign, to rhetoric used in the fight around “defund the police” and “critical race theory,” which figured prominently in the 2021 Virginia gubernatorial campaign.
A similar story played out in recent elections that featured renewed interest in socialism. Among the young, favorable attitudes towards socialism are much stronger than they are among older people.[20] But there is an important generational difference; younger people tended to equate socialism with a robust welfare state along Scandinavian lines, while to older people it meant state control of the means of production. Even though Biden often said —clearly and forcefully — “I am not a socialist,” the image stuck to the party like glue. For important segments of the population, especially those who can remember the Cold War and those who escaped from socialist failures in Eastern Europe and Latin America, socialism was nothing short of a disaster, and a party that seemed sympathetic to it was unacceptable.
When we first wrote about the politics of evasion over three decades ago, Democrats had allowed the public to form an impression of them as the party that sympathized with criminals more than with their victims — that is, a party outside the moral mainstream. Although many of today’s cultural issues are different, the problem remains the same, and Democrats will remain on the cultural defensive until they pursue social change with policies and language — and at a pace — that can command a sustainable majority.
A new survey commissioned by the Democratic Congressional Campaign Committee may finally get the party’s attention. The poll found that when Democratic candidates leave Republicans’ cultural attacks unanswered, the GOP lead on the generic ballot increases from 4 to 14 points. These attacks are especially potent among swing voters, including centrists, Independents, and Hispanics. A strong Democratic response — supporting the police and border security, for example — undoes much but not all the damage.[21] [22] If this survey doesn’t wake up the Democratic Party and its candidates, Democrats face a brutal reckoning in November, and the problem will persist until the party, led by the president, clearly signals that it is rejoining America’s cultural mainstream.
III. REALITIES THAT DEMOCRATS MUST FACE: THE NEW STRUCTURE OF AMERICAN POLITICS
Everyone senses that partisanship is more intense and more comprehensive than it was four decades ago, and that building bipartisan coalitions is far more difficult. The share of safe House seats where party primaries settle the outcome of general elections has soared, making it more difficult for moderates to be nominated since their party will retain the seat even if nominees are far outside the mainstream. The sorting out of the electorate into increasingly homogenous geographical areas has created echo chambers that intensify partisan beliefs and sentiments.
But there is another, less discussed structural feature of contemporary politics — how closely divided we are along partisan lines, and how the absence of a stable majority shapes competition between the parties.
When we assess our national politics over the past century, a remarkable pattern emerges. Of the 17 presidential elections between 1920 and 1984, 10 were settled by margins of 10 percentage points or more in the popular vote, and five yielded landslides in which the winner’s margin exceeded 20 points. But in the nine elections between 1988 and 2020, no candidate has come close to a 10-point victory margin, and five of the past six have been settled by margins of less than 5 percentage points. In five of these elections, the winner failed to secure a majority of the national popular vote; in two, the candidate who lost the national popular vote prevailed in the Electoral College. During this 32-year period, neither political party has been able to establish a stable national majority, and the White House has changed hands between the parties five times. Of the roughly 1 billion votes cast for the major party candidates in the past nine elections, Democrats received 51.2% compared to 48.2% for Republicans.
Our conclusion: Even though deepening partisanship has reduced the number of swing voters, the narrow margins of our recent national elections has made these voters more important than ever. This reality will dominate national politics until one party breaks the deadlock of the past three decades and creates a decisive national majority.
As evidence, consider the difference between the election of 2016, which the Democratic presidential nominee narrowly lost, and 2020, which the Democratic nominee narrowly won. Hillary Clinton bested Donald Trump by 2.2 percentage points in the national popular vote, while Joe Biden beat him by 4.4 percentage points, and the additional two points proved decisive.
The 2020 election witnessed a massive increase in the popular vote, with the highest turnout in more than a century. But the mobilization extended across the political spectrum. Joe Biden received 15.4 million more votes than Hillary Clinton and increased the Democratic share of the popular vote by 3.1 percentage points, while Donald Trump raised his vote total by 11.2 million over his 2016 performance, and his share of the popular vote by 0.8 points. Meanwhile, votes cast for independent and third-party candidates, which had soared to nearly 6% of the electorate in 2016 fell back to 1.8%, roughly the average in the past two decades.
Here is the crucial point: because voters in both parties surged to the polls in record numbers, the shape of the electorate changed only marginally. Compared to 2016, white Americans’ share of the electorate fell by 2 points, matching the average decrease in recent quadrennial cycles. The Black share rose from 10 to 11 points, while Hispanics remained steady at 10.[23] Looking across most sub-groups, including age and geography, the same pattern prevails. Joe Biden won the 2020 presidential contest not by changing the shape of the electorate, but rather by improving his share of the vote in key parts of the electorate.
For example, Biden won 48% of the male vote, up from Clinton’s 41%, while raising Democrats’ margin of victory among white college-educated men from 3 to 10 points. He even managed to raise the Democratic share of the white working class men’s vote — the heart of the Trump coalition — to 31%, versus Clinton’s weak 23% showing.
Although Joe Biden made incremental gains across most parts of the electorate, there is no guarantee that these swing voters will stick with him next time, and recent polls suggest that they are pulling away.[24] None of these changes fundamentally transformed the Democratic coalition or broke the partisan stalemate.
We are likely to face a close contest for the popular vote in 2024. But as every high school student should know, the national popular vote does not determine the outcome of presidential elections; it is the state-by-state vote.
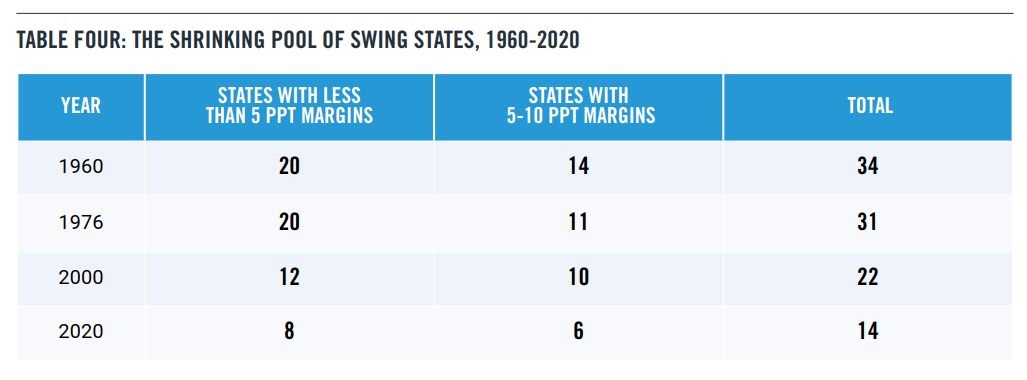
It seems logical that as the number of close presidential elections has increased, so would the number of swing states. But just the opposite has happened: as swing elections have become the norm, swing states have been disappearing.
Consider four presidential elections over the past six decades, each resolved by less the 5 percentage points in the national popular vote.
Although the number of swing states has decreased by more than one-half over the past six decades, they continue to determine the outcome of presidential contests. If Biden had received 11,780 fewer votes in Georgia (0.2% of the total), 10,458 in Arizona (0.3%), and 20,683 fewer in Wisconsin (0.6%), his 306-232 Electoral College victory would have turned into a 269-269 tie, and the election would have been thrown into the House of Representatives, handing Donald Trump another four years in the Oval Office. If Biden’s national popular vote had been 3% rather than 4.4%, Trump probably would have prevailed outright in the Electoral College.
The explanation is familiar but bears repeating: because Democrats are highly concentrated in a handful of states, Democratic candidates win these states by huge margins that do not improve their prospects in the Electoral College. Biden won the five states with the largest Democratic edge in the popular vote by a total of 11.3 million votes. By contrast, Trump won the five states with the largest Republican popular vote edge by only 3.0 million votes. Biden won California’s 55 electoral votes by 5.1 million popular votes, while Trump won Texas’s 38 EVs by only 600,000.
Whatever the moral arguments in favor of electing presidents by national popular vote, a constitutional change of this magnitude will not occur anytime soon, if ever. In the meantime, Democrats must play the hand they have been dealt. Presidential elections will be won or lost in the Electoral College, and — fair or not — some states have more impact than others in determining who wins. This reality does not please progressives, many of whom come from solidly blue states, and it often eludes Democratic activists who hail from deep blue states. But unless they want to spend their careers in a minority party, they must acknowledge the need to win swing states — and the political implications of this necessity.
We cannot rule out the possibility that one of the two political parties will run an unappealing candidate with an unpopular message, creating a surge of support for the other major party candidate. Nor can we rule out a national crisis of some sort that results in a one-time rejection of the incumbent party. Such crises occurred in 2008 at the onset of the Great Recession, and in 2020 with the onset of the COVID pandemic. Butuntil one political party breaks the stalemate and forges an enduring national majority, close elections will remain the rule, swing voters in swing states will remain the key to victory, and grandiose interpretations of victory will prove to be hollow if not downright dangerous.
SWING STATES, SWING VOTERS
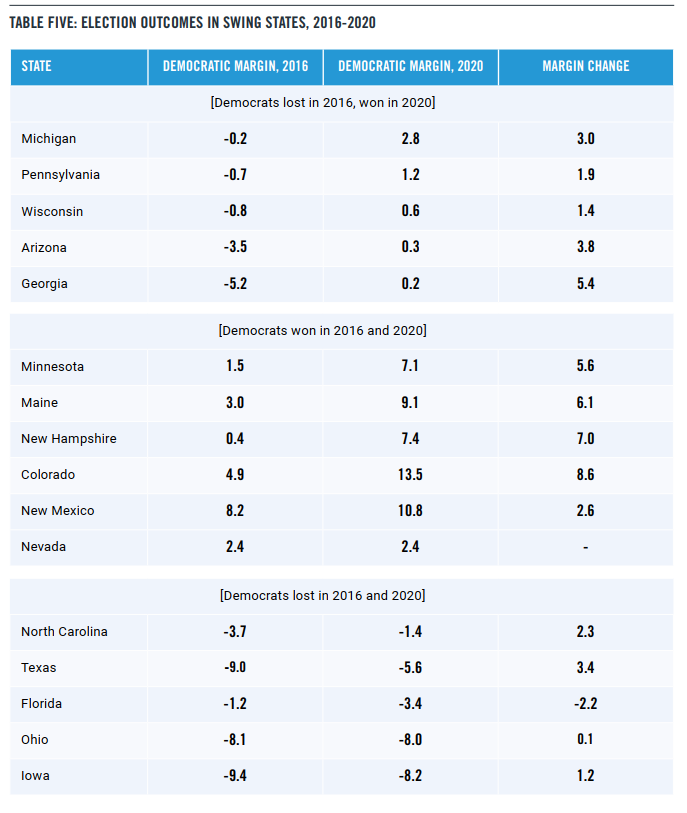
If swing voters in swing states are the key to victory, we must understand what and who they are. Table Five, which compares outcomes in 2016 and 2020 for states decided by 10 percentage points or less in 2016, helps identify the analytical questions.
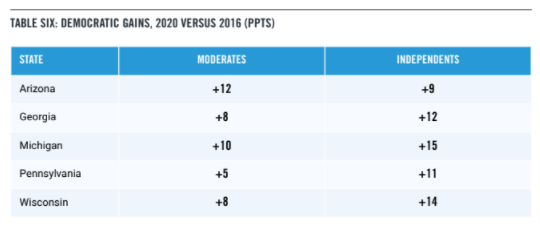
As we see in Table Six, Biden moved five crucial states from the Republican to the Democratic column by making large gains among swing voters in the heart of the electorate, especially moderates and independents.
Consistent with these developments, Biden increased the Democratic share of the suburban vote, where moderates and independents are dense on the ground, from 45% in 2016 to 54% in 2020 while failing to improve on Hillary Clinton’s dismal showing in rural areas, where conservative voters cluster.[25]
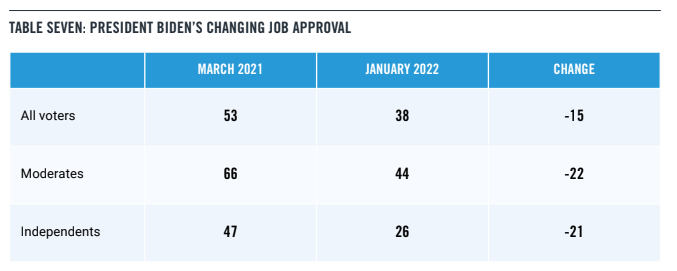
Unfortunately, recent surveys indicate that during his first year in office, Biden has surrendered these gains. For example, an Economist/YouGov survey conducted in February 2022 found that only 46% of moderates and a dismal 30% of independents approve of Biden’s performance as president.[26] The outcome of the Virginia gubernatorial race points in the same direction. According to an analysis by the Democratic Governors Association, while Joe Biden won Virginia’s independents by 17 points, Terry McAuliffe lost them by 10.[27]
A recent report from the Pew Research Center offers addition evidence of substantial losses in the center of the electorate.[28]
In early 2021, when public approval for President Biden was at its peak, support among independent voters who say they “lean” toward the Democrats was nearly as high as among voters who identify as Democrats, and differences between strong and not-strong Democrats were insignificant. Since then, the gap between these groups has widened significantly. While the president’s ratings among Democrats have declined by 19 percentage points (from 95% to 76%), they have declined by 32 percentage points among “leaners.” A similar gap has opened between those who say they are “strong” and “not strong” Democrats.
Other findings from the Pew study show that differences among these three groups of Democratic supporters are closely correlated with ideology. The erosion of support for Biden has been greatest among not-strong Democrats and independents leaning Democratic, groups in which conservatives and moderates outnumber liberals.
Other survey data support Pew’s findings. For example, compare two polls conducted by the Economist and YouGov, the first in mid-March of 2021,[29] the second in the third week of January 2022.[30]
If the next presidential election were held tomorrow, these losses in the center of the electorate mean that Biden would lose all the swing states he moved from the Republican to the Democratic column in 2020, setting the stage for an Electoral College defeat.
But what about Donald Trump? Will the voters who switched from Trump to Biden in 2020 vote to return a uniquely destabilizing and divisive figure to the Oval Office? No one knows for sure, of course, but recent surveys are not reassuring. Two recent surveys placed the current and former president in a dead heat, and the most respected Iowa poll found Trump leading Biden by 11 points in the Buckeye State, 3 points better than Trump did in the 2020 election. Democrats dare not assume that Trump’s conduct as president (and afterwards) has made him unelectable.
Our conclusion: Despite intense partisan polarization, swing voters form the heart of the electorate in swing states, and Democrats cannot win without them. Reversing losses among moderate and independent voters will be key indicators of success between now and the 2024 election.
IV. THE PATH AHEAD: RENEWING THE DEMOCRATIC PARTY
It is beyond our power to offer a comprehensive plan to win the 2024 election and defeat the threat Donald Trump poses to constitutional democracy. But we can make a start. Simply stated, Democrats need an agenda that advances their policy aims in a manner that a majority of Americans can support, and they need an operating manual to ensure that bad execution does not undermine good intentions.
A. The agenda Economics for the kitchen table
In a rapidly changing economic environment, unexpected events often outrun specific policy recommendations. Still, we can offer some guidelines for the Democrats’ long-term agenda.
The American people favor policies that expand opportunity and mobility while protecting them against negative economic developments with which individuals and families cannot cope on their own. And they favor fairness, including asking corporations and wealthy individuals to contribute more to build an economy that works for all, not just a favored few. They do not favor limited government as Republicans have long defined it, they want protection against the excesses and inadequacies of the market, but they do not want socialism. The administration should offer policies within this framework, and it should defend them by appealing to these widely held values. In addition, the administration should:
Make it clear that the party pursues growth that is both inclusive and non-inflationary. In current circumstances, this means fully funding new programs with revenues that match the pace of outlays. Until inflation has been brought under control, a policy of “Buy now, pay later” would be irresponsible.
Invest in programs that increase supply — including labor supply — for the long-term. This includes legislation to boost domestic production of computer chips to programs, such as universal pre-K, that help potential workers — especially women — return to the paid labor force.
Focus less on omnibus bills known mainly for their price-tag and more on targeted legislation whose benefits for average families can be explained briefly and persuasively.
Design benefit programs that aid people who need assistance, not those who don’t. Policies that help families making $400,000 or more per year are hard to justify and even harder to pay for.
National security in a new era
During the Obama administration, it became fashionable to assert that conflicts among nations were giving way to transnational threats such climate change, mass migration, and nuclear proliferation. Progressives welcomed this shift on the grounds that transnational problems required international cooperation rather than competition that required expensive armed forces and sometimes led to war. We need to shift away from “an artificially constructed system of 195 countries,” says a leading proponent of this view, and “put people first,” wherever they may live.[31]
Unfortunately for progressives, reality has not conformed to their aspirations. A new axis of autocracy now stretches from the Baltic to the Pacific, and a new era of great power competition has begun. Presidents, regardless of party, will be judged by how they meet its challenges. A Russian takeover of Ukraine would be debited to Joe Biden’s account, as would a Chinese invasion of Taiwan.
After two decades of unending war, the American people do not want another one. But neither do they want to endure defeat and national humiliation. President Biden must do his best to preserve our vital interests by deterring our adversaries from committing acts of aggression.
But deterrence is not cheap. Progressives were dismayed when mainstream Democrats added $25 billion to the president’s defense budget request. This probably won’t be the last time. In current circumstances, it would be irresponsible to use reductions in the defense budget to fund domestic programs, a perennial progressive strategy. Deterring aggression in both Europe and the Asia-Pacific region may well require spending more than the 3.7% of GDP that we now devote to national defense.
After a year in office, 63% of Americans — including 59% of moderates, 65% of suburban residents, 75% of independents, and 59% of Hispanics — see President Biden as a weak leader.[32] Another major national security reverse on top of his chaotic exit from Afghanistan, would reinforce this belief, undermining his party’s credibility as well as his own. He cannot allow this to happen, which means that he will have to face down Democrats who do not want to do what is needed to prevent it.
Social issues in a culturally moderate country
As we have argued through this report, the progressive cultural agenda does not enjoy majority support and weakens Democrats’ electoral prospects whenever it is seen as the dominant force within the party. On all these issues, however, there is an honorable middle ground that enjoys wide public support. Most Americans favor both humane treatment for immigrants, including a path to citizenship for Deferred Action for Childhood Arrivals (DACA) recipients or DREAMers and other longtime residents, along with vigorous enforcement to secure our border. Most Americans don’t want fewer police; they want better police, along with reforms that hold bad cops responsible and weeds them out. Most Americans favor teaching both the positive and negative sides of our history, including slavery and racial discrimination, but they will not tolerate pedagogy they see as dividing students along racial and ethnic lines. And they favor keeping the schools open for their children as we recover from the COVID pandemic.
During the 2020 campaign, Joe Biden understood these distinctions. He made sure that slogans such as “Defund the police” and “Abolish ICE” were excluded from the party’s platform. He was willing to draw lines when necessary. More recently, he met with Eric Adams, the new mayor of New York City, to underscore his agreement with Adams’ support for both strong policing and police reforms. “The answer is not to defund the police,” Biden said. “It’s to give you the tools, the training, the funding to be partners, to be protectors. The community needs you.”[33] And on February 13, House Speaker went on national television to emphasize that defunding the police was not the position of the Democratic Party and that “public safety is our responsibility.”[34]
These statements represent an important return to the balanced stance President Biden adopted during the 2020 election. But neither he nor the party can afford to stop there. Led by the president, Democrats must embrace defensible positions on other social issues — from immigration to the role of parents in public education — that the center of the electorate can accept.
Articulating these positions will cause some strains within the party’s coalition, but there is no alternative. While the president’s desire to preserve party unity is understandable, he cannot afford to do so at the cost of weakening his prospects in 2024. As Terry McAuliffe discovered, social issues often arouse intense passions. By seeking to sidestep Critical Race Theory rather than confronting the political challenge, he allowed himself to become associated with a way of thinking that the majority of his state could not accept. Because Joe Biden may be the last man between Donald Trump and the Oval Office, he cannot afford to repeat this mistake.
B. Implementing the agenda: some notes for the operating manual
In government as in other important activities, it’s not only what you do, but how you do it — and how you talk about it. Implementation failures can undermine parties and presidencies, and communication failures can create barriers to public understanding and acceptance of key policies. Many Americans identify confusing and conflicting advice from public health officials as a core defect of the administration’s pandemic policies.[35] In this spirit, we offer President Biden some operational advice.
How you do it: Pay attention to how your government runs
President George W. Bush suffered greatly from the mess that was the federal government’s response to Hurricane Katrina and from failing to develop an effective plan for Iraq after the U.S. invasion succeeded. President Obama suffered from the crashing of the Affordable Care Act health care marketplace websites and from the scandal at the Veterans Administration that resulted in the deaths of several veterans for lack of timely care. Both presidents suffered these implementation failures in their second terms, and both were succeeded by presidents of the opposite party. As President Harry Truman famously said, “The buck stops here.” Because Democrats have been the party of government ever since the New Deal, every failure that befalls the party of government hurts it even more than it hurts Republicans.
The chaotic Afghanistan withdrawal was a major implementation failure from which President Biden has yet to recover, and his plans for overcoming the pandemic have suffered from over-promising, shifting tactics, and unclear communications. Between now and 2024, Biden and his senior officials must pay more attention to the nitty-gritty of implementation. For example, the distribution of infrastructure funds must be efficient and scandal-free, immigration policy must deploy personnel and resources to adjudicate refugees claims quickly and fairly, and pandemic policy must do a better job of anticipating problems such as new COVID variants and shortages of home-based tests.
CONCLUSION
A remarkable scene took place in Congress on January 6, 2022. Accompanied by his daughter, Representative Liz Cheney (R-Wyo.), former Vice President Richard Cheney came to the floor of the House for ceremonies in remembrance of the attacks on the Capitol the year before. One by one, Democrats warmly greeted the former vice president, whom they had reviled little more than a decade earlier for his role in fomenting the ill-fated Iraq War.
The stakes had changed. Following his daughter’s lead, Dick Cheney had become one of the few Republicans speaking out firmly against the threat to democracy that the Trump-dominated Republican Party had come to represent. Saving constitutional government is a paramount goal that overrides policy differences, however deep.
In these extraordinary times, only a Democratic president stands between Trump and the Oval Office. It is the president’s duty to do everything he can to win the 2024 election. There is no greater cause. To do so will require subordinating everything else to this goal — and bringing the Democratic Party along. This will not be easy, but the alternative is defeat — and the further erosion of American democracy.
DOWNLOAD THE REPORT
ABOUT THE AUTHORS:
William A. Galston is a contributing author for the Progressive Policy Institute. He holds the Ezra Zilkha Chair in the Brookings Institution’s Governance Studies Program, where he is a Senior Fellow. A participant in six presidential campaigns, Galston served from 1993 to 1995 as Deputy Assistant to President Clinton for Domestic Policy. He previously served as professor and acting dean at the University of Maryland’s school of public affairs and founded the Center for Information and Research on Civic Learning and Engagement (CIRCLE) in 2001.
Galston is the author of ten books and more than 100 articles in the fields of political theory, public policy, and American politics. His most recent book is Anti-Pluralism: The Populist Threat to Liberal Democracy. A winner of the American Political Science Association’s Hubert H. Humphrey Award, he was elected a Fellow of the American Academy of Arts and Sciences in 2004. He writes a weekly column for the Wall Street Journal.
Elaine C . Kamarck is a contributing author for the Progressive Policy Institute. She is a Senior Fellow in the Governance Studies program as well as the Director of the Center for Effective Public Management at the Brookings Institution. Elaine is an expert on American electoral politics and government innovation and reform in the United States, OECD nations, and developing countries. She focuses her research on the presidential nomination system and American politics and has worked in many American presidential campaigns. Kamarck is the author of “Primary Politics: Everything You Need to Know about How America Nominates Its Presidential Candidates” and “Why Presidents Fail And How They Can Succeed Again.” She is also the author of “How Change Happens—or Doesn’t: The Politics of US Public Policy” and “The End of Government-As We Know It: Making Public Policy Work.”
Kamarck is also a Lecturer in Public Policy at the Harvard Kennedy School of Government. She started at the Kennedy School in 1997 after a career in politics and government. She has been a member of the Democratic National Committee and the DNC’s Rules Committee since 1997. She has participated actively in four presidential campaigns and in ten nominating conventions—including two Republican conventions—and has served as a superdelegate to five Democratic conventions. In the 1980s, she was one of the founders of the New Democrat movement that helped elect Bill Clinton president. She served in the White House from 1993 to 1997, where she created and managed the Clinton Administration’s National Performance Review, also known as the “reinventing government initiative.”
RESOURCES:
1. William Galston and Elaine Ciulla Kamarck, “The Politics of Evasion: Democrats and the Presidency,” Progressive Policy
Institute, September 1989, https://www.progressivepolicy.org/wp-content/uploads/2010/01/Politics_of_Evasion.pdf.
2. Ronald Brownstein, “Democrats Are Losing the Culture Wars,” The Atlantic, December 9, 2021, https://www.theatlantic.
com/politics/archive/2021/12/democrats-lose-culture-war/620887/.
3. Doug Sosnik, “A Look Ahead to the 2022 Midterm Elections and Beyond,” The Brunswick Group, December 15, 2021.
4. For similar arguments, forcefully presented, see Ruy Teixeira, https://thedemocraticstrategist.org/_memos/SM_Teixeira_
Not_Build_Coalition.pdf.
5. Yair Ghitza and Jonathan Robinson, “What Happened in 2020,” Catalist, https://catalist.us/wh-national/.
6. “Behind Biden’s 2020 Victory,” Pew Research Center, June 30, 2021, https://www.pewresearch.org/politics/2021/06/30/
behind-bidens-2020-victory/.
7. Economist/YouGov survey, February 12-15, 2022, https://docs.cdn.yougov.com/mfe5ie0pbd/econTabReport.pdf.
8. Economist/YouGov survey, December 12-14, 2021, https://docs.cdn.yougov.com/pnu6yfcz0j/econTabReport.pdf.
9. This refers to the 2004 book by Thomas Frank of that name.
10. For a compelling interpretation of the 2016 election along these lines, see John Sides, Michael Tesler, and Lynn Vavreck,
Identity Crisis and the Battle for the Meaning of America (Princeton: Princeton University Press, 2018).
11. “Donald Trump’s Presidential Announcement Speech,” Time, June 16, 2015, https://time.com/3923128/donald-trumpannouncement-speech/.
12. Lydia Saad, “U.S. Political Ideology Steady; Conservatives, Moderates Tie,” Gallup, January 17, 2022, https://news.gallup.
com/poll/388988/political-ideology-steady-conservatives-moderates-tie.aspx.
13. Pat Canny, “A Five Party America,” Medium (Half Baked Fixes, September 30, 2021), https://medium.com/market-failures/
a-five-party-america-6436f0f8d4b6.
14. For a parallel argument, see Ezra Klein, “David Shor Is Telling Democrats What They Don’t Want to Hear,” New York Times,
October 8, 2021, https://www.nytimes.com/2021/10/08/opinion/democrats-david-shor-education-polarization.html.
15. Pew Research Center, “Behind Biden’s 2020 Victory,” https://www.pewresearch.org/politics/2021/06/30/behind-bidens2020-victory/.
16. The situation is mirrored on the other side of the aisle, where a generation has come of age never having to understand
the trials and tribulations of transgender persons or the persistent racism that so many Americans live with every day.
Just as left-wingers vilify centrists as corporate Democrats, right wingers vilify their center as RINOs (Republicans in
Name Only.)
17. Rashawn Ray, “What Does ‘Defund the Police’ Mean and Does It Have Merit?,” Brookings, June 19, 2020, https://www.
brookings.edu/blog/fixgov/2020/06/19/what-does-defund-the-police-mean-and-does-it-have-merit/.
18. “Minnesota Poll Results: Minneapolis Policing and Public Safety Charter Amendment,” Star Tribune, September 18,
2021, https://www.startribune.com/minnesota-poll-public-safety-minneapolis-police-crime-charter-amendment-ballotquestion/600097989/.
References
THE NEW POLITICS OF EVASION: HOW IGNORING SWING VOTERS COULD REOPEN
THE DOOR FOR DONALD TRUMP AND THREATEN AMERICAN DEMOCRACY
P24
19. Matthew Brown, “Democratic Whip James Clyburn: ‘Defund the Police’ Cost Democrats Seats, Hurt Black Lives Matter
Movement,” USA Today, November 9, 2020, https://www.usatoday.com/story/news/politics/2020/11/08/james-clyburndefund-police-cost-democrats-seats-hurt-black-lives-matter/6216371002/.
20. E.J. Dionne and William A. Galston, “Socialism: A Short Primer,” Brookings, May 13, 2019, https://www.brookings.edu/blog/
fixgov/2019/05/13/socialism-a-short-primer/.
21. Sarah Ferris and Ally Mutnick, “GOP Culture War Attacks ‘Alarmingly Potent,’ DCCC Warns,” Politico, February 15, 2022,
https://www.politico.com/news/2022/02/15/gop-culture-war-attacks-alarmingly-potent-dccc-warns-00009265.
22. Ryan Lizza and Rachael Bade, “Politico Playbook: Exclusive Poll: Answers to the Midterm’s 2 Big Questions,” Politico,
February 16, 2022, https://www.politico.com/newsletters/playbook/2022/02/16/exclusive-poll-answers-to-the-midterms2-big-questions-00009342?cid=hptb_primary_0.
23. Pew Research Center, “Behind Biden’s 2020 Victory,” https://www.pewresearch.org/politics/2021/06/30/behind-bidens2020-victory/.
24. A recent Economist/YouGov poll (https://docs.cdn.yougov.com/npwlx2cq4r/econTabReport.pdf) found that President
Biden’s job approval stands at 46% among moderates, 30% among independents, 36% among Hispanics, 38% among
suburban voters, and 27% among whites without four-year degrees — all significantly lower than the share of their voters
Biden received in the 2020 election.
25. “Behind Biden’s 2020 Victory.”
26. Economist/YouGov survey, February 5-8, 2022, https://docs.cdn.yougov.com/npwlx2cq4r/econTabReport.pdf.
27. Democratic Governors Association, “What happened in Virginia and what we can learn from it heading into 2022,”
December 20, 2021.
28. “Biden Enters Year Two Facing Diminished Support, Daunting Challenges,” Pew Research Center, January 25, 2022, https://
www.pewresearch.org/politics/2022/01/25/biden-starts-year-two-with-diminished-public-support-and-a-daunting-list-ofchallenges/.
29. Economist/YouGov survey, March 13-17, 2021, https://docs.cdn.yougov.com/bajzsg3506/econTabReport.pdf.
30. Economist/YouGov survey, January 22-25, 2022, https://docs.cdn.yougov.com/w6rek2s6zg/econTabReport.pdf.
31. Anne-Marie Slaughter, “It’s time to get honest about the Biden doctrine” The New York Times, November 12, 2021, https://
www.nytimes.com/2021/11/12/opinion/biden-foreign-policy.html.
32. Economist/YouGov survey, January 22-25, 2022.
33. Mike Memoli, “Biden Rolls out Election-Year Crime Messaging in New York,” NBC News, February 3, 2022, https://www.
nbcnews.com/politics/white-house/biden-roll-out-election-year-crime-messaging-new-york-n1288516.
34. David Cohen, “‘Defund the Police’ Is Not the Policy of the Democratic Party, Pelosi Says,” Politico, February 13, 2022,
https://www.politico.com/news/2022/02/13/pelosi-defund-police-democrats-00008449.
35. Having said this, we rejected the claim that the main problem facing the Democrats today is poor “messaging.” The real
problem lies in the substance and ideological profile of its agenda. For a clear expression of this view, see Dan Pfeiffer on
the Democratic brand: Sean Illing, “Why Good Messaging Won’t Save Democrats,” Vox, January 31, 2022, https://www.vox.
com/vox-conversations-podcast/2022/1/31/22869091/democrats-messaging-dan-pfeiffer-midterms-2022.
This week, the Progressive Policy Institute hosted an event with Rep. Jake Auchincloss (MA-04) and an esteemed panel of experts on the potential regulatory options for cryptocurrency, and the merits and drawbacks of several proposed approaches.
“My job…is to uphold market integrity, to protect consumers from fraud and abuse, and to create a regulatory sandbox in which industry can thrive. In which participants in a marketplace can transact with confidence. And in which the United States can lead the world in innovation,” said Rep. Jake Auchincloss during the event.
“I’d also like to keep this pre-partisan. Right now we haven’t yet put on the jerseys about what side is what for crypto regulation. And I think that’s healthy, because there’s no need for this to become a political football. This is something that thoughtful Members on both sides of the aisle should be able to roll up their sleeves and work together on. I’m certainly working in that fashion, and would like to see that we can get Democrats and Republicans on board with a long term regulatory architecture…” Rep. Auchincloss continued.
Cryptocurrency has taken the world by storm. Depending on the day, digital currencies are now cumulatively valued at several trillion dollars. Financial and nonfinancial corporate executives, once dismissive, increasingly understand the importance of cryptocurrency and related technologies for the future. However, the federal government is only in the early stages of deciding how to regulate cryptocurrency, which could have enormous implications going forward. PPI explored these challenges and heard from thought leaders on how to navigate this new and challenging technology.
Watch the livestream of the event here:
Representative Jake Auchincloss serves as Vice Chair on the House Committee on Financial Services and the House Committee on Transportation and Infrastructure. He has a deep background in technology and cybersecurity work.
In addition to Rep. Auchincloss, this event’s esteemed panelists included Dante Disparte, Circle’s Chief Strategy Officer and Head of Global Policy; Kirsten Wegner, CEO of the Modern Markets Initiative and a PPI Mosaic Project cohort member; and Michael Katz, Director of Legal for the Digital Currency Group. The event was moderated by Dr. Michael Mandel, Vice President and Chief Economist of PPI and featured Colin Mortimer, Director of PPI’s Center for New Liberalism.
The Progressive Policy Institute (PPI) is a catalyst for policy innovation and political reform based in Washington, D.C. Its mission is to create radically pragmatic ideas for moving America beyond ideological and partisan deadlock. Learn more about PPI by visiting progressivepolicy.org.
A new report from the Progressive Policy Institute (PPI)’s Innovation Frontier Project, calls for United States policymakers to revamp our manufacturing sector to ensure the U.S. remains a leader in the global economy.
The report, authored by Keith Belton titled “Building a Stronger (More Complex) U.S. Manufacturing Sector,” provides policy recommendations, compares complexity in exports across several countries, and dives deep into theories behind manufacturing complexity, trade and competition.
“American manufacturing is on the decline, but we have a unique opportunity to kick this vital sector into high gear by making it more complex and diverse. We can strengthen it now with pragmatic legislation and look to our international competitors for a blueprint. With Keith Belton’s smart roadmap, our next generation of manufacturers could be working in a more secure, advanced and competitive manufacturing sector,” said Jack Karsten, Managing Director of the Innovation Frontier Project at PPI.
Belton argues that there are three public policy areas in which we can leverage complexity theory, including revising the national strategic plan for manufacturing at the White House Office of Science and Technology Policy, reviewing domestic supply chains, and establishing new statutory programs to strengthen the defense industrial base.
He also points to the need for the government to drive private sector investment in more complex manufacturing, which is being considered by Congressional leadership as the House and Senate reconcile the House-passed COMPETES Act with the Senate-passed United States Innovation and Competition Act (USICA). Global examples may be a launching point for the government as we look to replicate manufacturing competitiveness expansion in the next decade.
Read the report and expanded policy recommendations here:
Based in Washington, D.C., and housed in the Progressive Policy Institute, the Innovation Frontier Project explores the role of public policy in science, technology and innovation. The project is managed by Jack Karsten. Learn more by visiting innovationfrontier.org.
The Progressive Policy Institute (PPI) is a catalyst for policy innovation and political reform based in Washington, D.C. Its mission is to create radically pragmatic ideas for moving America beyond ideological and partisan deadlock. Learn more about PPI by visiting progressivepolicy.org.
When we look back on this period, a big inflation story will be the dog that didn’t bark. While prices for traditional goods like energy, food, and autos have skyrocketed, digital economy inflation has remained almost non-existent.
This relative lack of inflation in the tech, broadband and ecommerce worlds — including ecommerce margins — is a stunning phenomenon that deserves a lot more attention than it is getting. Why are these companies holding the line on inflation when old-line industries are bingeing on double-digit price increases?
One real possibility is that innovation and investment in the digital sector may have a dampening effect on inflation. Basic economics tells us that when tech and telecom companies spend tens of billions of dollars to create new capacity and deploy new technology, it’s going to be hard for anyone to raise prices, including themselves. PPI’s Investment Heroes report from last year showed that eight out of the top 10 companies in terms of domestic capital spending — Amazon, Verizon, AT&T, Alphabet, Intel, Facebook, Microsoft and Comcast — were in the tech, ecommerce, and broadband sectors. PPI has not yet done the most recent Investment Heroes report, but it’s clear that massive spending on information technology, 5G networks, and ecommerce fulfillment centers is holding down digital prices.
Let’s take a look at the data from the January 2022 Producer Price report, released February 15. Overall, this report show relatively high inflation, with final demand prices up 9.7% over the past year, and the prices of final demand less food and energy up 8.3% (the last line of the table below).
But in the middle of this price surge, tech and telecom prices showed relative small increases or even decreases. The table below compares pre-pandemic inflation (January 2019 to January 2020) with the most recent year (January 2021 to January 2022).
We see that in the latest year, the producer price of cable and other subscription programming, internet access services, and data processing and related services are all falling. The producer price of wireless communications is basically flat (we note that the consumer price of wireless is down by -0.5% over the past year, consistent with the picture painted by the producer price data).
Margins for electronic and mail order shopping services are rising at only a 1.1% rate (we’ll discuss these further below). Prices for advertising sales by internet publishers and web search portals are rising at a 3.5% pace, only slightly faster than the pre-pandemic inflation rate of 3.4%. Relative to January 2015, prices for advertising sales by internet publishers and web search portals are down by 16.9%.*
The one major exception to the low inflation story is the producer price of computer and electronic product manufacturing, which did take a substantial jump, probably in part because of supply chain disruptions.
Tech and Telecom Producer Prices Show Very Little Inflation
(change in producer prices)
Jan19-Jan20
Jan21-Jan22
Cable and other subscription programming
2.8%
-1.8%
Internet access services
0.5%
-1.3%
Data processing and related services
3.0%
-0.3%
Wireless telecommunications carriers
0.2%
0.1%
Information technology (IT) technical support and consulting services (partial)
1.4%
0.9%
Electronic and mail-order shopping services
1.4%
1.1%
Software publishers
-0.9%
1.1%
Wired telecommunications carriers
2.4%
2.6%
Internet publishing and web search portals – advertising sales
3.4%
3.5%
Computer & electronic product mfg
1.3%
4.1%
Comparison: Final demand for goods and services less foods and energy
1.6%
8.3%
For retail industries, the BLS collects “margin” prices, which is the selling price of a good minus the acquisition price of the good. A bigger margin indicates that the retailer is either getting a higher profit, or having to cover increased costs for labor, energy, and other inputs.
The chart below shows that in the year ending January 2022, overall retail margins rose by 11.3%, a big jump over their pre-pandemic rate of 1.7%. General merchandise store margins rose by 10.3%, while the margins of motor vehicle and parts dealers rose by almost 25%.
Note that this increases could reflect the higher cost of running brick-and-mortar establishments during a pandemic, or they could reflect higher profits. But what is clear is that ecommerce margins have barely rose in the year ending January 2022.
*I looked at long-term trends in internet and print advertising prices in a 2019 paper, “The Declining Cost of Advertising: Policy Implications.”
The U.S.-Canada trade relationship is the largest in world history.
THE NUMBERS:
Top six U.S. goods + services trade partners in 2021*
* Estimates for services based on the nine months available data. Goods trade are full-year figures.
WHAT THEY MEAN:
Then-President Reagan in September of 1988, eloquently closing as he signs the U.S.-Canada Free Trade Agreement: “Let the 5,000-mile border between Canada and the United States stand as a symbol for the future. No soldier stands guard to protect it. Barbed wire does not deface it. And no invisible barrier of economic suspicion and fear will extend it. Let it forever be not a point of division but a meeting place between our great and true friends.”
A generation into this future:
(1) Canada accounts for a ninth of all U.S. goods trade and (with some uncertainty as final services data aren’t yet in) about a fifteenth of services trade. The total places Canada slightly ahead of Mexico and China as top trade partner, and thus as the largest single trade relationship in the world. Matching this against history is tricky — should one compare last year’s $740 billion in U.S.-Canada trade to the $95 trillion in world GDP? To the $20 trillion in trade flows? To something else? But in the simplest sense, counting the nominal value of paper dollars or shiny loonies, last year’s U.S.-Canada relationship was the largest two-way trade relationship ever.
(2) Canada is the top U.S. export market for 29 states, and second-ranked for another 13. Canadians buy more American goods ($308 billion in 2021) than the 27 EU countries ($272 billion) combined; or, alternatively, nearly as much as China ($150 billion) plus Japan ($75 billion) plus Korea ($66 billion) plus Hong Kong ($30 billion) plus Taiwan ($37 billion). Only the U.K. is a larger buyer of American services.
(3) President Reagan seems to have low-balled the border length a bit; by the International Border Commission’s estimate, it is 5,528 miles, including 4,000 along the “continental U.S.” northern border and 1,500 on Alaska’s western and southern frontier. Either way, as events elsewhere in the world continually remind us, a friendly, unguarded, border-cum-meeting-place, where the most troubling events are COVID-related tourism interruptions and temporary blockages of auto-parts shipments, is (a) a rarity in history, (b) something to greatly value, and (c) a heritage to protect.
FURTHER READING
Governments
Then-President Reagan signs the U.S.-Canada FTA, September 1988.
The Missoulian reports on protests, blockages, and local reactions at the Sweetgrass (MT) crossing point.
Remarks from Deputy Prime Minister Chrystia Freeland regarding the blockades and the Emergencies Act
ABOUT ED
Ed Gresser is Vice President and Director for Trade and Global Markets at PPI.
Ed returns to PPI after working for the think tank from 2001-2011. He most recently served as the Assistant U.S. Trade Representative for Trade Policy and Economics at the Office of the United States Trade Representative (USTR). In this position, he led USTR’s economic research unit from 2015-2021, and chaired the 21-agency Trade Policy Staff Committee.
Ed began his career on Capitol Hill before serving USTR as Policy Advisor to USTR Charlene Barshefsky from 1998 to 2001. He then led PPI’s Trade and Global Markets Project from 2001 to 2011. After PPI, he co-founded and directed the independent think tank ProgressiveEconomy until rejoining USTR in 2015. In 2013, the Washington International Trade Association presented him with its Lighthouse Award, awarded annually to an individual or group for significant contributions to trade policy.
Ed is the author of Freedom from Want: American Liberalism and the Global Economy (2007). He has published in a variety of journals and newspapers, and his research has been cited by leading academics and international organizations including the WTO, World Bank, and International Monetary Fund. He is a graduate of Stanford University and holds a Master’s Degree in International Affairs from Columbia Universities and a certificate from the Averell Harriman Institute for Advanced Study of the Soviet Union.
The U.S. economy is rebounding vigorously from the COVID-19 recession. That ought to be lifting the public’s spirits, but Americans instead are increasingly preoccupied by two distressing pandemic legacies — soaring prices and gun violence.
In New York City, for example, serious crimes jumped by nearly 39 percent in January, prompting civil rights leader Al Sharpton to call the situation “out of control.” President Biden traveled to Manhattan last week for a high-profile confab with newly-elected Mayor Eric Adams, who has made public safety his top priority.
It was a smart move, because Adams is just what Biden and his party need now to refurbish their credentials as credible crime fighters. He’s a pragmatic Black mayor and former police officer who has been an outspoken critic of both police brutality and racial profiling as well as the activist left’s demands to “defund the police.”
In recent years, politicians on the far left have leaned on Modern Monetary Theory (MMT) to justify offering increasingly exorbitant spending proposals without plans to pay for them. Then roughly $6 trillion in deficit-financed stimulus approved by Congress in 2020 and 2021 provided policymakers a natural experiment to evaluate the claims proponents of MMT made. The results exposed the critical flaws in their approach, and rather than being able to take a victory lap, MMT is now on its last legs.
The idea that government should use deficit spending to support an economy in crisis is not unique to MMT – economists across the political spectrum supported an aggressive fiscal response in 2020. The core tenet of MMT is that a monetarily sovereign nation, like the United States, can always simply print however much currency it needs to buy whatever goods and services programs require. This is the lens through which proponents of MMT have argued that the only constraint on deficit spending should be inflation that materializes when the economy is utilizing all available resources.
Three Census Bureau reports provoke some thoughts on the U.S.’ export economy, workers and pay, growth with and without inflation, and the next three years of policy:
(1) The “FT-900,” released Tuesday morning, is the Census’ regular monthly summary of the basic U.S. trade data, with figures on exports, imports, goods, services, countries, and so on. Tuesday’s edition covers December 2021, and is a good point for stock-taking as it covers the full year 2021, the Biden/Harris administration’s first year in office. This found U.S. exports at $2.53 billion: 2.1 million cars and $2 billion in sports and fishing equipment; 170 million cubic meters of liquefied natural gas; $59 billion in telecommunications, information, and computer services; 25 million tons of wheat; $5 billion in wine, liquors, and beer; $30 billion worth of medical devices, etc. This represents a $394 billion jump from $2.13 trillion in COVID-stricken 2020, which in one way is a very impressive pace of growth, unmatched since 2010 but in another way essentially brings exports back to the pre-COVID levels of $2.53 trillion in 2019 and $2.54 billion in 2018.
(2) The second report, out last November, is “U.S. Exporting Firms by Demographics”. This is a deep dive into the nature of the businesses that produce these things, using tax, trade, and other data for 2018 to provide a survey of the ownership, employment, payrolls, and foreign markets of 178,000* of that year’s 293,000 known U.S. exporters. Some findings:
* Exporters offer high employment and pay: Exporting businesses averaged 274 workers, at payroll per worker of $69,000. Non-exporters, by comparison, employed 14 workers on payroll at $44,000 per worker. About 16,500 exporting businesses are large, presumably publicly held forms (in Census’ terminology, “unclassifiable” by ownership type). Dropping these from the tables, U.S. exporters averaged employed 54 workers, on payroll at $64,210 per worker. The comparable figures for “unclassifiable by ownership type” non-exporters were 10 workers and $41,027 per worker. The sharpest pay premium appears to be among the 23,500 women-owned exporters: They average 38 workers at $61,000 in payroll per worker, as against 9 workers and $38,000 in women-owned non-exporting businesses.
* Diverse business ownership is a national asset: An ethnically and racially diverse business community appears to help the U.S. find customers and income abroad. As one example, about 1 in 12 U.S. exporters sell to Africa; for African American owned firms, the share is 1 in 7. A similar comparison from a different angle finds Hispanic-owned firms making up 5.5% of all U.S. exporters, but 10% of exporters to Latin America and 12% of exporters to Central America specifically.
(3) Finally, “Profile of U.S. Importing and Exporting Companies,” also from this past November (though in “preliminary” form, pending a final count in April) counts the total number of exporting businesses as of early 2020. It glumly reports 270,000 such firms, about 35,000 below the peak count of 305,000 in 2013/2014, and 23,000 below the 293,000 reported for 2016 and 2018. Mirroring this decline in numbers, the export sector’s place in the U.S. economy has diminished in recent years, falling as a share of GDP from a 13.5% peak in 2013 and 2014 to 11.8% in 2018, and then 10.3% of GDP in 2020 — the lowest level since 2006.
Against this long-term backdrop, the big jump in yesterday’s FT-900 is good news, but still leaves the U.S. exporting well short of the role it held five or 10 years ago.
What explains the erosion? And will it last? One obvious but presumably transient contributor is the impact of COVID-related economic closures (especially in the first half of 2020). These affected almost all exporting sectors, and are still powerful in “transport” and “travel” services, whose exports remain far below pre-COVID levels. Another is recent policy choices: Trump-era tariffs provoked direct retaliations against U.S. exporters, and may also, by raising the cost of parts and materials for American manufacturers and farmers, be contributing to a slower erosion of export competitiveness. Beyond this, and not yet felt, implementation of the Asia-based “Regional Closer Economic Partnership” — a 15-country Asia-Pacific trade agreement joining China, Japan, Korea, Australia, New Zealand, and the 10 ASEAN members, together accounting for about a third of all world imports outside the U.S. — presages a Pacific tariff tilt in favor of the cars, wines, fishing rods, wheat, etc. produced by U.S. competitors.
In sum, Census numbers say many good things about the U.S. export economy in 2021. And they suggest some ways for exporters might contribute more to both workers and macroeconomic health in the next few years. But they also offer grounds for concern, and reasons for energetic policy.
Note: PPI Trade and Global Markets staff thank Census staff for helping with interpretation of several of these releases, and more generally for their sustained excellence in statistical work in trade and other areas.
FURTHER READING
From Census
The “FT-900” series has the basic monthly trade figures, updated Tuesday for full-year 2021.
… and the accompanying “Historical Series” has a convenient one-page annual summary of imports, exports and balances from 1960 through 2021.
And “U.S. Exporting Firms by Demographics” looks deeply into 178,000 of 2018’s 293,000 exporting businesses* by owner type: male/female; race and ethnicity (with white, African American, Hispanic, Asian American, Native American, and Pacific Islander); veteran ownership; and 200 export markets ranging in scale from “Vanuatu” and to “Africa” to “EU-27” and “All Countries.” Available with data for 2018, 2017, 2012, and 2007.
* The 115,000 whose ownership couldn’t be accounted for include non-employing firms, agricultural producers, and businesses located in Puerto Rico and the U.S. insular territories.
Also on exporters, from two of Census’ sister Commerce Department agencies
Writing for the Minority Business Development Agency in 2015, Sharon Freeman reviews export opportunities and challenges for African American, Hispanic, Asian American, and Native American small businesses.
And the International Trade Administration summarizes research on the count and nature of “jobs supported by exports.”
Ed Gresser is Vice President and Director for Trade and Global Markets at PPI.
Ed returns to PPI after working for the think tank from 2001-2011. He most recently served as the Assistant U.S. Trade Representative for Trade Policy and Economics at the Office of the United States Trade Representative (USTR). In this position, he led USTR’s economic research unit from 2015-2021, and chaired the 21-agency Trade Policy Staff Committee.
Ed began his career on Capitol Hill before serving USTR as Policy Advisor to USTR Charlene Barshefsky from 1998 to 2001. He then led PPI’s Trade and Global Markets Project from 2001 to 2011. After PPI, he co-founded and directed the independent think tank ProgressiveEconomy until rejoining USTR in 2015. In 2013, the Washington International Trade Association presented him with its Lighthouse Award, awarded annually to an individual or group for significant contributions to trade policy.
Ed is the author of Freedom from Want: American Liberalism and the Global Economy (2007). He has published in a variety of journals and newspapers, and his research has been cited by leading academics and international organizations including the WTO, World Bank, and International Monetary Fund. He is a graduate of Stanford University and holds a Master’s Degree in International Affairs from Columbia Universities and a certificate from the Averell Harriman Institute for Advanced Study of the Soviet Union.
The Surface Transportation Board (STB) has resurrected a 2016 regulation on “reciprocal switching” that would require railroads to “unbundle” their transportation services and provide competitors with access to their infrastructure, at regulator-determined prices and service requirements. There are plenty of problems with this proposed regulation, including discouraging private sector investment and increasing operational problems. In this note, however, we will focus on the broader question of why forced unbundling of railroad transportation services is precisely the wrong regulatory strategy for today’s “Supply Chain Economy,” leading to the potential worsening of supply chain disruptions and an increase in inflation.
To understand why a 2016-vintage regulatory approach is totally wrong for the 2022 economy, we must first consider the underlying economics of supply chains. A supply chain consists of a flow of goods, of course, from producers to buyers and consumers, via transportation links such as railroads, container ships, airlines and truckers, and intermediaries such as importers and wholesalers. But equally important is the flow of data which allows all of this production and movement to be coordinated.
As I note in a forthcoming article in the Winter 2022 issue of The International Economy, it is better to think of a supply chain as a “supply-and-data chain.” In that spirit, supply-chain management has been defined by the Association of Supply Chain Management as the “design, planning, execution, control, and monitoring of supply-chain activities with the objective of creating net value, building a competitive infrastructure, leveraging worldwide logistics, synchronizing supply with demand and measuring performance globally.”
Today’s domestic and global economies are built around these “supply-and-data chains.” A retailer like Walmart uses its knowledge of expected U.S. consumer demand to place orders with factories around the world months ahead of when the goods are needed, and then coordinates the movements of these goods to its far-flung stores. At every point along the way, the goal is to use data to reduce costs and ensure a smooth flow of goods.
This “Supply Chain Economy” is very different than the classic picture of an economy consisting of a series of unbundled arms-length transactions. In an economy with forced unbundling, factories would have to commit themselves to production runs without knowing if the demand existed, and without knowing if the transportation capacity was available.
In a supply chain economy, companies compete on the basis of who can best use data to organize production and logistics across the global economy, lowering costs and increasing reliability. The key is to take a big picture view across a wide range of markets, rather than focusing on competition in individual markets.
From this perspective, forced “reciprocal switching” would divert resources away from the optimization of supply chains. Railroads would have to give a high priority to moving goods in a way that met the reciprocal switching requirements, rather than lowering costs and speeding goods to their ultimate customers. The result would be more supply chain disruptions, and higher inflation. That’s not an outcome that anyone wants right now.