Washington, D.C. — Today, Ed Gresser, Vice President and Director for Trade and Global Markets at the Progressive Policy Institute (PPI), testified to the Office of the U.S. Trade Representative (USTR) and interagency trade officials on supply-chain issues. Gresser is formerly the Assistant U.S. Trade Representative for Trade Policy and Economics at USTR.
The hearing, announced in a March Federal Register Notice (FRN), solicited public comment on policy options to ensure the “resilience” of U.S. supply chains. In his testimony, Gresser applauds the agencies for thinking systematically about the way trade and investment policy mesh with logistics and production choices, and agrees that over-concentration of sourcing from single countries — especially those in regions at high geopolitical risk — or small numbers of suppliers creates systemic risk.
Balancing this, Gresser notes that efficient supply chains offer significant benefits too — for example, speeding the development, production, and global delivery of COVID-19 vaccines in 2021 — and a future policy needs to take this into account. He also delivers a constructive critique of some of the premises in the FRN, arguing that: (a) policy should not downgrade the priority of efficiency, which is important to U.S. competitiveness and also helps keep the price of goods affordable; (b) should see high labor and environmental standards as advantages rather than disadvantages; and (c) questioning some overly negative assessments of past trade policies.
Additionally, Gresser responds to several of USTR’s FRN questions about the policy options open to U.S. officials seeking ways to improve supply-chain resilience. Here he makes some suggestions about new types of data the government would need, and suggests thinking about two “buckets” of policy options: one which offers incentives and cost savings through Free Trade Agreements (FTAs), tariff preferences, and eased border inspections; a second which uses disincentives such as import bans and higher tariff rates. Gresser concludes — while the second is sometimes necessary — the first approach is almost always preferable since disincentives can deter U.S. competitiveness due to higher costs.
You can read Gresser’s full testimony here and you can watch the full hearing, including Gresser’s testimony here.
The Progressive Policy Institute (PPI) is a catalyst for policy innovation and political reform based in Washington, D.C. Its mission is to create radically pragmatic ideas for moving America beyond ideological and partisan deadlock. Learn more about PPI by visiting progressivepolicy.org. Find an expert at PPI and follow us on Twitter.
###
Media Contact: Tommy Kaelin – tkaelin@ppionline.org
The following is testimony submitted by Edward Gresser, on behalf of the Progressive Policy Institute, at a public hearing convened by the Office of the U.S. Trade Representative on May 2, 2024. The hearing is meant to help inform USTR and other agencies with trade responsibilities working with the White House Council on Supply Chain Resilience, formed in November 2023, to oversee efforts to reduce risk in U.S. supply chains for semiconductors, critical minerals, medical goods, and other products.
Thank you very much for this opportunity to testify this morning, as the U.S. Trade Representative Office and other agencies consider supply chains, their implications for the U.S. economy, and associated policy. By way of introduction, I am Vice President of the Progressive Policy Institute (PPI) in Washington, D.C., a 501(c)(3) nonprofit research institution established in 1989, which publishes a wide range of public policy topics. Before joining PPI, I served at USTR from 2015 to 2021 as Assistant U.S. Trade Representative for Trade Policy and Economics, with responsibility for overseeing USTR’s economic research and use of trade data, interagency policy coordination including chairing the interagency Trade Policy Staff Committee, and administration of the Generalized System of Preferences.
I applaud the agency for thinking systemically about the way trade and investment policy mesh with logistics and production choices, and the way both public and private-sector decisions might affect the security of U.S. industry in unexpected shocks. And I share the view implicit in the March 7 Federal Register Notice (FRN) which announced this hearing, that recent experience, including the COVID-19 pandemic, offers important perspective on the topic. My testimony will offer some general thoughts on these matters (from the point of view of a policy analyst and former government official rather than someone professionally involved in supply chain design or management), and share views on questions 8, 9, and 11 of the FRN on business sourcing choices, ‘rules of origin’ in free trade agreements, and data that might help inform policymaking.
FACT: 38 of the world’s 100 tallest buildings have opened since 2019.
THE NUMBERS: U.S.’ share of the world’s 100 tallest buildings –
2024
14
2020
14
2010
29
2000
47
1990
87
1950
91
1900
38
WHAT THEY MEAN:
An early architecture critic, the Venerable Rodolf Glaber of the Dijon Abbey, looks back from somewhere around the year 1040 to Europe’s turn-of-the-millennium cathedral boom:
“It was as though the world had shaken herself and cast off her old age, and clothed herself everywhere in a white garment of churches…”
Then this year: Merdeka 118, the pride of Kuala Lumpur, opened January 24 as the world’s second-tallest building and fourth officially “mega-tall”* skyscraper. At 2,233 feet or 681 meters, and overtopped only by Dubai’s 2,787 foot/870 meters Burj Khalifa, M-118 is the most recent in Asia’s newly built ‘steel-and-glass garment’ of tall buildings. To be precise, the New York-based Council on Tall Buildings and Urban Habitat reports that of the world’s 100 tallest buildings, 35 have opened since 2019, and 62 of the top 100 since 2014. Using computer-aided design and new alloys developed in the last generation — twisting facades to minimize wind torque, lightweight alloy cladding to resist heat, and so forth — they have metaphorically put the American skyline a bit in the shade.
U.S. urban skyscrapers using steel-girder-and-curtain-wall technology surpassed Glaber’s stone-on-stone cathedrals as the tallest buildings in the 1920s. As recently as 1990 the U.S. was home to 9 of the world’s top 10 buildings, and 87 of its top 100. The current count is about half Chinese, with the United Arab Emirates and the U.S. a tier down, and eight other mostly East and Southeast Asian countries making up the rest. A rundown of the Council’s current 100-highest list looks like this:
(1) 46 in mainland China, including five of the top ten. The Shanghai Tower (2015, 2073 feet) joins M-118, Burj Khalifa, and the Makkah Clock Tower in Riyadh as one of four officially-recognized “megatalls” (above 1,968 feet); the 5th-ranked Ping An Tower in Shenzhen (2017) just misses at 1,965 feet. Five more of the top 100 are in Hong Kong.
(2) 15 in the United Arab Emirates, including top-ranked Burj Kh., with fourteen in Dubai City. Dubai for the past twenty years has held a lead over New York as the city with the highest ultra-tall count.
(3) 14 in the United States. Eight are in New York, with One World Trade Center seventh in the world at 1,776 feet. The Empire State Building, open since 1931 and by far the oldest building in the top 100, ranks 53rd. Chicago has five, and Philadelphia has one, the 95th-place Comcast Tower. No other U.S. city has a top-100 building. (LA’s Wilshire Grand ranked 88th when it opened in 2017, but has already dropped to 104th.) By way of comparison, in 1990 17 U.S. cities had at least one of the world’s top 100 buildings, and New York alone had 23.
(4) 20 elsewhere: Five in Malaysia, another five in Russia, three in Korea, two apiece in Taiwan and Saudi Arabia, one each in Vietnam, Kuwait, and Indonesia.
By way of consolation, though the American skyline may no longer tower over its rivals, the U.S. intellectual role in skyscraper design and construction remains very big. Ultra-tall buildings are highly “globalized” efforts; the builders of Merdeka-118, for example, turned to New York-based LERA (Leslie E. Robertson Associates) to oversee its structural engineering, while U.S. firms Fisher Marantz Stone, Barker Mohandas, and CPP handled vertical transport, lighting systems, and wind stress design. (As well as Samsung’s construction wing for the building contract, Australian and Hong Kong architects, and a Finnish elevator company.) Overall, specialized U.S. architecture and engineering firms in Chicago, New York, New England, and California designed or co-designed nine of the ten buildings at the top of the current top 100 list, and five of the ten tallest openings in 2022 and 2023.
FURTHER READING
New York’s Council on Tall Building and Urban Habitat lists the world’s 100 tallest buildings in 2024, 2020, 2010, 2000, 1990, and 1980. The 2025 list, assuming buildings now in the final-construction stage open as planned, will bring on 11 new ones of 1,145 feet and up, and by necessity drop numbers 90-100 off. On net this means China’s share will rise from 46 to 47. Dubai will also get another, and Cairo and Istanbul will join. The U.S., Korea, Malaysia, and Russia will lose one each.
… Samsung Construction explains the concrete — 400,000 tons of it, enough to “cover a football field to a height of 19 stories in one solid block,” and braced by 40,000 km of rebar.
… and structural engineering lead Leslie E. Robertson Associates summarizes design.
Burj Khalifa features 160 floors, a spiral shape to minimize upper-story wind torque, specialized glass, and heat-resistant glazed aluminum/stainless steel cladding on the outer walls.
And the current ‘ultimate project’ – LERA, in partnership with Chicago-based Kohn Pederson Fox, has the most ambitious proposal of all: a 5,700-foot “Sky Mile Tower” in Tokyo, twice as high as Burj Khalifa and burying every conceivable competitor. The “vision” outline of the Sky Mile Tower.
A brief survey of tall-building record-holders and techniques:
Here’s a list of the world’s tallest buildings and their opening dates (or best estimates) if there isn’t a precise one available:
2010:
2,716 feet (Burj Khalifa, UAE)
2004:
1,666 feet (Taipei 101, Taipei)
1998:
1,482 feet (Petronas Towers, Kuala Lumpur)
1974:
1,450 feet (Sears Tower, Chicago)
1972:
1,368 feet (World Trade Center, New York)
1931:
1,250 feet (Empire State Building, New York)
1930:
1,046 feet (Chrysler Building, New York)
1913:
792 feet (Woolworth Building, New York)
1908:
612 feet (Singer Building, New York)
1901:
548 feet (City Hall, Philadelphia)
1311:
525 feet** (Lincoln Cathedral, UK)
~2550 BC:
481 feet (Great Pyramid, Egypt)
* Not counting free-standing towers like the 555-foot Washington Monument (1884) or the 986-foot Eiffel Tower (1889).
** Estimated including the original spire, which fell down in 1548.
Pyramids & Ziggurats: The 481-foot Great Pyramid outside Cairo held the world’s tallest record for 3,800 years. Not just a lame pile of rocks, the G.P. is a “smart pyramid” with a complex interior network of chambers, tunnels, and ventilation shafts meant for practical, religious, and perhaps astronomical purposes, all pointing to sophisticated though unrecorded architectural drafting and engineering techniques. The slightly younger ziggurats in neighboring Sumer and Akkad were made of brick, a squishier material which meant they couldn’t be as tall, and topped out around 170 feet. The Great Pyramid
Cathedrals: Designed without printing presses, standardized weights and measures, or mathematics beyond flat-plane geometry, cathedrals overtook pyramids in the 14th century. As of 1900 they still made up all of the world’s top 20; and except for Philadelphia’s 548-foot City Hall (1901) they remain today the world’s tallest stone-on-stone buildings. Glaber on the 1000-AD cathedral boom.
… and the Ulm Munster, tallest existing cathedral.
Skyscrapers: Stone buildings can’t get much above 500 feet, since the weight of the upper tiers will crack the load-bearing pillars and walls beneath. Steel-skeleton buildings with curtain walls designed in Chicago and New York solved the problem. Meanwhile, the Otis hydraulic elevator system settled the 50-story-climb-to-the-top challenge, and architects set aside a few floors for water pumps so penthouse suites and executive offices could get toilets that flush and faucets that spout water rather than sucking air. Here’s the Empire State Building looking ahead to its 2031 centennial.
ABOUT ED
Ed Gresser is Vice President and Director for Trade and Global Markets at PPI.
Ed returns to PPI after working for the think tank from 2001-2011. He most recently served as the Assistant U.S. Trade Representative for Trade Policy and Economics at the Office of the United States Trade Representative (USTR). In this position, he led USTR’s economic research unit from 2015-2021, and chaired the 21-agency Trade Policy Staff Committee.
Ed began his career on Capitol Hill before serving USTR as Policy Advisor to USTR Charlene Barshefsky from 1998 to 2001. He then led PPI’s Trade and Global Markets Project from 2001 to 2011. After PPI, he co-founded and directed the independent think tank ProgressiveEconomy until rejoining USTR in 2015. In 2013, the Washington International Trade Association presented him with its Lighthouse Award, awarded annually to an individual or group for significant contributions to trade policy.
Ed is the author of Freedom from Want: American Liberalism and the Global Economy (2007). He has published in a variety of journals and newspapers, and his research has been cited by leading academics and international organizations including the WTO, World Bank, and International Monetary Fund. He is a graduate of Stanford University and holds a Master’s Degree in International Affairs from Columbia Universities and a certificate from the Averell Harriman Institute for Advanced Study of the Soviet Union.
KYIV — I was elated on Saturday night as I watched the House of Representatives wrap up its vote on a $61 billion aid package for Ukraine.
Even six months after President Biden proposed the increased aid, bringing the bill up for a vote took historic courage and leadership from House Speaker Mike Johnson, who could still lose his job for defying the will of the majority of House Republicans who oppose aid.
But here in Ukraine, the reaction has been surprisingly muted.
The weaponry likely to flow in coming weeks will be essential on the battlefield and in cities across the country, where Russian air attacks have intensified sharply in recent weeks.
It should start to stabilize the front in eastern and southern Ukraine, where Moscow is currently poised to break through, and help Ukrainians shore up their defenses in anticipation of the Russian thrust that many expect in coming months as spring sunshine hardens the muddy ground between the two armies.
What the package is unlikely to do is enable Kyiv to go on the offensive, turning the tide of the war and positioning Ukraine to win.
U.S. Steel (USS) is a 123 year-old American company, founded by J.P. Morgan at the turn of the 20th century. As with any centenarian company, USS has seen a lot, navigating changes in demand for steel, the globalization of steel markets, the “greening” of the steel industry, and antitrust troubles. Between 2008 and 2022, USS slid from 8th largest to 24th largest steel producer in the world.
Today, USS finds itself at the center of an unwelcome debate. In late 2023, Nippon Steel made a bid for the company, a deal that would combine the largest Japanese steel producer with the 3rd largest U.S. steelmaker. The bid outmatched a competing offer by the recently assembled conglomerate Cleveland-Cliffs, a mining company turned metals producer that in 2020 emerged as one of the largest American steelmakers after buying up most of the U.S. assets of Arcelor-Mittal.
Senator Bill Dodd, D-Napa, bills himself a moderate with pragmatic priorities. So, it’s puzzling that he’d introduce Senate Bill 1380. SB 1380 would authorize school district boards to deny charter school applications if it had closed a school within the past five years. It would also gut county education boards’ authority to overrule the local board’s denial.
Elected school board members are politicians. They can be beholden to political donors, and sometimes donors’ priorities don’t align with families’ need for better public school options. Taking away oversight over school boards’ decision-making would grant them excessive power.
Dodd’s rationale is the misguided notion that when parents enroll their child in a public charter school, they drain school districts of funding. But charter schools are public schools: free and open to all. They are part of California’s public school system; they simply operate independently of district bureaucracies.
In Ukraine, the fickle fortunes of war have turned in Russia’s favor. The invaders have seized the military initiative, while a Trumpified Republican Party has thrown in doubt both America’s commitment to a free Ukraine and our will to confront a new Russian imperialism.
For the moment, however, GOP House Speaker Mike Johnson (R-La.) has managed to unsnag more than $60 billion in long-stalled U.S. military aid that Ukraine desperately needs to defend itself against a Russian summer offensive.
Russian Foreign Minister Sergei Lavrovrecently confirmed Moscow’s plan to seize Kharkiv, Ukraine’s second-largest city. Exploiting their advantages in manpower and missiles, willingness to take casualties and Ukraine’s dire shortage of artillery shells, Russian forces lately have madesignificant if costly advances near Bakhmut, Avdiivka and Donetsk City.
Although I’m loathe to praise any2020 election denier, Speaker Johnson acted patriotically, if belatedly, in bringing the aid package to the House floor and passing it with Democratic help.
The Biden administration’s antitrust enforcers are newly focused on policing monopolies under Section 2 of the Sherman Act, a historically under-enforced area of antitrust law. The United States Department of Justice (DOJ) and Federal Trade Commission (FTC) have brought a number of cases against the large digital technology companies. With antitrust in the news, there is growing public awareness of enforcement decisions about which monopolies are pursued, and which are not.
For example, public sentiment is that antitrust cases are also needed to address high impact “paycheck and pocketbook” issues for consumers and workers. These cases would correct serious market power problems in food, healthcare, and manufacturing that hit consumers and workers hard, through higher prices and lower wages, and a lack of choice. Given the consumer-facing nature of the live events markets, a rumored DOJ monopolization case against Live Nation-Ticketmaster is likely to generate deep public interest and support.
The 2010 merger between Live Nation and Ticketmaster vertically integrated the former’s concert promotion and venue operation services with the latter’s ticketing and artist management services. At the time, Ticketmaster, controlled a whopping 80% of the ticketing market. With this dominance in ticketing, the merger supercharged Live Nation-Ticketmaster’s incentives to stifle competition from smaller rivals, to the detriment of fans and artists.
FACT: U.S. economic growth greater than China and the EU combined this year.
THE NUMBERS: U.S. share of world GDP* –
2024:
26.3%
2020:
25.0%
1980:
25.5%
IMF World Economic Outlook 2024, currency basis
WHAT THEY MEAN:
Two ways to count and divide “all the money in the world”:
One way is to ask: How much money do people make? And where are they making it? The International Monetary Fund’s beloved “World Economic Outlook” database, updated for 2024 last Thursday, reports that “World GDP”, having cleared the $100 trillion mark in 2022, hit $104.79 trillion in 2023 and will likely reach $109.53 trillion this year. (GDP on “currency basis”; see below for an asterisk and the alternative approach.) The WEO is particularly upbeat on the United States, noting that “the U.S. economy has already surged past its pre-pandemic trend” and continues to outpace its peers with a GDP jump from last year’s $27.4 trillion to $28.8 trillion. The U.S.’ projected $1.4 trillion nearly equals the $0.87 trillion the IMF’s forecasters project for China and the $0.67 trillion for the European Union combined. To put this in less abstract terms, the $1.4 trillion in growth roughly equals (a) the total national output in the Spain/Saudi Arabia/Indonesia tier; or (b) the combined output of the six New England states, from the 1000 biotech firms and the 350 universities through Red Sox/Celtics/Bruins/Patriots merch, lobsters and maple syrup, Freedom Trail and foliage tour receipts, etc.. A table of the IMF’s growth forecasts for 2024:
World Growth 2024:
+$4.74 trillion
United States:
+$1.42 trillion
China:
+$0.87 trillion
European Union:
+$0.65 trillion
Latin America:
+$0.43 trillion
India:
+$0.36 trillion
ASEAN:
+$0.29 trillion
All else:
+$0.62 trillion
Assuming the IMF’s projections are pretty close to reality, this leave with U.S. with 26% of world output – up a point from the 25% share in 2020, and essentially the same as their 25.5% calculation for 1980. (Though still below the 30% reached at the peak of the 1990s boom.) So, lots of changes this year and over time; but the various ups and downs of the last two generations seem to have left a division of output and income more stable than many might guess.
A second approach would be to ask: How much money have they got? Credit Suisse, in its most recent “Global Wealth Report” (out last summer, with estimates for the year 2022) thinks there’s about $454 trillion in privately held “wealth” — that is, real estate, stocks, CDs, jewelry, cars, bank accounts, coins and bills, and so on — in the world. About $140 trillion, or 31% of the total, is in the United States. By comparison, their 2012 report guessed at $241 trillion in world wealth, with $72 trillion or a basically equal 30% in the United States. As with GDP, though Credit Suisse’s reports begin only in 2010, the U.S.’ share looks pretty stable over time, while (as with GDP) the European and Japanese shares have drifted a bit down, and those of China and India up.
FURTHER READING
The IMF’s World Economic Outlook 2024 on global growth, pandemic recovery, risks, and more.
… and has some advice from IMF economists, trying their best to rain at least a little on the U.S.’ parade:
The strong recent performance of the United States reflects robust productivity and employment growth, but also strong demand in an economy that remains overheated. This calls for a cautious and gradual approach to easing by the Federal Reserve. The fiscal stance, out of line with long-term fiscal sustainability, is of particular concern. It raises short-term risks to the disinflation process, as well as longer-term fiscal and financial stability risks for the global economy.
And the promised *asterisk*: GDP measurements come in two versions. The “currency basis” method used above, which compares and adds up GDP based on value in U.S. dollars. The alternative, “purchasing-power parities”, tries to figure the size of economies by assuming comparable prices for comparable goods and local services.
The currency-basis method makes the U.S. look a bit unreasonably strong, as the past year’s rising dollar magnifies the apparent U.S.’ growth relative to other countries. Extreme cases include Japan and sub-Saharan Africa, where declines in currency value vis-à-vis the dollar produce supposed GDP “declines” of $100 billion in Japan and $34 billion in sub-Saharan Africa. In reality, the IMF guesses Japan’s economy will grow by 0.9%, and Africa’s by 3.8%. Using “purchasing-power parities” yields a less dramatic picture, in which Japan gets $210 billion in growth and Africa $340 billion, and the U.S.’ $1.4 trillion makes up a sixth of all world growth rather than a third. Still a good year though.
U.S. government perspectives:
Treasury Secretary Janet Yellen on the economic outlook at home and worldwide.
… and also from CEA, the annual big-pictureEconomic Report of the President.
More from the WEO:
Some good news: IMF has Ukraine’s economy growing at 3.2%, after 5% in 2023, with Ukraine’s strategic defeat of Russia’s Black Sea fleet reopening grain and manufacturing trade. The view from Kyiv.
Growth rates by country: The WEO’s growth estimate spectrum, from the four hottest economies to the four most troubled, has Guyana’s energy-driven 34% growth at the top, followed by Palau’s 12.4%, Niger’s 10.4%, and Senegal’s 8.3%; at the less happy pole are Kuwait’s -1.4%, Argentina’s -2.8%, Haiti’s -3.0%, and Sudan’s -4.2%.
Largest economies: The world’s ten largest economies (currency basis) are the U.S. at $28.8 trillion, China at $18.5 trillion, Germany $4.6 trillion, Japan $4.1 trillion, India $3.9 trillion, the U.K. $3.5 trillion, France $3.3 trillion, Brazil and Italy $2.3 trillion each, and Canada $2.2 trillion. Together they sum to $73 trillion, about two-thirds of world GDP. Among this group, India has the fastest-growing economy tiara at 6.8%, with China second at 4.7% and the U.S. third at 2.7%.
And how much is “all the money in the world”?:
Credit Suisse’s privately held “wealth” count doesn’t include the wealth held by governments — navies, buildings, national parks and public lands, state-owned enterprises, and so on. No estimate for this seems to exist, but the World Bank says the public-sector share of GDP worldwide is about 16.5%. This suggests a private-sector-wealth-to-private-sector-GDP ratio of about 5.2 to 1. If the public sector ratio is similar, world “wealth” would be somewhere around $550 trillion. If it’s larger, total wealth might be in sight of the $1 quadrillion mark. Credit Suisse counts wealth.
Or, how much actual cash is hanging around? The Federal Reserve reports about $2.25 trillion in U.S. paper cash, about a third of the $6.5 trillion in worldwide bills and coins reported by the Bank of International Settlements. The “M2” “broad money” total, including bank accounts and CDs, is more like $21 trillion in the U.S., and based on the World Bank’s calculation of about 143% of world GDP, would be about $150 trillion worldwide. The Federal Reserve counts dollar bills.
… the World Bank matches cash and bank accounts against GDP.
Ed Gresser is Vice President and Director for Trade and Global Markets at PPI.
Ed returns to PPI after working for the think tank from 2001-2011. He most recently served as the Assistant U.S. Trade Representative for Trade Policy and Economics at the Office of the United States Trade Representative (USTR). In this position, he led USTR’s economic research unit from 2015-2021, and chaired the 21-agency Trade Policy Staff Committee.
Ed began his career on Capitol Hill before serving USTR as Policy Advisor to USTR Charlene Barshefsky from 1998 to 2001. He then led PPI’s Trade and Global Markets Project from 2001 to 2011. After PPI, he co-founded and directed the independent think tank ProgressiveEconomy until rejoining USTR in 2015. In 2013, the Washington International Trade Association presented him with its Lighthouse Award, awarded annually to an individual or group for significant contributions to trade policy.
Ed is the author of Freedom from Want: American Liberalism and the Global Economy (2007). He has published in a variety of journals and newspapers, and his research has been cited by leading academics and international organizations including the WTO, World Bank, and International Monetary Fund. He is a graduate of Stanford University and holds a Master’s Degree in International Affairs from Columbia Universities and a certificate from the Averell Harriman Institute for Advanced Study of the Soviet Union.
The West has been speculating about the size of Vladimir Putin’s appetite since Russian troops began massing on the Ukrainian border in early 2022, with many predicting even then that the war would spill over into Central Europe. But the situation on the ground has changed in recent months. “It’s one thing to speculate and make plans in theory,” a Polish government official told our group. “It’s very different when you’re actually facing a threat.” Now, more than two years into the war, with Russia poised to break through in Ukraine and international support for Kyiv flagging, many in Poland are actively preparing for war.
Poland’s predicament starts with its all-too-familiar geography. An overwhelmingly Catholic nation of 41 million people, it sits at a bloody crossroads—what a member of parliament called “our cursed position on the map of Europe between Russia and Germany.” Much of Poland, he reminded us, including Warsaw, was part of Russia from 1795 until 1918, and the Soviet Union dominated it for most of the second half of the 20th century. Poles and Ukrainians have often found themselves on the same side of history. But the relationship fragmented during and after World War II, when ethnic tensions erupted in the massacre of some 100,000 Poles and communist authorities moved more than a million Poles and Ukrainians from one side of the border to the other.
After Putin invaded Ukraine, Poland emerged as one of Kyiv’s best friends in Europe. In the first months of the war, it welcomed over 3.5 million refugees, and hundreds of thousands of Polish families took Ukrainians into their homes. Polish President Andrzej Duda was among the first foreign leaders to visit wartime Kyiv. Warsaw began sending materiel to Ukraine—first tanks, then helicopters and fighter jets taken directly from its own active-duty units.
February marked the one-year anniversary of the Norfolk South train derailment in East Palestine, Ohio. Residents, driven out by a controlled burn of spilled chemicals, have mostly returned to their homes, and the town is working towards a return to normalcy. Norfolk Southern just settled a class-action lawsuit for $600 million without admitting liability, and no deaths or injuries were reported in the crash itself. Nevertheless, the long-term health and environmental impacts of the controlled burn remain to be seen.
Now, the freight rail industry faces several different regulatory pressures, including an understandable call for safety improvements such as increasing the number of trackside sensors. These devices span the rail network because of voluntary industry action, but some policymakers have proposed stricter regulations that would require more sensors to be installed.
Along with these safety-oriented proposals, however, has come a drive towards increased economic regulations that would impose additional costs and controls on railroads and reduce incentives for investment. Remarks from Surface Transportation Board (STB) chairman Martin Oberman and proposed legislation like the Reliable Rail Service Act are part of a broader push to redefine railroads’ obligations as common carriers, which dictate certain obligations for service quality, frequency, and pricing.
Railroads’ common carrier status has been a critical factor in the development, structure, and operations of the industry since it was first defined in the late 19th century, and changes to the economic and regulatory burden that railroads face could substantially alter the competitive balance of the market as it stands today. Though the push for a redefinition of common carrier status was underway prior to the derailment in East Palestine, these efforts have accelerated in its wake, with stakeholders in favor of these stricter service obligations (like shippers) seizing on the public’s anger towards railroads’ safety practices to further advocate for the changes.
In addition, California is putting pressure on the industry to quickly reduce emissions from diesel locomotives and pursue “zero emission technology.” Paradoxically, implementing these economic and environmental regulations could make it more difficult for the railroad industry to afford the new safety equipment while risking increased emissions if shippers opt for truck transportation instead, which is currently less environmentally efficient. Increasing technological capabilities, along with lowering sensor costs to make data collection, monitoring, and analysis more accessible, represent a meaningful path forward to safer and smarter rail transportation.
The Freight Rail and Trucking Industries
A backbone of American shipping and logistics, the American freight rail system is one of the most robust in the world. Following the partial deregulation of the industry with the 1980 Staggers Rail Act, the industry has grown to be an essential method of freight transportation. In 2023, freight railroads transported shipments valued at $403 billion, and six railroads (including Norfolk Southern) were classified as Class I, indicating annual revenue of more than approximately $500 million.
Productivity has also risen in recent years, outpacing freight trucking, the industry’s primary competitor (and customer). According to the Bureau of Labor Statistics, labor productivity increased by 15.9% between 2019 and 2022 for the rail transportation industry, while productivity in truck transportation increased by only 4%. Producer prices have also risen more slowly in the rail industry, rising only 17.1% between 2019 and 2023 compared to the trucking industry’s 27.8% increase during the same period.
Unlike airlines or road transportation, railroads own and maintain the tracks and infrastructure to support their network, incurring significant capital costs in doing so. With an average of $23 billion spent annually on capital expenditures and maintenance by Class I railroads, the industry has made significant strides in safety in the past two decades. As the Association of American Railroads highlighted in a recent press release, Federal Railroad Administration (FRA) data indicates that since 2000, per carload hazmat accident rates have fallen 75% to their all-time low; Class I railroads’ mainline accident rate is down 42%; and derailment rates have dropped nearly 30% for all railroads through 2023.
Though the NTSB is not set to rule officially on the final cause of the February 2022 East Palestine derailment until June, preliminary reports on the crash have noted the failure of an overheated wheel bearing and its detection using a hot bearing detector (HBD). HBDs, which are sensors placed along tracks to detect, report, and alert operators of overheating components, have grown in popularity and adoption in recent years. In East Palestine, HBDs successfully detected and notified the train’s operators of an overheating bearing, but while attempting to stop the train to survey the issue, the component failed entirely, and the train derailed. Under current regulation, both the HBDs and train operators functioned and acted as intended, but the approximately 20-mile distance between the sensors meant that the bearing’s temperature of 253 degrees above ambient — well above the alert threshold of 170 degrees — was not detected until it was too late.
Hot bearing detectors are widely acknowledged as an important train safety measure. Today, HBDs are in use across the network, but in some places the gaps between sensors exceed the optimal distance of 15 miles that a 2017 study concluded provided maximum safety benefits. The Federal Railroad Administration, which enforces rail safety regulations, issued and later amended a safety advisory calling for reviewing and expanding HBD systems and their associated policies to better detect and prevent similar accidents moving forward.
Railroads have also voluntarily taken steps to improve railroad safety. The Association of American Railroads, representing all Class I railroads, announced in the wake of the East Palestine derailment that approximately 1,000 new HBDs would be installed across the country to close existing gaps in the rail network. Once installed, these sensors will ensure that the gaps between sensors are no more than 15 miles. These improvements, along with lowered action temperature thresholds and improved data reporting and sharing, represent meaningful investments in improving railway safety in the United States.
This issue shows the crucial link between safety and technology. Promising advanced technologies, like vibration detectors, can proactively monitor component integrity with greater accuracy and detail than HBDs, which detect failures once they occur. However, these vibration detectors remain extremely limited in their adoption because of their prohibitive costs. Improvements in technology, manufacturing, and production at scale could make these advanced sensors more financially accessible to railroads. As regulatory reports and guidance in the wake of the East Palestine derailment concluded, improving both data collection and the capacity to analyze it are areas for future improvement. Pairing manufacturing improvements and falling costs with a drive for more robust data collection and processing will pay dividends for future safety and efficiency.
Economic Regulation and the Surface Transportation Board
Oddly enough, the drive for additional regulations to improve safety has become a vehicle for calls to further regulate railroad prices and customer relations.
Broadly, the Surface Transportation Board, the agency responsible for regulating the economic functions of freight railroads, has proposed regulations, like updated rules for mandatory reciprocal switching and new requirements for determining market dominance, that impose further obligations (and consequently increased costs) for rail carriers. Mandatory reciprocal switching grants shippers who would otherwise have access to only a single carrier access to others by mandating that railroads offer to switch shippers’ cars to another carrier’s network in the case of poor service. The policy, which advocates say increases competitiveness and provides a remedy to anti-competitive behavior by railroads towards captive shippers, has long been a topic of contention tied closely to the industry’s complex history of mergers and consolidation.
While mandatory reciprocal switching can provide major benefits as a remedy for shippers lacking choice or bargaining power, if implemented poorly, these regulations can lead to service inefficiencies and delays, with the potential to increase costs and worsen performance elsewhere in the system. The safety measures and logistics associated with reciprocal switching can introduce additional operational complexity, which increases costs for rail carriers. However, as experts have expressed, reciprocal switching can be accommodated in an economically viable manner if designed and executed properly. The STB’s recently proposed rules are well-intentioned in their goal of clarifying existing complex regulations and remedying poor service on less-used routes, and it is likely to be invoked on a limited number of routes based on the newly designed eligibility tests.
Looking forward, the STB should carefully consider the impacts on profitability and competition for the freight rail industry as they weigh new economic and competition policies like reciprocal switching. Particularly as new autonomous technologies threaten to reshape the competitive landscape for both the freight rail and trucking industries, regulators must ensure that the regulatory burden does not prevent railroads from remaining competitive in a fast-moving and dynamic market.
California’s Proposed Environmental Regulations
In April 2023, California’s Air Resources Board (CARB) enacted first-of-its-kind rules restricting carbon emissions from trains that would significantly impact operating costs and service for freight railroads. The rules, which include phasing out older locomotive engines and banning many trains from idling for more than 30 minutes, are well-intentioned. However, locomotives make up an extraordinarily small percentage of California’s emissions – just 0.4% of the state’s total carbon dioxide emissions in 2021 and only 0.9% of the transportation sector’s total carbon dioxide emissions, according to CARB’s carbon dioxide inventory database. The high costs associated with compliance would help to boost efficiency and reduce emissions but represent only a miniscule slice of a much larger pie when considering the broader context of the state’s carbon footprint.
Conclusion
Ensuring that railroads remain well-resourced to allow for investment in safety-boosting technologies is critical, while also acknowledging that rules like California’s, which mandates a rapid transition to zero-emission locomotives, have the potential to divert investment dollars away from safety. Regulators should not rush to enact heavy-handed regulations by riding the coattails of well-reasoned changes to improve safety. Regulation does have a role to play in the market and can help to ensure a healthy balance of competition, efficiency, and coverage, but these policies should stand on their own economic merits. With the burdens of maintenance and safety falling on railroads, allowing carriers to remain profitable and competitive is critical for building a safe and functional system for years to come.
As you are well aware, your immediate predecessors—Republicans serving as speakers of the House—had rough goes in the job. Held over a barrel by the extremists in your party, they were loath to work across the aisle for fear of letting the extremists in my party get the better of any legislative deal.
Without a doubt, the Democratic and Republican parties have different and disparate interests, and rarely see eye-to-eye. But in regards to the current impasse on Capitol Hill, you and reasonable members of the Republican conference have more in common with pragmatic members of the Democratic caucus than you do the extremists who are mobilizing to get you fired.
As you plot the way forward, I want to point out a truth few have acknowledged: You’d not only position the U.S. to lead the world in energy, manufacturing, and climate change if you were to champion a grand legislative bargain. By damning the consequences, you’d paint yourself a hero, a patriot, as well and a unique political leader in this country at this very difficult time.
FACT: U.S. life expectancy loss during the COVID-19 pandemic: -1 year for college-educated, -4 years for high school diploma or less.
THE NUMBERS: Largest drops in U.S. life expectancy, last 125 years –
1917-1918
-11.8 years
1902-1904
-3.9 years
1942-1943
-2.9 years
2019-2021
-2.4 years
WHAT THEY MEAN:
The first April edition of the Centers for Disease Control’s (CDC) Mortality and Morbidity Weekly is uncharacteristically upbeat. It reports that in 2022, American life expectancy rose by a year and a month, to 77.5 years from the 76.4 years of 2021, pushed u by falling COVID mortality, a two-year drop in homicide rates, and other factors. This jump, though, followed a loss of 2.6 years during the COVID-19 pandemic, from 78.8 years in 2019 to 77.0 in 2020 and then 2021’s 76.4. The two-year decline was America’s worst in the 80 years since World War II, and the fourth-worst in CDC’s records going back to 1900.
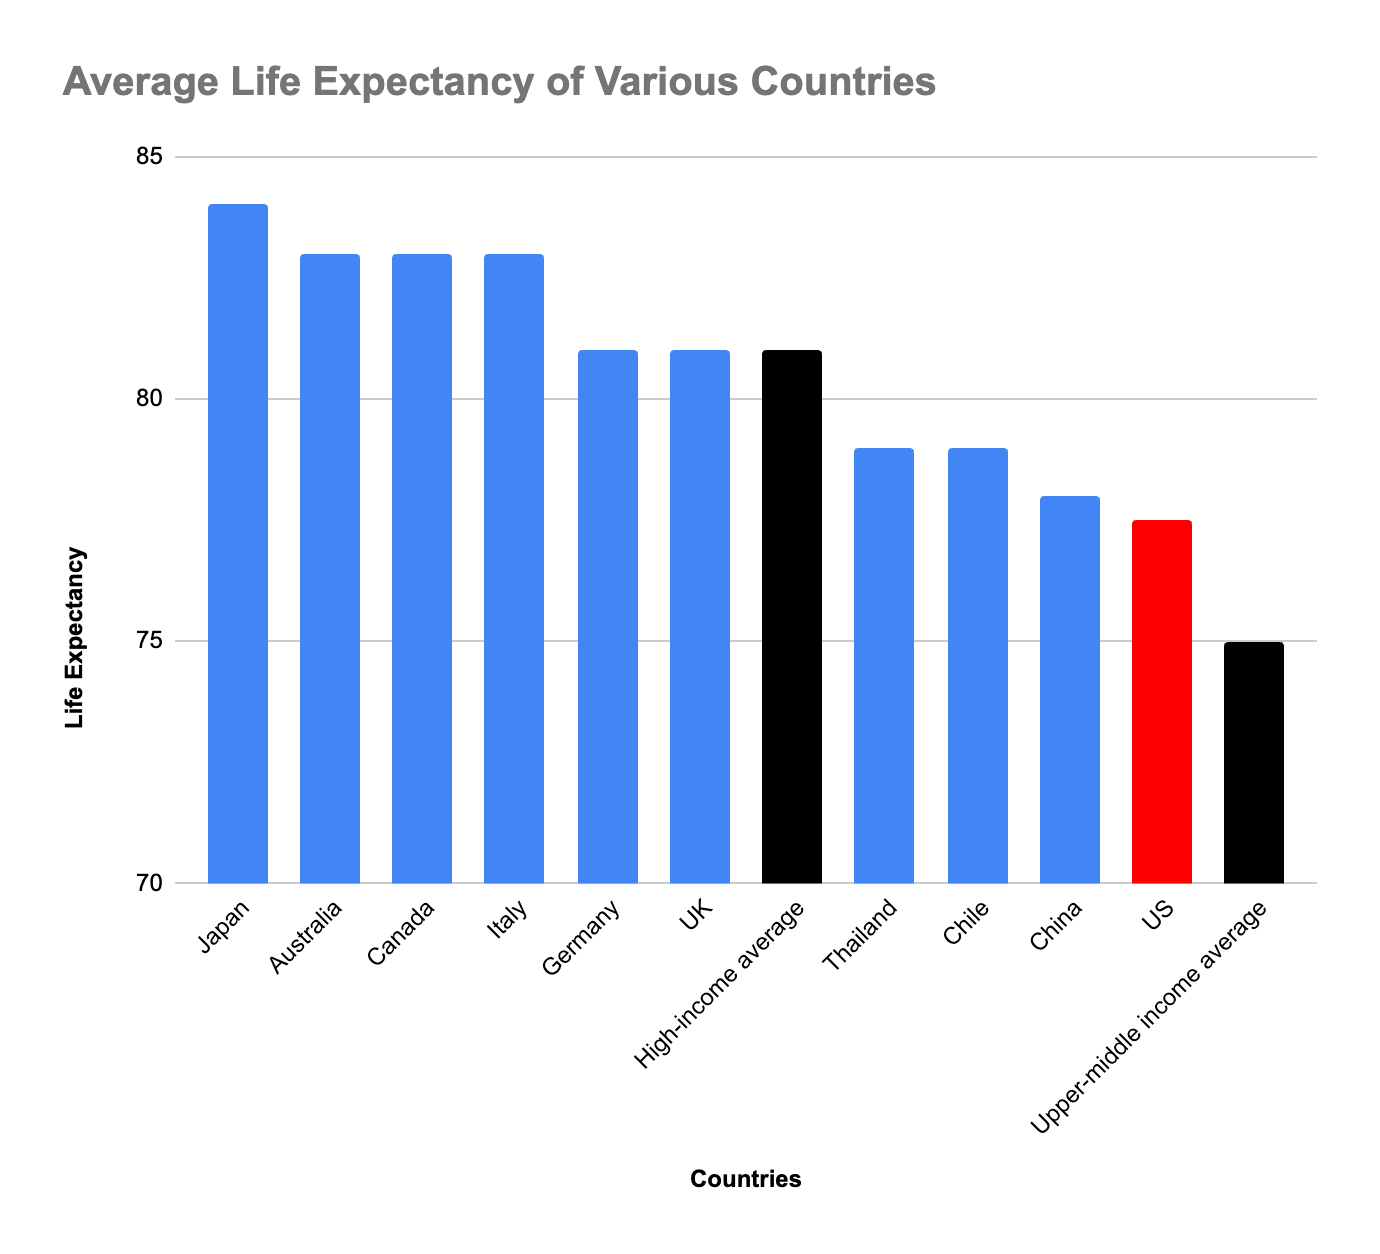
In international context, American’s overall pandemic life expectancy decline was sharp but not extraordinary. The World Bank reports a 2-year average life expectancy loss across the globe, and the actual difference might be less, since the Bank rounds to full years rather than using the CDC’s tenths. But nonetheless, the overall U.S. level remains strange, disturbing, and low: Americans get two years less life expectancy than the Bank’s 80-year “high-income country” average, and seven years less than the 84 and 85 reported for Switzerland, Korea, Japan, and Hong Kong at the very top of the World Bank’s table. The U.S., meanwhile, is in a group near the top of the Bank’s middle-income bracket, a bit below the 79-year averages for Thailand, Chile, and the United Arab Emirates, and equal to China’s 78.
The temptation is to ask: Why is American life so short? But this probably puts the question the wrong way. The single 77.5-year U.S. national life-expectancy average conceals extreme variation — by place, by race and ethnicity, by gender, and by education – with some groups of Americans in the high-income tier, and others with life expectancy more like those of lower-middle income or even least-developed countries. The COVID-19 pandemic loss likewise was not identical across the country, but magnified for some groups. In particular, research by Anne Case and Angus Deaton shows that from 2019 to 2021, life expectancy fell by one year for college-educated Americans while plunging by four for their high-school-only neighbors. A more detailed look suggests both reasons for the disparities and the dramatically different effects of the pandemic: pre-existing health patterns and their effects; the lag in regions where state governments have not expanded Medicaid; and the poor crisis-era presidential leadership in 2020. As a point of departure, here’s a table of life expectancies at birth worldwide and in the United States, using the World Bank’s figures for countries and regions and CDC’s for American states and demographic groups:
Asian American women (2022)
86.3 years
Japan (2021, longest country life expectancy)
84 years
Hawaii (2020, longest U.S. state life expectancy)
80.7 years
High-income country average (2021)
80 years
Thailand (2021)
79 years
U.S. (2022)
77.5 years
U.S. (2021)
76.4 years
U.S. (2019)
78.8 years
Mississippi (2020, shortest U.S. state life expectancy)
71.9 years
World (2021)
71 years
Brazil (2021)
71 years
Mexico (2021)
70 years
Native American men (2022)
64.6 years
Haiti (2021)
63 years
Least-developed country average (2021)
62 years
Chad (2021, shortest country life expectancy)
53 years
With this in the background, a more precise question might be: Why are the lives of some groups of Americans so much shorter than others? Look closer:
States and regions: The CDC’s most recent state-by-state table covers 2020, a year into the pandemic decline. It reveals a gap of nine years between the lowest- and highest-expectancy states. At the low end, Mississippi’s 71.9 years and West Virginia’s 72.8 resemble national figures for Peru, Armenia, Bangladesh, and Mexico. More generally, life expectancies are shortest — 71 to 74 years — across the Deep South and Appalachia, whose international regional matches include the Middle East at 73 years and the Caribbean at 72. Hawaiians, the longest-lived Americans, have life expectancies equal to the 81-year expectancies in Germany and the U.K. Washington, Minnesota, California, Massachusetts, New Hampshire, Oregon, and Vermont are a bit lower, clustered around 79 years. By region, the longest lifespans – the group between 78 and 81 years in 2020 – are in New England, the West Coast, and the Rocky Mountain West. This doesn’t match the Japan/Switzerland/Hong Kong tier, but it is close to Western Europe, China, and Taiwan. A policy/social observation: in the regions with the lowest life expectancy, homicide rates are highest and governments are least likely to have expanded Medicaid eligibility.
Race/gender/ethnicity: U.S. life expectancy varies even more widely by race, gender, and ethnicity than by geography. Dividing the population this way yields a life-expectancy range of 23 years, within sight of the 32-year spectrum dividing the world’s shortest-lived country (Chad at 53) from its longest-lived (Japan at 84). The 11 million Asian-American women now have a life expectancy of 86.3 years, longer than any of the 228 countries and territories in the World Bank’s tables. (But still a shade below the 87 years for women in Japan.) The 2.5 million Native American men are the shortest-lived group with a life expectancy of 64.6 years — barely above the 64-year average across the UN’s least-developed countries and Haiti’s 63 years, even with a two-year rebound from the 62.2 years in 2021. Between these poles, life expectancy in 2022 was 84.5 for Asian Americans; 80.0 for American Hispanics; 77.5 for non-Hispanic white Americans, mirroring the national average; 72.8 for African Americans; and 67.9 for Native Americans. In each case, women on average outlived men, by four to seven years.
Education level: Finally, using a somewhat different approach — healthy life expectancy at 25, as opposed to at birth — Americans with college degrees can expect nine years more life than Americans with high school diplomas or less. This gap widened sharply during the COVID pandemic, when (measuring from 2019 to the 2021 low), high-education Americans lost one year of life expectancy and non-college Americans four years. Three contributors to this sudden widening of the gap:
(a) Pre-existing vulnerabilities: Pre-COVID risk indicators show that less educated people were more vulnerable to a pandemic to begin with. Obesity and smoking rates, for example, are 36% and 28% among Americans with less than a college education, as opposed to 28% and 6% for college graduates.
(b) More exposed during the pandemic: Differing pandemic-era work patterns left working-class people more exposed. Workers in many upper-education careers — law firms, financial services, universities, high-level civil service, business managers – were often able to work from home in relative safety. Blue-collar workers — bus drivers, security guards, janitors, food-manufacturing workers, grocery store stockers and cashiers — by contrast were more likely to work on-site, and so were in greater danger.
(c) Poor presidential leadership: COVID vaccination rates were lower among non-college Americans — a 2023 NIH review shows 79% vaccination rates for college graduates and 49% for high school diploma or less – making infection more dangerous for this group. This suggests that less educated people, in particular, those attracted to “populism,” may have been more susceptible to anti-vaccination propaganda and premature de-masking, and more likely to be misled by Mr. Trump’s erratic and perhaps panicky oscillation between vaccine advocacy and flirtation with pseudo-remedies such as irradiation and animal medicines.
With this in the background, America’s low life expectancy seems less a general national problem than an acute issue concentrated in specific regional and demographic groups, and influenced both by state-level policy and crisis leadership. So reading the Morbidity and Mortality Weekly offers a mix of reassurance about recovery from the pandemic, sadness about poor choices, and longer-term hope that the country’s record can in principle get better.
FURTHER READING
Overall:
CDC’s take on 2022, in the April 4th Mortality and Morbidity Weekly.
Anne Case and Angus Deaton, writing for the Brookings Institution last year, highlight the life expectancies gaps separating college-educated from high-school-only Americans, and the COVID-era plunge for the latter.
Long-term perspective:
The CDC’s figures over the past 125 years show life expectancy at a dismal 47 years in 1900. (No vaccinations, no blood transfusions in accidents, no antibiotics or anti-inflammatory medicines, infant mortality at 157 deaths per 1,000 births as opposed to today’s 5.5.). Having risen to 54 by 1916, this crashed back down to 39 in 1918 — easily the worst event in the CDC’s statistical records, reflecting the 126,000 AEF soldiers killed in spring and summer World War I campaigns, and the 675,000 dead in that autumn’s Spanish Flu epidemic. Rebounding in the early 1920s, life expectancy reached 60 years by 1930 and 66 by 1941, then fell back to 63 in 1943. (Meaning the COVID pandemic’s impact was close to that of World War II.) The 70-year mark comes in 1960, after which life gets steadily longer for 50 years — 71 years in 1970, 74 in 1980, 75 in 1990, 77 in 2000, and 79 in 2010. Then came a plateau till 2019, followed by the 2.4-year drop to 2021 and the 2022 rebound. The CDC’s long view.
Ed Gresser is Vice President and Director for Trade and Global Markets at PPI.
Ed returns to PPI after working for the think tank from 2001-2011. He most recently served as the Assistant U.S. Trade Representative for Trade Policy and Economics at the Office of the United States Trade Representative (USTR). In this position, he led USTR’s economic research unit from 2015-2021, and chaired the 21-agency Trade Policy Staff Committee.
Ed began his career on Capitol Hill before serving USTR as Policy Advisor to USTR Charlene Barshefsky from 1998 to 2001. He then led PPI’s Trade and Global Markets Project from 2001 to 2011. After PPI, he co-founded and directed the independent think tank ProgressiveEconomy until rejoining USTR in 2015. In 2013, the Washington International Trade Association presented him with its Lighthouse Award, awarded annually to an individual or group for significant contributions to trade policy.
Ed is the author of Freedom from Want: American Liberalism and the Global Economy (2007). He has published in a variety of journals and newspapers, and his research has been cited by leading academics and international organizations including the WTO, World Bank, and International Monetary Fund. He is a graduate of Stanford University and holds a Master’s Degree in International Affairs from Columbia Universities and a certificate from the Averell Harriman Institute for Advanced Study of the Soviet Union.
Seventy-two percent of America is rural, yet these areas are only home to 14 percent of the population. Rural communities across the U.S. have higher poverty rates and lower education levels compared to those in urban and suburban areas.
While 41 percent of urban adults have a college degree, only 28 percent of rural adults do. While in most states, rural high school students achieve graduation rates similar to urban and suburban peers, their college enrollment rates are much lower. Without a degree, or a necessary alternative, rural students are less able to find higher-skilled and higher-paying jobs.
Going to college is a major decision, for anyone, but especially rural students who face increased barriers in accessing postsecondary education. Not only are there not as many colleges in rural areas, but getting to campus can pose a logistical challenge due to the distance students have to travel. This is especially hard if you are an adult learner, who make up over 30 percent of today’s postsecondary students. These learners are usually working or have a family and don’t have the flexibility to travel for hours to continue their education.
Rural America also continues to question the value of degree programs — grappling with the time, cost, and return on investment. Additionally, many communities and families fear that students who pursue a college degree will ultimately leave to seek better-paying careers elsewhere.
It’s clear college as we know it is not working for rural students. To close these gaps in educational attainment and economic opportunity, the nation’s higher education system must evolve to create more accessible, flexible, and industry-responsive opportunities.
Online education presents a solution to this educational divide. Remote, online opportunities offer a flexible and convenient way for students to learn. Instead of traveling far distances for their coursework, rural students can pursue online learning at their own pace, on their own time, and from the comfort of their own home. This flexibility eliminates the stress and cost of a long commute, the difficulties of juggling work and school, and having to build a schedule around very specific class times.
Online learning also helps to mitigate the concern of losing the younger generation to urban areas for higher education. Instead, these opportunities allow learners to stay in their community while also presenting a local economic development strategy. A more skilled workforce attracts employers which hopefully means more jobs and increased economic prosperity in the region.
However, even with the benefits, more must be done to ensure rural students can access online learning opportunities that yield strong economic returns.
First, reliable access to the internet remains a concern for rural students. Only 63 percent of rural adults say they have access to the internet at home, compared with 75 percent of urban adults. Policymakers and leaders must ensure these communities have access to basic internet so they can take advantage of remote education options. For example, Western Governors University (WGU) is working to help more students gain internet access by offering scholarships and working with political leaders to drive comprehensive solutions to the challenge. The Biden Administration has also invested in this effort through COVID recovery bills like The American Rescue Plan Act’s Digital Equity Act Program — providing $2.75 billion to establish three grant programs that promote digital equity and inclusion. They aim to ensure that all people and communities have the skills, technology, and capacity needed to reap the full benefits of the nation’s digital economy.
Second, online learning can be isolating, especially if you are learning in a remote, rural community. Manpower Demonstration Research Corporation (MDRC) has an idea that to enhance online education, college leaders, policymakers or others could create telecommuting hubs. These coworking spaces would offer broadband and office space — to help learners work together on shared challenges, while also allowing program completers to stay in their communities while pursuing high-wage work.
And lastly, federal regulation matters. Many rural schools have started partnering with online program managers (OPMs) for help launching or supporting online programs. OPMs supply a package of products, technology, and skill-sets that may be outside the core mission, experience, and expertise of a given college or university — helping to provide services outside a college or university’s reach. Writing on behalf of St. Bonaventure University in New York, Michael Hoffman said that their “OPM brings tremendous knowledge of online student recruitment, retention, and instructional design, which has been fundamental to our ability to offer high-quality, fully online programs.” However, last year, the Department of Education proposed a regulatory change that would have a detrimental impact on the ability of rural colleges to offer online classes through OPMs. To ensure more individuals — especially in rural communities — have access to online programming, federal leaders must regulate in a way that allows and incentivizes positive partnerships with OPMs, while ensuring these partnerships are fair, non-discriminatory, and yield strong student outcomes.
Online education emerges as a transformative solution to the multifaceted challenges hindering rural students’ access to postsecondary education. By overcoming geographical barriers, providing flexibility in scheduling, and mitigating the phenomenon of brain drain, online learning opens doors to educational opportunities previously inaccessible to many in rural communities. Its adaptability and accessibility not only empower students to pursue higher education but also contribute to the revitalization of rural economies and the retention of talent within these communities. As we continue to embrace the digital era, the promise of online education in bridging the gap between rural and urban educational opportunities remains a beacon of hope for a more equitable and inclusive future.
As nations across the globe look to address a perceived asymmetry of power in digital markets, Turkey has begun considering approaches for the regulation of large digital platforms. Through a Draft Amendment to Law No. 4054 of the Protection of Competition, regulators hope to lessen competitive harm in the market for digital services while ensuring the preservation of positive economic impacts of digital access.
Up to this point, the European Union has been the world leader in regulating digital competition, having enacted the Digital Markets Act (DMA) in 2022. The law is now in the implementation phase, leaving the world to watch and assess whether the European approach successfully increases competition or boosts economic growth.
Meanwhile, in the United States, Congress effectively rejected the opportunity to adopt comparable legislation in 2022 by declining to bring the American Innovation and Choice Online Act and Open App Markets Act, the two U.S. bills that most closely resemble the DMA, for a vote. During this time, the U.S. has economically outperformed Europe’s largest economies, with the strength of the tech sector being one contributing factor.
Concerns about the impacts on technological innovation, economic growth, and the consumer-friendly vibrance of digital platforms kept many in the United States from fully embracing the proposal. Additional concerns regarding the low cost of digital tools for entrepreneurs and small businesses further dissuaded adoption. Now, with implementation in Europe proving rocky, the European model is not the only path forward. Not only is there little evidence from the EU that the measure will be effective in promoting competitive growth, but the vagueness of the legislation paired with steep penalties creates a situation that disincentivizes the establishment of digital companies. From Turkey’s perspective, this poses an interesting set of questions regarding how to proceed.
Here, we break down the proposed measures, where they are in the legislative process in the United States and Europe, and concerns regarding implementation.