America’s health insurance system is undergoing a massive disruption in coverage, specifically for adults enrolled in Medicaid and for children enrolled in the Children’s Health Insurance Program (CHIP). On April 1, 2023, four months after the COVID-19 public health emergency declaration ended, states resumed their Medicaid and CHIP redetermination process and since then, troubling data has been emerging from states about what is happening to the 93 million Americans — nearly one in four — who gained Medicaid or CHIP coverage during the health care emergency.
Today, PPI released a new policy brief titled “Medicaid and CHIP Redetermination: Mitigating Coverage Loss,” analyzing the impact redetermination has had on healthcare coverage across the country. Report author Erin Delaney, PPI’s Director of Health Care, examines what actions have been taken at the federal level to mitigate coverage loss, the trends of current redetermination data, and policy changes that both states and the federal government can embrace to ensure that millions of Americans don’t fully lose their access to health coverage as the country transitions out of continuous coverage.
Seven months into this monumental coverage transition, the U.S. has hit a new disenrollment milestone. As of Nov. 1, at least 10,046,000 Medicaid enrollees have been disenrolled based on the data from 50 states and the District of Columbia. Millions more are expected to lose coverage in the coming months. Worse, in the 20 states that report age breakouts, children account for about four in ten of these Medicaid disenrollments.
Most concerning among recently reported redetermination data is that 71% of people have been disenrolled due to procedural glitches, meaning states have outdated contact information, enrollees are increasingly confused by the paperwork, or are missing deadlines for completing renewal packets. And that’s not all — confusion abounds, as adults and children may or may not still be eligible for Medicaid and CHIP, may have other coverage options, or may remain eligible for Medicaid or CHIP but don’t know it.
“America is facing a crisis in health care coverage, the largest transition in coverage since the first open enrollment period of the Affordable Care Act. More than 10 million Americans are losing health care coverage and millions more are expected to lose coverage in the coming months,” said Erin Delaney. “Both state and federal lawmakers must take immediate action and focus on improving data collection and state utilization of available CMS waivers and flexibilities, maximizing coordination with various stakeholders, and continued intervention in states with high procedural termination rates.”
The Progressive Policy Institute (PPI) is a catalyst for policy innovation and political reform based in Washington, D.C. Its mission is to create radically pragmatic ideas for moving America beyond ideological and partisan deadlock. Learn more about PPI by visiting progressivepolicy.org. Find an expert at PPI and follow us on Twitter.
The Largest in Health Care Coverage Since the Start of the Affordable Care Act
INTRODUCTION
America’s health insurance system is undergoing a massive disruption in coverage, specifically for adults enrolled in Medicaid and for children enrolled in the Children’s Health Insurance Program (CHIP). On April 1, 2023, four months after the COVID-19 public health emergency declaration ended, states resumed their Medicaid and CHIP redetermination process, which had been suspended during the pandemic. Troubling data is emerging from the states about what is happening to the 93 million Americans — nearly one in four — who gained Medicaid or CHIP coverage during the health care emergency.
Medicaid and CHIP enrollment grew substantially throughout the emergency due to the combination of the pandemic recession, new “continuous coverage” requirements and money from the federal government, and belated decisions in Nebraska, Montana, and Oklahoma to expand Medicaid under the Affordable Care Act (ACA). As a result, an additional 20.2 million Americans gained health care coverage.
Spiking unemployment rates caused millions of Americans to lose their employer-sponsored health insurance along with their jobs. Unemployment peaked at 14.7% in April 2020. By May, an estimated 27 million workers and their dependents had lost their health plans. Not surprisingly, the biggest increases in uninsured people were seen in states that had declined to expand Medicaid under the ACA.
Hit hardest by loss of coverage were mostly men, people aged 27-50, Hispanics, and low-income families. In response, Congress passed the 2020 Families First Coronavirus Response Act (FFCRA), which expanded enrollment in state Medicaid and CHIP programs from 71 to 94 million. In addition, more Americans purchased private health plans in the ACA’s individual insurance Marketplace. As a result, during the emergency the U.S. uninsured rate actually dropped to a historic low of 8.6% in 2021.
Now that the continuous enrollment has ended, an estimated 17.4% of Medicaid and CHIP enrollees (15 million) are projected to lose coverage. Some experts have estimated that disenrollments could range from 8 to 24 million. The Department of Health and Human Services (HHS) predicts that nearly 7 million eligible people could lose coverage for “procedural” reasons. This refers to situations in which states have outdated contact information due to misunderstanding or confusion the enrollee has on the paperwork, or they did not complete the renewal packets within the deadline.
The Congressional Budget Office (CBO) estimates that 6.2 million Americans will lose coverage in the redetermination process and will fully become uninsured, and an estimated 5.3 million children are anticipated to lose their coverage as well. HHS estimates that a third of those who will be at risk for losing Medicaid coverage are Hispanic, and 15% are Black. Unfortunately, the current data coming out of most states does not include a breakout of demographic groups. CBO estimates that this will swell the ranks of the uninsured by over 10% by 2033.
As of November 1, 2023, at least 10,046,000 Medicaid enrollees have been disenrolled based on the data from 50 states and the District of Columbia. Because there are varying lags of when states report data, this is likely an undercount of the actual number of disenrollments. There is also substantial variation in the disenrollment rates among these reporting states as each state has different approaches to managing its redetermination process. “Most concerning among recently reported redetermination data is that 71% of people have been disenrolled due to procedural glitches. Examples include states that have outdated contact information, enrollees confused by the paperwork, or missing deadlines for completing renewal packets. Confusion abounds, as adults and children may or may not still be eligible for Medicaid and CHIP, may have other coverage options, or may remain eligible for Medicaid or CHIP but don’t know it.
Throughout the redetermination process, people will lose Medicaid coverage because their income has increased as the economy has recovered. Disenrollment rates will vary according to differences in how the states approach redetermination. Those who are no longer eligible for Medicaid may be able to find coverage through the ACA Marketplace. They’ll be eligible for premium tax credits if they don’t have employer-sponsored health insurance that is considered affordable, meaning the employee share of premiums doesn’t exceed 9.12% of income in 2023. HHS estimates that nearly 3 million people could get ACA plans, while 5 million people who are disenrolled from Medicaid will gain coverage through their employers. While it will be critically important for those who are deemed ineligible for Medicaid to gain coverage through the exchanges or their employer, copays and out-of-pocket costs may be higher than Medicaid, making those coverage alternatives less affordable for some. Additionally, a KFF analysis shows that very few adults and/or children who lose their Medicaid and CHIP coverage will seamlessly transition to the ACA’s individual insurance exchanges. The most recent coverage transition data shows that roughly two-thirds (65%) of those who were disenrolled from Medicaid in 2018 had a period of uninsurance in the year following disenrollment and only 26% enrolled in another source of coverage for the full year following disenrollment.
Notably, more than half of children in the U.S. receive health care coverage through CHIP or Medicaid. CHIP covers children whose family earns too high of an income to qualify for Medicaid but do not earn enough to afford private health insurance. Unfortunately, parents who are getting notified that they’ve lost their Medicaid coverage don’t always know that their child still qualifies, resulting in further confusion on coverage options. Parents then try to enroll their children in a Marketplace plan that doesn’t always have the correct benefits for children, when they should be receiving coverage through CHIP. Both Medicaid and CHIP benefits are better designed to meet the needs of children, provide more comprehensive benefits, and are more affordable than private plans. There are certain limits on costs for care in CHIP and CHIP has been shown to be a more affordable option than employer-sponsored and Marketplace coverage. It’s clear that moving from Medicaid and CHIP to other forms of coverage demonstrates how important it is for a strong, coordinated response from the federal and state governments to mitigate disenrollments, especially for those who are disenrolled due to procedural reasons.
This significant gain in health coverage for millions of Americans saved countless lives, reduced suffering, and highlighted the importance of sound policies to make coverage more affordable and accessible, while incorporating coverage for telehealth services and for COVID-19 testing and vaccination. This period of continuous coverage is likely the closest the U.S. has gotten to universal coverage, making a smooth transition out of the PHE and mitigating coverage losses throughout the Medicaid redetermination process that much more critical. Despite the loss of the emergency expansion of coverage and the anticipated ineligibility of those who had this access, it is crucial to ensure that those who are deemed ineligible for Medicaid and CHIP are able to find alternative coverage options.
Given the enormity of this challenge and the impact that it will have on millions of Americans, this redetermination process has been deemed the largest transition in health care coverage since the first open enrollment period of the Affordable Care Act (ACA). PPI believes that both state and federal lawmakers should focus on improving data collection and state utilization of available CMS waivers and flexibilities, maximizing coordination with various stakeholders, and continued intervention in states with high procedural termination rates.
This policy brief examines what actions have been taken at the federal level to mitigate coverage loss, the trends of current redetermination data, and policy changes that states and the federal government can embrace to ensure that millions of Americans don’t fully lose their access to health coverage as the country transitions out of continuous coverage.
Today, Ben Ritz, Director of the Progressive Policy Institute’s (PPI) Center for Funding America’s Future, released the following statement in support of the bipartisan Fiscal Stability Act introduced in the Senate today:
“PPI commends Senators Manchin and Romney for leading 8 of their colleagues to introduce another pragmatic proposal for creating a bipartisan fiscal commission. Over the past year, the federal government’s real annual budget deficit more than doubled, from $933 billion to $2 trillion, despite our economy experiencing the lowest sustained period of unemployment since the 1950s. Boom times such as these are when we should be reducing our debt, not blowing it up.
“Creating a fiscal commission to tackle the problem now has bipartisan, bicameral support in Congress, as well as support from 90% of voters in both parties. Congressional leaders and the Biden administration should make the establishment of such a commission before the end of the year a top priority.”
The Fiscal Stability Act’s introduction builds on an effort that has picked up significant momentum in recent months. In September, a group of independent experts across the political spectrum — including Ritz — urged the creation of a bipartisan fiscal commission. Reps. Scott Peters and Bill Huizenga then introduced the Fiscal Commission Act of 2023, a bill similar to the Fiscal Stability Act which 198 House Republicans subsequently voted for as part of a government funding proposal. Upon being elected Speaker of the House, Mike Johnson listed the creation of a bipartisan debt commission as one of his top priorities.
This week, Ritz published a column in Wall Street Journal offering five reasons why Democratic leaders in Congress and the Biden administration should join the push, which recent polling shows 90% of Democratic voters already support:
• Deficits are undermining support for the Biden economy.
• Debt-service costs crowd out progressive priorities.
• Republicans must be challenged to accept tax increases.
• Social Security and Medicare face automatic cuts under current law.
• A financial fix would boost confidence in government.
PPI’s Center for Funding America’s Future works to promote a fiscally responsible public investment agenda that fosters robust and inclusive economic growth. It tackles issues of public finance in the United States and offers innovative proposals to strengthen public investments in the foundation of our economy, modernize health and retirement programs to reflect an aging society, and transform our tax code to reward work over wealth.
The Progressive Policy Institute (PPI) is a catalyst for policy innovation and political reform based in Washington, D.C. Its mission is to create radically pragmatic ideas for moving America beyond ideological and partisan deadlock. Learn more about PPI by visiting progressivepolicy.org.
Since 2019, employment in the EU App Economy has risen by 53%, to 2.9 million. That’s according to the latest estimate from the Progressive Policy Institute, presented in this paper. By comparison, U.S. App Economy employment was 2.6 million in 2022, a gain of 14% from 2019.
What accounts for this rapid increase in EU App Economy jobs? And to what extent is the App Economy creating new opportunities for women and other nontraditional groups to enter tech sector employment? Because of the lack of bias in the app store approval process, app development has become a key route by which women and young people across Europe can develop tech skills and become an integral part of the digital economy.
We note that none of these App Economy jobs existed 15 years ago, when Apple first opened the App Store on July 10, 2008, in the middle of the global financial crisis. Android Market (which later became Google Play) was announced by Google shortly after. These app stores created a new route through which software developers could write programs for smartphones. These mobile applications — called “apps” — could then be distributed to the rapidly growing number of smartphone users around the world.
The jobs generated by the app stores became an important part of the recovery from the financial crisis of 2008-2009 and the subsequent economic expansion. When the pandemic hit, the need to conduct life remotely supercharged the use of apps, and resulted in many new App Economy jobs in Europe.
This report describes some important aspects of the EU App Economy. We also examine app-related skills development, compare the female share of information and communications technology professionals in both the EU and the U.S., and give some examples of new opportunities in the App Economy.
FACT: Military spending was 2.3% of world GDP last year.
THE NUMBERS: World exports, 2022*-
All goods $24,000 billion
Clothes $315 billion
Fish $151 billion
Arms transfers $32 billion
*Sources: WTO for all goods and apparel; UN Food and Agricultural Organization for fish; Stockholm International Peace Research Institute (SIPRI) for arms sales. SIPRI data covers known transfers of “major conventional weapons.”
WHAT THEY MEAN:
What place does the military hold in the world economy? Statistical snapshots from 2022 on world military spending and arms trade, and then three cautions about the data:
World defense spending at modern-history lows: A widely-used calculation by the Stockholm International Peace Research Institute (SIPRI) finds world military spending — procurement, pay, military construction, and so on — at about $2.24 trillion in 2022. According to the International Monetary Fund, world GDP was $100.15 trillion that year. So SIPRI’s figure suggests that about 2.2% of world income went to military budgets, and a World Bank table for the same year yields a very close 2.3% of world GDP.
This figure captures the policies governments set down in 2021, just before the Russian invasion of Ukraine, and by historical standards, it is very low. Tallies from earlier decades report military spending rates above 6% of world GDP in the 1960s; in a range from 3.8% to 4.5% in the 1970s and 1980s; and varying since 2000 in a narrow band between 2.2% and 2.6%. As two points of comparison: (a) about 11% of world GDP goes to health (or 6% of world GDP if one counts only public spending), and 4.2% to education; and (b) in labor terms, the CIA’s World Factbook estimates that about 20 million men and women are in uniform around the world which would be 0.5% of the world’s 3.5 billion workers. To look more specifically at the U.S., American military spending was about 3.5% of GDP in 2022 (by the World Bank’s table), which is above the worldwide average but far below the 11% the U.S. Defense Department reports for the Korean War years in the early 1950s and the 5% levels of the later Cold War.
Arms trade small relative to civilian trade: SIPRI’s parallel “arms transfer” count reports about $32 billion worth of arms deliveries in 2022. Their count covers deliveries of “major conventional weapons” — tanks, planes, missiles, submarines, artillery, etc. — and includes sales of both new and used kits, licensed production, and deliveries of significant components as well as complete systems. Like the world’s combined military budget as a share of GDP, the arms transfer total is a lot of money but small when measured against civilian trade. The WTO’s most recent annual trade statistics report puts “goods trade” in general at $24 trillion in 2022, which would make SIPRI’s $32 billion in arms transfers about 0.1% of the total. Or, to look at particular products, the WTO’s places clothing exports at $313 billion — ten times SIPRI’s arms transfer figure — and automotive trade at a much larger $1.37 trillion, while the U.N. Food and Agricultural Organization’s estimate of fish and seafood exports was $151 billion.
Nor does military trade look very large for individual countries. By country, SIPRI’s top exporters in 2022 were the U.S. at $14.5 billion, France at $3.0 billion, Russia at $2.8 billion, and China at $2.0 billion. This would be about 1% of the U.S.’ $2.1 trillion in goods exports, 0.5% of French and Russian exports (though a higher 3% of Russian manufacturing trade), and 0.1% of Chinese exports. On the import side, military shares of trade can be quite high for the largest purchasers — Qatar, the largest buyer on the SIPRI list, spent $3.3 billion on weapons or 15% of its overall $28 billion in imports, and military goods accounted for 2% and 7% of imports for fourth place Saudi Arabia and fifth place Kuwait — but outside the Persian Gulf is rarely a very large part of national import bills.
Tentative Conclusion: The public data and estimates, then, suggest that as of 2022 the world’s military economy was a relatively small part of the larger global economy; military spending a modest though not tiny part of national budgets; and military trade a very small part of international trade. Three cautions, though:
Caution (1): Secrecy: In many countries, some sections of national defense budgets and arms sales aren’t thought suitable for publishing, and are thus missing from the totals. So figures for military spending and trade, strictly defined, are reasonable “lowest-case estimates” rather than very firm data.
Caution (2): Definitions: The military economy is not separate from the civilian economy, but merges with it along the edges. Definitions of what is “military” and what is “civilian” are thus a bit arbitrary. In military trade, for example, is the right approach SIPRI’s decision to count weapons only? Would it be better to add “dual-capable” trucks, chips, fuel, rifles, and satellites too? Repair, training, software updates, replacement parts, and maintenance? Or should everything a military service buys be considered “arms trade”?
As an important example, the U.S. Defense Department’s 2023 policy paper observes that for both of these reasons, China’s “actual military-related spending could be 1.1 to 2 times higher than stated in its official [$209 billion] budget.” This would suggest a figure approaching $400 billion and somewhere between 2% and 3.2% of Chinese GDP, in contrast to the World Bank table’s 1.6%. (And some private estimates go higher.) Or to choose a case close to home, the State Department’s Political-Military Affairs branch, which oversees official U.S. arms sales policy, uses a broader definition than SIPRI’s to report “new sales” of U.S. weapons at about $55 billion a year, which would imply considerably higher global as well as American arms sales.
Caution (3): Changing times: The defense budgets and arms transfers of 2022 are those decided upon in 2021, just before Russia’s attack on Ukraine. Whatever the definitions one chooses, and however much they publish, governments are making this year’s budgets and sales in a world grown more dangerous, and their numbers will presumably be larger.
Secretary of Defense Lloyd Austin, presenting an $842 billion request for next year’s defense budget to the Armed Services Committees, notes (a) a “pacing challenge” from rising military spending and capability in China; (b) an “acute threat” to Europe and global security posed by Russia’s invasion of Ukraine; and (c) structural programs including pay raises for enlisted personnel, research and development, and more.
The Commerce Department’s Bureau of Industry and Security oversees export controls.
And the State Department’s Arms Sales and Defense page.
Spending:
A World Bank table of military spending/GDP makes Latin America and the Pacific Islands the regions with the least ambitious military budgets, at an average of 1.0% for each region. The Arab states’ spending level is highest at 5.0%. The sample below drops two outliers at the very top — Eritrea’s 20.5% of GDP as of 2003, and Libya’s 15.5% as of 2014 — along with embattled Ukraine’s 33.5%. (Also note, the Bank doesn’t venture a guess for North Korea.) Apart from these anomalies, military spending/GDP ratios around the world in 2022 topped out at Saudi Arabia’s 7.4% and Qatar’s 7.0%, and drift downward to the 0.2% levels for Laos, Mauritius, and Ireland, and Haiti’s lowest-in-the-world 0.1%. Here’s a sample list indicating the range.
Saudi Arabia
7.4%
Qatar
7.0%
Oman
5.2%
Israel
4.5%
Russia
4.1%
U.S.
3.5%
Cuba
2.9%
Singapore
2.8%
South Korea
2.7%
Pakistan
2.6%
Lithuania
2.5%
WORLD
2.3%
Vietnam
2.3%
United Kingdom
2.2%
France
1.9%
China*
1.6%
Norway
1.6%
Spain
1.5%
New Zealand
1.2%
Thailand
1.2%
Brazil
1.1%
Switzerland
0.8%
Indonesia
0.7%
South Africa
0.7%
Argentina
0.4%
Ireland
0.2%
Haiti
0.1%
* Official published Chinese budget. At the high end of DoD’s range, the Chinese military share of GDP share would be 3.2%, about the same as that of the United States.
And some perspectives on China’s military spending:
Ed Gresser is Vice President and Director for Trade and Global Markets at PPI.
Ed returns to PPI after working for the think tank from 2001-2011. He most recently served as the Assistant U.S. Trade Representative for Trade Policy and Economics at the Office of the United States Trade Representative (USTR). In this position, he led USTR’s economic research unit from 2015-2021, and chaired the 21-agency Trade Policy Staff Committee.
Ed began his career on Capitol Hill before serving USTR as Policy Advisor to USTR Charlene Barshefsky from 1998 to 2001. He then led PPI’s Trade and Global Markets Project from 2001 to 2011. After PPI, he co-founded and directed the independent think tank ProgressiveEconomy until rejoining USTR in 2015. In 2013, the Washington International Trade Association presented him with its Lighthouse Award, awarded annually to an individual or group for significant contributions to trade policy.
Ed is the author of Freedom from Want: American Liberalism and the Global Economy (2007). He has published in a variety of journals and newspapers, and his research has been cited by leading academics and international organizations including the WTO, World Bank, and International Monetary Fund. He is a graduate of Stanford University and holds a Master’s Degree in International Affairs from Columbia Universities and a certificate from the Averell Harriman Institute for Advanced Study of the Soviet Union.
Yesterday marked yet another election cycle in which voters rejected Republicans’ ongoing attempt to limit abortions and restrict reproductive care. Republicans continue to lose ground on this issue, even on their own red state turf. Every time abortion rights are put to a popular vote, they win and right-wing abolitionists lose.
The truth is that Americans are supporting abortion access at higher percentages than before the Supreme Court struck down Roe v. Wade. A 59% majority say they still oppose the justices’ decision. The results this cycle again confirmed broad public support for abortion access across the country and misgivings about the Supreme Court’s disruptive decision:
• Ohio voters came out in droves to enshrine abortion protections into their state constitution, preventing a dangerous six-week abortion ban (including no exceptions for rape or incest) from going back into effect after being blocked by the courts for over a year. The amendment to the state’s constitution got 56.6% of the vote.
• Virginia voters didn’t buy the Republicans messaging on a 15-week abortion ban as a “moderate” and “reasonable compromise” and voted to keep the Democratic majority in the Senate and flip the House, preventing Governor Youngkin from implementing the ban with a Republican majority. This also leaves Virginia as the southernmost state without a post-Roe change to abortion access.
• Despite the race not determining the majority in the Pennsylvania Supreme Court, voters showed strong support for the pro-choice Democrat, ensuring the Court will continue to protect reproductive access in the state.
• Finally, in deep-red Kentucky, voters also backed Democratic candidates for both Governor and Attorney General who promised to support abortion rights.
This all comes at the heels of last year, where ballot measures in six states, the most on record for a single year, resulted in wins for abortion rights, including in California, Kansas, Kentucky, Michigan, Montana, and Vermont. Next year, 11 more states could also face ballot measures related to abortion access, including in Arizona, Colorado, Florida, Iowa, Maryland, Missouri, Nebraska, Nevada, Pennsylvania, and South Dakota.
If the results of these races have been any indication of what messaging voters resonate with and the issues that matter most to them, it’s abundantly clear that ensuring abortion access remains a top concern. Voters see right through the thin veil of the Republican abortion agenda and clearly see their attacks on Democracy and on reproductive rights: They will go to any length to interfere in their ability to decide how and when to plan for their families.
At a time when maternal and infant mortality is skyrocketing in mostly red states, and pregnant women are being forced to sit in hospital parking lots until they are sepsis to receive care because of draconian abortion restrictions in red states, Americans’ health fares far worse at the helm of Republican leadership. Voters continue to see and are experiencing the harmful effects of the latest abortion restrictions post-Roe and show up time and again to refute the radical, toxic Republican abortion and reproductive health agenda.
Last night’s results demonstrate again that the majority of American voters are with the Democrats on reproductive rights. The party should center the abortion issue in next year’s national elections as well as state legislative contests. Democrats have an opportunity to connect with independent and moderate Republican voters who don’t want to see their personal liberties stripped away.
After his election as House speaker, Mike Johnson said one of his top priorities was the creation of a bipartisan commission to tackle the national debt. It’s a good idea that nearly 70% of voters in both parties support. In September, Reps. Scott Peters (D., Calif.) and Bill Huizenga (R., Mich.) introduced the Fiscal Commission Act of 2023, and 198 House Republicans voted for it as part of a government funding bill. Here’s why Democratic congressional leaders and the Biden administration should join the push:
Deficits are undermining the Biden economy. In the past year, the real federal budget deficit more than doubled, from $933 billion to $2 trillion. Democrats rightly argued that spending borrowed money was a critical economic support during the Covid pandemic. But the unemployment rate the over past year has been consistently lower than any point since the 1950s.
Economists, even those on the far left who subscribe to “modern monetary theory,” agree that increasing deficits in a tight labor market fuels inflation. Voters’ frustrations with inflation and the interest-rate hikes implemented to bring it under control exceed their appreciation for low unemployment, fueling disapproval of President Biden’s economic record. Deficit reduction is more important than it has been at any other time in the 21st century.
Debt-service costs crowd out progressive priorities. Annual interest payments are already at their highest level as a percentage of gross domestic product since the 1990s. By 2028 the government is projected to spend more than $1 trillion on interest payments each year—more than it spends on Medicaid or national defense. Worse, the U.S. may be entering a vicious circle whereby higher deficits increase debt and fuel inflation, which the Federal Reserve must combat by raising interest rates, causing debt-service costs to balloon further.
This week, an updated complaint filed by the Federal Trade Commission has raised additional questions about the merits of the FTC’s case regarding alleged anticompetitive practices by Amazon in their online storefront.
As has previously been stated by PPI’s Director of Competition Policy, Diana Moss, the FTC has a heavy lift in defending the markets it defines in the complaint — especially the “online superstore” market. The unorthodox approach of defining a market around a company’s large market share will garner scrutiny, potentially casting a shadow on the claim that consumers have been harmed.
This concern is especially pertinent in the face of a distinct lack of public support for any remedy, should the FTC prevail, around breaking up services offered by Amazon. For example, polling by PPI finds that 70% of working-class Americans do not support the government’s interference with Prime delivery services. The same poll found that only 17% of those asked supported breaking up the service.
The updated complaint reinforces a misunderstanding of the way in which today’s users buy and sell on Amazon. In defining the consumer-facing relevant market as online superstores, the FTC essentially concludes that e-commerce platforms specializing in certain types of products are not good substitutes.
This assumes that consumers use Amazon as a one-stop shop for all types of goods sold on the Amazon platform, a claim that is unproven in the complaint. Moreover, it ignores basic questions around how consumers consider product pricing and quality. Instead, the FTC assumes that because a product is available on the Amazon Marketplace, it is the optimal choice for consumers.
Take, for example, the complaint’s assessment of how Amazon offers the “Prime” designation to third-party sellers. The Fulfillment By Amazon (FBA) program is the primary means for sellers to obtain a Prime label, but requires them to distribute through Amazon warehouses to ensure that the standards of shipping are consistent with Amazon’s branding.
Under the FBA system, consumers benefit from knowing the speed and quality of service they can expect upon making a purchase. The other option for sellers to be included in the benefits of Prime labeling is Seller Fulfilled Prime (SFP), which closed enrollment in 2018 but may be reopening this year. SFP provides an alternative to Amazon’s FBA service, allowing third-party sellers to be eligible for the Prime designation on their listing without giving their inventory to Amazon warehouses.
However, Seller Fulfilled Prime became an issue of quality for Amazon’s customers, who were receiving packages far outside the two-day shipping window which is generally expected with Prime services. Amazon has previously stated that “fewer than 16% of SFP orders in the U.S. met the Prime Two-Day delivery promise customers expect,” meaning that in many cases the program was not beneficial to consumers who had to wait longer to receive orders despite the indication that the purchase was eligible for Prime delivery. When fulfilled through the FBA program, Prime delivery indicates that purchases will be shipped within two days.
The FTC attempts to equate the two programs, arguing that the discontinuation of enrollment served as a tool for Amazon to limit competition with third parties. Citing in the complaint that sellers enrolled in SFP met their promised “delivery estimate” requirement more than 95% of the time in 2018, they argue that the service provided was thus consistent with sellers utilizing the FBA program. However, the “delivery estimate” is an indication of the reliability with which a seller ships products, rather than the speed. While SFP sellers may reliably ship products, they do so at a much slower speed than is expected through FBA, which reliably ships products quickly.
This important distinction highlights the fact that the Prime label comes with an expectation of quality, and by differentiating its offerings, Amazon consumers are less likely to encounter listings that misrepresent the products and services they are providing. With an estimated 2.3 million active sellers on the Amazon Marketplace, consumers benefit from assurances that the quality of their purchase will be as expected. Competition on “quality” is a well-known concept and an important non-price dimension of competition. As the FTC examines concentration in the digital economy, it is critical that antitrust considers all dimensions of competition and target behaviors that truly harm consumers.
By installing Rep. Mike Johnson (R-La.), an ardent 2020 election denier, as Speaker without a single dissenting vote, House Republicans have erased any doubts about where their true loyalties lie.
Forget about “America First.” House Republicans have put Donald Trump first, abjectly surrendering to his seditious campaign to undermine Americans’ confidence in their democratic institutions.
That’s sparked the retirement of Rep. Ken Buck (R-Colo.), who warned his colleagues that Trump’s lies and lawlessness will lead Republicans to defeat again in next year’s presidential contest.
Unlike members of the Freedom Caucus, the new Speaker ostensibly is a nice guy. A change in tone is welcome, but it won’t mean much so long as GOP leaders remain mesmerized by Trump, either because they adore him or are terrified that he’ll urge his followers to turn them out of office.
On this episode of the Mosaic Moment Director of Mosaic, Jasmine Stoughton, sits down with Sara Nichols, Environment and Economic Development Director at the Land-of-Sky Regional Council, to share her experience testifying before Congress. Get a behind the scenes look at what goes into a Congressional hearing from the perspective of an expert witness.
Watch the Congressional hearing and read Sara Nichols’s written testimony here.
FACT: 13 of the 54 World Series players this year are “international.”
THE NUMBERS:
MLB rosters by birthplace –
All players
969
U.S.*
719
Dominican Republic
104
Venezuela
62
Cuba
21
Mexico
15
Canada
10
Japan
8
Colombia
7
11 other countries
23
* Includes 15 Puerto Rican players, whom MLB for some reason counts as “international.”
WHAT THEY MEAN:
Cuban-born Adolis Garcia’s 11th-inning walk-off won Game 1 for the Rangers on Friday night; Venezuelan catcher Gabriel Moreno’s 2nd-inning home run started the Diamondbacks’ 9-1 rout on Sunday’s Game 2. The two teams together feature 12 international players: six Dominicans, three Venezuelans, and three Cubans as the Series began; still seven as they prepare for Game 5 but now seven, three, and two respectively given Garcia’s Game 3 injury and replacement last night by Dominican shortstop Ezequiel Duran. Altogether, they make up 24% of the Series rosters. This figure:
(a) Pretty closely matches the 26.5% international share of MLB’s full Opening Day rosters, and likewise faithfully reflects the roles of the Dominican Republic, Venezuela, and Cuba as the top three contributors;
(b) Is also quite close to the 25% international-player share of the roughly 4200 pro athletes playing this year in the six big North American pro leagues (MLB, NBA, WNBA, NFL, MLS, and NHL); and
(c) Is a bit above the 18% overall international share of the American workforce, but typical of top-tier elite working life. Some context for this last point:
The Bureau of Labor Statistics’ Labor Characteristics of the Foreign-Born Workforce release comes out each May. Its most recent edition reports 158.3 million people working in the U.S. last year, of whom 28.7 million or 18% were born abroad. The foreign-born workforce is growing relatively faster than the native-born on net — the BLS release finds total U.S. employment up 5.7 million from 2021 to 2022, with foreign-born labor up 2.3 million workers and U.S.-born by 3.4 million. This “net growth” figure, though, conceals the fact that most of the 3.6 million workers who retire each year are locally born, so the actual “gross” count of new jobs for native-born Americans was probably more like 6 million.
Looking past these top-line figures to specific industries, the foreign-born labor shares represent a sort of classic “smile curve,” with immigrant contributions highest in the best-paying and lowest-paying sections of the economy, and lower in the middle. At the very top, MLB’s 250 international players join 60% of this year’s 20 Oscar acting nominees and 50% of the six U.S.-based 2023 Nobel Prize laureates in science and economics. At the lower-paying end, USDA’s Economic Research Service reports that about 60% of crop-pickers on American farms as of 2022 are immigrants, and BLS finds foreign-born employment shares between 20% and 30% in construction, groundskeeping, domestic and personal care services, and food preparation. An illustrative table with immigrant labor shares, using 2023 when possible and otherwise picking the most recent year available:
Crop-picking farmworkers
60%
Computer science doctorates
60%
2023 Oscar nominees
60%
All farmworkers
44%
Doctoral-level science & tech workers
40%
Construction workers
34%
Major-league athletes
25%
Food service
23%
Personal care & services
20%
All science & tech workers
19%
All U.S. workers
18%
Management jobs
14%
Education & training
12%
Health care practitioners
10%
Lawyers & paralegals
6%
Security services
6%
Sources: Bureau of Labor Statistics for all workers, National Science Foundation for engineering and science workers; MLB, NBA, WNBA, MLS plus outside writers on hockey and football for athletes.
Turning back to the Series, though, the nationalities of Garcia, Moreno, their MLB teammates and rivals, and by extension, the nationalities of U.S. workers generally, are interesting both as background for fans watching the game and as illustrations of the evolution of the economy and working life. But what they’re actually doing is the main thing. The manager’s perspective: Don’t overthink it. Play ball.
FURTHER READING
The Bureau of Labor Statistics’ most recent Labor Characteristics of the Foreign-Born Workforcebrief, out May 2022.
More on sports:
MLB: The 2023 Opening Day baseball rosters featured 250 foreign-born players or 26.5% of the 969 players variously out on the grass (or the “artificial turf” used in the Rangers’ Globe Field and the Diamondbacks’ Chase Stadium), riding the bench, or on the DL. Of these, 104 were Dominican, 62 Venezuelan, 21 Cuban, 15 Mexican, 10 Canadian, 8 Japanese,* 7 Colombians, and the remaining 23 are divided among eleven countries.
NBA: If MLB scouts spend most of their time on the Caribbean littoral, with frequent side trips to Japan and Taiwan, the NBA’s talent-spotters have to span the globe. The league’s opening tipoffs last week featured 125 international players among 450 players, or 28% of the total including as a sample 26 Canadians, 14 French, 9 Australians, six Nigerians, five Turks, three from Cameroon, three Lithuanians, one Georgian and one from South Sudan, three from the Democratic Republic of the Congo, two Bahamians, two Japanese, two Ukrainians, six Germans and so on across 40 countries.
WNBA: The NBA’s sister league is slightly less “international,” though not dramatically so, with 30 international players among the 164 women on all 12 teams combined. Australia led with 7, Canada 4, Hungary, France, and China two each; this year’s champion Las Vegas Aces was unusual in having just one international player, Australian center Cayla George.
MLS: U.S. pro soccer is majority international, with 350 Americans and 440 international players. The league fudges the data a bit by declaring Canadians “domestic,” so as to get a North American 50.1% majority player share. The next biggest countries are Argentina with 40 players on North American pitches, Brazil with 34, and Colombia with 25.
NFL: Least “international” of the big U.S. pro leagues, the NFL is also distinctly less analyst-friendly since it doesn’t appear to provide a distinct count of international players. Wikipedia reports 106 of them (counting American Samoa), while NBC’s Chicago affiliate argues for 82. Given 1,676 total players, we can compromise on roughly 6%.
NHL: The “nation” in “National Hockey League”, finally, is not the United States but Canada, home to 295 of this year’s 506 skaters. The rest split equally between the U.S. and Europe — 205 Americans, 206 Europeans — with the top European contingents including 64 Swedes, 41 Russians, 36 Finns, and 23 Czechs.
A look back:
Some historical data on U.S. immigrant labor from the Migration Policy Institute.
International perspective:
The International Labor Organization counts 169 million “international migrant” workers as of 2019. This meshes imperfectly with the BLS’ count of the American workforce, as the ILO uses “all foreign-born workers” for countries that record these figures, but only “migrant” [i.e. non-citizen] workers for some other countries. This noted, the ILO report finds 32% of the world’s migrant workers in Europe, 22% in Canada and the U.S., 15% in the Middle East, and 14% in Asia and the Pacific. ILO on migrant workers.
Or, taking a global view, the World Bank’s figures for immigrant shares of the population (rather than workforce participation) place the U.S.’ 14.5% immigrant share of the population a) far below the majority-immigrant populations of the Persian Gulf, which run as high as 88% for the United Arab Emirates; (b) well above the mostly local East Asian workforces, with those of China and Vietnam the world’s lowest at 0.1% and (c) in the middle of the 8%-25% range of other large, wealthy western countries such as Canada, Italy, the U.K., Germany, France, or Australia.
And for comparison:
Hollywood’s 2023 Oscar nominees, tracing birth to Malaysia, Ireland, Vietnam, U.K., Australia, and more
The 2023 Nobel Prizes; Weissman, Goldin, and Brus are Massachusetts, New York, and Cleveland; Katariko, Bawendi, and Yekimov respectively born in Hungary, France, and Russia.
USDA’s look at America’s 1.18 million hired farmworkers.
And the National Science Foundation on the American sci/tech workforce; 19% international overall, with India the top source followed by China and the Philippines.
ABOUT ED
Ed Gresser is Vice President and Director for Trade and Global Markets at PPI.
Ed returns to PPI after working for the think tank from 2001-2011. He most recently served as the Assistant U.S. Trade Representative for Trade Policy and Economics at the Office of the United States Trade Representative (USTR). In this position, he led USTR’s economic research unit from 2015-2021, and chaired the 21-agency Trade Policy Staff Committee.
Ed began his career on Capitol Hill before serving USTR as Policy Advisor to USTR Charlene Barshefsky from 1998 to 2001. He then led PPI’s Trade and Global Markets Project from 2001 to 2011. After PPI, he co-founded and directed the independent think tank Progressive Economy until rejoining USTR in 2015. In 2013, the Washington International Trade Association presented him with its Lighthouse Award, awarded annually to an individual or group for significant contributions to trade policy.
Ed is the author of Freedom from Want: American Liberalism and the Global Economy (2007). He has published in a variety of journals and newspapers, and his research has been cited by leading academics and international organizations including the WTO, World Bank, and International Monetary Fund. He is a graduate of Stanford University and holds a Master’s Degree in International Affairs from Columbia Universities and a certificate from the Averell Harriman Institute for Advanced Study of the Soviet Union.
A decade ago, a majority of Americans felt positive about higher education but today these feelings have shifted. Americans, even across party lines, are increasingly concerned about affordability, access, and the overall payoff of a college degree. Combined with technological advances that have altered the credentials and skills needed for a successful career, many Americans have come to believe that traditional four-year degree programs do not meet our nation’s industry demands.
Today, the Progressive Policy Institute (PPI) released a new report “Revisiting Super Pell: Empowering Students to Earn the Skills They Need to Succeed,” detailing an innovative policy proposal to expand the existing Pell Grant program and allow it to cover short-term industry-aligned programs. PPI recommends consolidating existing assistance for higher education — tax incentives, the Pell Grant and other programs — into a new Super Pell Grant.
Report author Taylor Maag, Director of Workforce Development Policy and the New Skills for a New Economy Project at the Progressive Policy Institute, outlines how a Super Pell grant would reach roughly 5 million more students from middle and low-income backgrounds, increase the average Pell award by at least $500, and allow all eligible individuals to use their aid for non-degree programs that are not currently covered by federal financial aid.
“As we stand at the intersection of technological advancements, shifting workforce demands, and a growing desire for accessible career education, America’s degree-centric model for higher education must evolve. A Super Pell Grant would consolidate federal higher education spending to expand the reach of the Pell Grant while also expanding its ability to cover shorter-term, more workforce-oriented programs. This expansion would enable millions of Americans to pursue quicker and more affordable ways to acquire higher skills and higher-wage jobs. The result will be a societal win-win: a more adaptable and competitive workforce and less economic inequality,” said Taylor Maag.
By enacting Super Pell, policymakers would be simplifying federal aid and expanding access to postsecondary education. The expansion of this grant and the inclusion of short-term workforce training will not only meet the needs of today’s students — those who are older and more diverse — but also ensure employers have the talent they need to remain competitive.
New Skills for a New Economy, a project of PPI, seeks to promote workforce development policies that level the playing field for degree and non-degree workers. This project plays a critical role in shaping federal and state workforce policy, weighing in on important debates, key legislation, and helping to lift up new ideas and best practices happening across the country.
The Progressive Policy Institute (PPI) is a catalyst for policy innovation and political reform based in Washington, D.C., with offices in Brussels, Berlin and the United Kingdom. Its mission is to create radically pragmatic ideas for moving America beyond ideological and partisan deadlock. Learn more about PPI by visiting progressivepolicy.org.
In July, the European Commission released a new strategy agenda for the so-called metaverse. The metaverse is a broad grouping of immersive virtual reality worlds, where everything from work to gaming to socializing could take place. It’s widely seen as a giant flop right now, with only a handful of users registered even on the most popular platforms like Meta’s Horizon Worlds, and few practical applications.
Still, many in the industry are convinced the metaverse will dominate tech’s future, and it’s no surprise that states are jockeying for influence. But as with other technologies, Europe doesn’t seem capable of—or even interested in—leading in the actual technology around the metaverse. Instead, it is interested in leading the policy discussion, or the regulation of that new technology.
A decade ago, Americans felt positively about higher education — over 95% of parents (across political parties) said they expected their kids to go to college. Today, these feelings have shifted. Fewer young adults believe college is important, only about one-third of the American public has confidence in higher education, and, in contrast to the college-oriented parents of 10 years ago, almost half now say they’d prefer their children pursue something other than a bachelor’s degree upon their high school graduation.
So, what has changed in the last decade? A recent study from Pew Research Center revealed that Americans are increasingly concerned about affordability, access, and the overall payoff of a college degree. Meanwhile, technological advances and AI have begun to change the world of work, altering the credentials and skills needed for success. Many Americans have come to believe that traditional degree programs do not meet these new industry demands.
Additionally, a half-century ago, many workers could earn a family-sustaining wage with just a high school diploma. Today, most workers need at least some postsecondary education or specified skill set to succeed in our economy. According to an analysis from the National Skills Coalition, 52% of jobs today require more education and training than high schools provide, but less than typically included with a four-year college degree. Unfortunately, only 43% of workers have access to the skills training needed to fill those jobs.
Public policy has not kept up with these changing demands. While dramatically expanding financial support for college students, Washington has chronically underinvested in workforce development and the ability for non-degree workers and learners to acquire in-demand skills. Left in the lurch are individuals who need and want workforce training that does not require two- or four-year degrees, as well as U.S. employers trying to fill skills gaps. In essence, federal policy has opened a chasm between the educational establishment and the nation’s labor market.
PPI believes “Super Pell” grants aimed at helping future and current workers acquire valuable in-demand skills can help bridge that gap.
The federal Pell Grant program, authorized by Title IV of the Higher Education Act (HEA), is the single largest source of federal grant aid supporting postsecondary students from low-income families. Total federal spending on the program last year was around $27.6 billion and in 2021/22, the number of Pell Grant recipients grew to 6.1 million or 34% of undergraduate students. But Pell Grants can’t be used for all postsecondary programs. The aid can only be used in educational institutions that are accredited and approved by the Department of Education (ED) and for programs that meet certain seat time and credit criteria. These requirements exclude many shorter-term, workforce-oriented programs — limiting the postsecondary opportunities individuals can choose from.
In 2014, PPI scholar Paul Weinstein proposed reforming Pell to establish a single higher education grant that would be more generous, easier to access, and financed by folding the myriad of existing tax incentives and higher education spending programs into one offering.10 He later renamed it “Super Pell” and PPI added to the idea in 2019 in our progressive budget for equitable growth.11 The proposal not only ensures more Americans can draw down on this aid but also includes high-quality workforce programs — giving America’s current and future workers the opportunity to use federal aid for educational opportunities best poised to meet their needs and the needs of the labor market. This policy brief dives into why Super Pell is needed now, why this proposal is different than what’s out there and action that has been done to date.
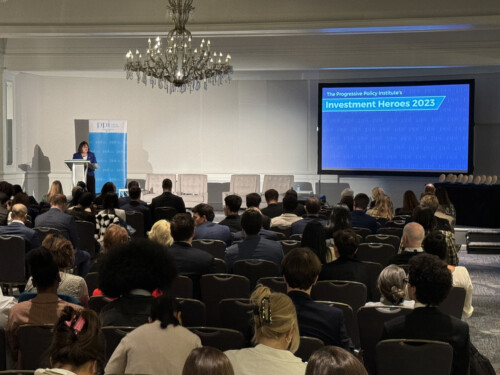
This week, the Progressive Policy Institute (PPI) hosted an event celebrating the release of PPI’s annual report “Investment Heroes 2023.”New Democrat Coalition Chair, Representative Annie Kuster (NH-02) provided closing remarks on the importance of investing in America’s workforce.
“New Dems believe that American businesses are the key to providing the jobs and opportunities necessary to strengthen our economy and improve hardworking families’ lives,” said New Democrat Coalition Chair Annie Kuster (NH-02). “It’s heartening to see the work U.S. companies are doing to support their workers, create opportunities, and grow the economy. In Congress, New Dems are committed to continuing our work with the private sector to address the challenges facing our nation and to build a better economy for all communities.”
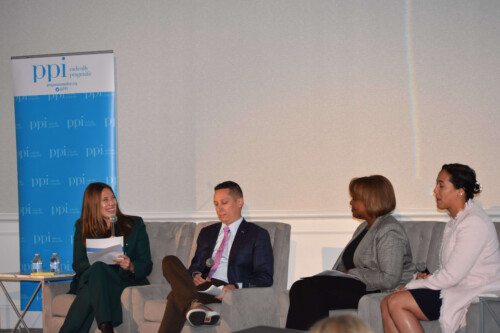
Prior to Representative Kuster’s remarks, Taylor Maag, Director of Workforce Policy and the New Skills for a New Economy Project at PPI, hosted a panel featuring Simone Drakes, Managing Director of Calibrate at United Airlines; Sandy Gordon, VP of People, Experience, and Technology at Amazon, and Ryan Keating, Director of Government Relations at Duke Energy. The panel spoke on the importance of upskilling and investing in the economic advantage of American workers, providing additional training opportunities for current employees, and how to recruit and retain a diverse workforce.
“Employers like Amazon, Duke Energy and United Airlines demonstrate the importance of private sector investment in human capital — especially workforce development. These three companies, all on PPI’s Investment Heroes list, are investing not only in their current workers but in future workers to ensure they are building strong talent pipelines to in-demand jobs. It’s clear these industry leaders are committed to not only maintaining their competitive edge but ensuring more workers share in the economic opportunities their companies have to offer,” said Taylor Maag.
Investment Heroes is an annual report published by PPI since 2012 and analyzes publicly available data to identify the top 25 U.S. companies investing in America, powering job growth, and raising living standards. The theme of this year’s Investment Heroes report is the recovery of the U.S. capital investment from the shock of the COVID-19 pandemic and the benefits these investments provide to workers.
The Progressive Policy Institute (PPI) is a catalyst for policy innovation and political reform based in Washington, D.C., with offices in Brussels, Berlin and the United Kingdom. Its mission is to create radically pragmatic ideas for moving America beyond ideological and partisan deadlock. Learn more about PPI by visiting progressivepolicy.org.
Today, Ed Gresser, Vice President & Director for Trade and Global Markets at the Progressive Policy Institute (PPI) released the following statement in response to the Biden administration’s decision yesterday to withdraw support for critical U.S. digital trade policy proposals at the World Trade Organization (WTO):
“It is deeply troubling to hear that the U.S. is removing its support for WTO digital trade policymaking on issues ranging from cross-border data flows to localization requirements, source code protection, and non-discriminatory treatment of digital products. These policies are sound in principle and proven in practice through such agreements as the U.S.-Korea Free Trade Agreement or USMCA. Finance Committee Chairman Ron Wyden is right to term the U.S. decision as “leaving a vacuum” that others — including authoritarian governments interested in surveillance, data-mining, and censorship — will quickly seek to fill. We share his concern over this decision, and that other technology policy leaders such as Reps. Suzan DelBene and Darin LaHood have expressed.
“We see no evidence that the U.S.’ historic advocacy of free flows of digital data subject to non-discriminatory public-interest regulation, or opposition to the financially and environmentally costly forced localization of servers and other technology, has conflicted in any way with public-interest legislation in the U.S. or elsewhere, or with regulation to protect privacy and security. Rather, we are concerned that a new U.S. passivity on these matters will embolden other governments unhappy with America’s centrality to digital technological development and trade commerce, and lead to the spread of regulatory and antitrust policies aimed differentially at American firms, and in others through de facto legitimation of national firewalling, state surveillance, and censorship.
“The administration, before proceeding further, should step back and return to first principles. In very practical terms, an open internet is indispensable to the well-being of consumers everywhere; to U.S. leadership in IT research, innovation, and technology; and to the jobs and growth underpinned by the U.S.’ world-leading $720 billion in exports of ICT and digitally enabled services. And more conceptually, an open internet is essential to a world economy in which liberty and free flows of information support growth and development, while impartial public-interest regulation targets abusive behavior and protects Internet users. We urge the administration to reflect carefully on the risks a U.S. withdrawal from core e-commerce and digital trade policy development poses to these interests and values, and to reconsider.”
The Progressive Policy Institute (PPI) is a catalyst for policy innovation and political reform based in Washington, D.C., with offices in Brussels, Berlin and the United Kingdom. Its mission is to create radically pragmatic ideas for moving America beyond ideological and partisan deadlock. Learn more about PPI by visiting progressivepolicy.org.