PPI’s Trade Fact of the Week: The number of extremely poor people has fallen by two-thirds since 1990

FACT: The number of extremely poor people has fallen by two-thirds since 1990.

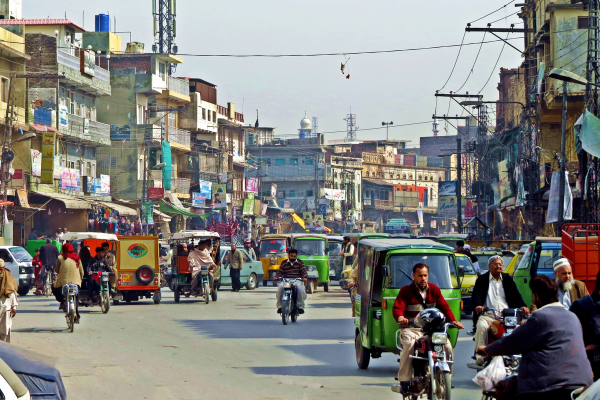
THE NUMBERS: Number of people in extreme poverty* in Pakistan –

2018     10.5 million (5% of the population)

2010     16.8 million (9% of the population)

2000    48.6 million (33% of the population)

1990     70.1 million (65% of the population)

* At or beneath the “extreme poverty” line is defined by the World Bank, at $2.15 per day, PPP basis, in constant 2017 dollars. World Bank estimates; 2018 is the most recent available year.


WHAT THEY MEAN:

Looking back at the post-Cold War/globalization era, what should we see first? Four obvious nominees: the launch of the internet and the creation of the digital world; the China boom; the acceleration of climate change and biodiversity loss; an extended and historically anomalous time of peace among great powers? Here’s a fifth and less visible candidate: the best period in human history for the very poor.

The World Bank’s definition of “absolute” or “extreme” poverty is life at “$2.15 per person per day in constant 2017 dollars as measured in purchasing-power parities.” This is not necessarily “income,” but consumption of a minimal level of food, clothing, and shelter in very poor countries. To illustrate: estimates of annual per capita income in Burundi, currently thought to be the world’s poorest country, range from $700 to $865. This is $1.92 to $2.37 per day, essentially the $2.15 level. A Bank database calculates the cost of a minimally “energy-sufficient” diet at $1.10 per day, about half the typical daily spending of a rural Burundian. A “nutrient-adequate” diet, at $2.93 per day, would be out of reach.

Just after the breach of the Berlin Wall in 1990, about 2 billion of the world’s 5.3 billion people lived this sort of life. A bit more than half, 1.055 billion by the Bank’s estimate, lived in East and Southeast Asia. Another 563 million were close by in South Asia, among them 70 million of Pakistan’s then 115 million people. Sub-Saharan Africa counted 271 million, Latin America and the Caribbean 73 million, just past-Soviet Eastern Europe and Central Asia 15 million, and the Middle East and North Africa 14 million. Over the next three decades:

1990-2000: In the decade of democracy promotion, trade liberalization, and the early Internet, the count of extremely poor people fell by about 200 million as world population grew by 800 million. This left 1.8 billion extremely poor, or 29% of the world’s 6.1 billion people.

2000-2010: As the China boom and its gravitational effects in Southeast Asia, South America, and Africa took hold, another 650 billion moved above the line. Extreme poverty counts fell by two-thirds in East Asia and Southeast Asia, and by half in Latin America, the Middle East, Eastern Europe and Central Asia, to end at 16.9% of world population in the midst of the financial crisis of 2010.

2010-2019: In the decade just passed, extreme poverty fell by another 350 million, nearly vanishing in East and Southeast Asia — down 98% from the 1.06 billion of 1990 to 24 million — and showing the largest absolute-number drop in South Asia (from 430 million to 157 million; as Pakistan’s population topped 230 million, the number of extremely poor Pakistanis fell to 10.5 million). = The global total just before the COVID-19 pandemic was 649 million, or 8.4% of a worldwide 7.8 billion people.

To 2023: The COVID pandemic interrupted this steady downward curve, but perhaps only temporarily. The Bank’s early estimate is that 70 million people fell back into extreme poverty in 2020, but that by last year the total was nearly back to the levels of 2019. With estimates for 2020-22 still tentative, the numbers look like this:

2022     ~655 million of 8.0 billion?

2020     ~714 million of 7.9 billion?

2019      649 million of 7.8 billion

2010      1127 million of 7.0 billion

2000     1782 million of 6.1 billion

1990      1995 million of 5.3 billion

To move above an extreme-poverty line, of course, is to escape destitution and chronic hunger, but to remain poor. But poverty at higher income levels has also fallen, if a bit more slowly — from 56% of the world’s people living on $3.65 per day or less in 1990, for example, to 23% as of 2019%; turning back to Pakistan, 91% lived below this level in 1990, and 40% now. This suggests not only a worldwide reduction in extreme deprivation and chronic malnutrition, but a broader shift toward lower-middle-class life. Social indicators bolster this impression, with world infant mortality down by two-thirds since 1990, girls’ literacy in low-income countries up by half, from 48% to 69%; and life expectancy up 7 years worldwide and 13 years in low-income countries.

Searching for a verdict on the post-Cold War world, then, the creation of the digital world, the growth of Chinese power and industry, environmental stresses, and the era’s then-unappreciated and now-vanishing geopolitical calm remain strong candidates. But the escape of a third of the world’s people from destitution easily stands with them.


Further Readings

Worldwide data and analysis: 

The World Bank’s center for poverty data.

Our World in Data has poverty totals and rates by country from 1967 through 2021.

And the World Bank’s review of poverty in Burundi, 2022.

Two questions:

Why? Explanations for the decline of poverty — extended peace, lower trade barriers and more open markets for poor-country goods, dissemination of new medicines and technologies, better basic education and public health policies — seem mostly complementary rather than contradictory or “enough in itself.” A nominee for “most important,” though, comes from economist Charles Kenny, whose prescient Getting Better: Why Development is Succeeding and How We Can Improve the World Even More (2012) noticed the fall in poverty early and views the core issue as growing intellectual consensus in developing-country governments on good and relatively low-cost policies:

“Poor countries and poor people aren’t stuck in the nightmare of ever-growing and unsupportable population, living on bare subsistence. Instead, those countries with the lowest quality of life are making the fastest progress in improving it — across a range of measures including health, education, and civil and political liberties. The progress is the result of the global spread of technologies and ideas – technologies like vaccination, and ideas like ‘you should send your daughter to school.’”

Read Kenny’s Getting Better.

And can this continue? Some factors suggest it should. Extreme poverty now is concentrated in three ways: (a) in remote rural areas as opposed to cities, where flows of young people to cities and improved infrastructure can help; (b) in sub-Saharan Africa, and the rate of extreme poverty has fallen from 53% to 35% since 1990, though rapid population growth has kept the total number high, and growth and policy trends seem likewise mostly positive, and (c) in conflict zones as opposed to peaceful regions. Others are less promising: a world landscape of high great-power tension, weaker commitment by major economies to openness and integration, and rising economic costs of climate change for poor countries may not be so severe as to reverse the positive trends of 1990-2019, but is likely less friendly to the poor.

Views from Pakistan:

The Pakistan Institute of Development Economics in Islamabad reviews trends over the past two decades (urban vs. rural, by province, children, income vs. nutrition, etc.).

Hina Shaikh at the International Growth Centre looks at next steps.

And a World Bank snapshot.

The role of trade? Three perspectives:

Carolyn Freund and Sanchez-Paramo on trade, poverty, and pro-poor reform, drawn from close analysis of trade impacts in Bangladesh, Sri Lanka, Brazil, Mexico, and South Africa.

PPI’s Ed Gresser last year on renewal of the Generalized System of Preferences, the main U.S. trade preference program for low- and middle-income countries (quick summary: renew and update the GSP, but don’t overdo new eligibility rules).

And the potential of intra-African trade integration to accelerate current growth in per capita income in low-income African countries.

ABOUT ED

Ed Gresser is Vice President and Director for Trade and Global Markets at PPI.

Ed returns to PPI after working for the think tank from 2001-2011. He most recently served as the Assistant U.S. Trade Representative for Trade Policy and Economics at the Office of the United States Trade Representative (USTR). In this position, he led USTR’s economic research unit from 2015-2021, and chaired the 21-agency Trade Policy Staff Committee.

Ed began his career on Capitol Hill before serving USTR as Policy Advisor to USTR Charlene Barshefsky from 1998 to 2001. He then led PPI’s Trade and Global Markets Project from 2001 to 2011. After PPI, he co-founded and directed the independent think tank Progressive Economy until rejoining USTR in 2015. In 2013, the Washington International Trade Association presented him with its Lighthouse Award, awarded annually to an individual or group for significant contributions to trade policy.

Ed is the author of Freedom from Want: American Liberalism and the Global Economy (2007).  He has published in a variety of journals and newspapers, and his research has been cited by leading academics and international organizations including the WTO, World Bank, and International Monetary Fund. He is a graduate of Stanford University and holds a Master’s Degree in International Affairs from Columbia Universities and a certificate from the Averell Harriman Institute for Advanced Study of the Soviet Union.

Read the full email and sign up for the Trade Fact of the Week

The Economic Performance of the Digital Sector Since the Pandemic Started

As we move into 2023, the digital sector still faces the key regulatory issues that dominated the previous year: Competition, privacy, and content moderation. But as the legislative, executive, and judicial branches tackle these critical questions, it is important to look back and assess the performance of the digital sector on the key economic metrics of job growth and inflation.

For clarity we split the digital sector into three subsectors:

  • E-commerce/retail (“movement of goods”)
  • Internet/content/broadband (“movement of data”)
  • Computer/communication manufacturing (“hardware”)


E-commerce/retail: To compete with e-commerce leaders such as Amazon, retailers with a large physical presence such as Walmart and Target have been scaling up their investment in online sales and fulfillment. At the same time, smaller retailers increasingly use online ordering, so the boundary between “brick-and-mortar” and e-commerce has become increasingly porous.  Moreover, privacy and content moderation issues such as accountability for user reviews impact all retailers. In addition to retail, this subsector also includes local delivery (NAICS 492) and fulfillment (NAICS 493).

Internet/content/broadband: With the advent of social networks and streaming, the line between content creation and content distribution has become blurry. Considerations of privacy and content moderation are high on the policy checklist. This subsector includes content creation and distribution (video, audio, print); broadband and broadcasting; wireless; software; internet publishing and search; and computer systems design.

Hardware: Especially with the funding from the CHIPS Act and the focus on export controls, this subsector is facing a different set of policy issues. We include computer and electronic equipment manufacturing, and related wholesaling.

Job Growth

(Note:These figures have been updated to account for the 2/3/23 revisions to the job data)

As of December 2022, the United States currently enjoys a 3.5% unemployment rate, the same as pre-pandemic February 2020. To a large extent, this strong labor market has been driven by job growth in the digital sector. In total the digital sector added 1.4 million net new jobs from 2019 to 2022,  accounting for 67% of net private sector job gains over the same period. Table 1 breaks down the pandemic job growth by digital subsector.

We see that the e-commerce/retail subsector accounted for net job growth of 926,000 jobs from 2019 to 2022, or 44% of private sector job growth, as consumers embraced online shopping during the pandemic, and retailers and third-party logistics companies built and staffed fulfillment centers.

The internet/content/broadband subsector created 472,000 jobs, accounting for 22% of private sector job growth. Altogether, the digital sector accounted for 67% of private sector job growth from 2019 to 2022.

The importance of the digital sector for job growth is emphasized when we look at production and nonsupervisory workers, who generally are less educated and lower-paid (Table 2). The digital sector has created 1.1 million net new production and nonsupervisory jobs from 2019 to 2022,  while the rest of the private sector has lost almost 500,000 production and nonsupervisory jobs.

In particular, the e-commerce/retail subsector has added 812,000 production and nonsupervisory jobs during the three pandemic years. That’s likely to reflect the growth of e-commerce fulfillment and delivery workers. This gain was essential to the recovery because the rest of the private sector has still not regained its pre-pandemic level of production and nonsupervisory employment.

From the perspective of policy, the current regulatory structure turned out to encourage strong job growth in a difficult economic environment. That’s not to say the current regulations cannot be improved, but we should be wary of making major changes without understanding the consequences for jobs.

Table 1. Digital Sector Drives Job Growth During Pandemic
2019-2022
Increase in jobs, thousands Share of private sector growth
Private sector 2,133
E-commerce/retail* 926 44%
Internet/content/broadband** 473 22%
Hardware*** 22 1%
Data: BLS, PPI calculations


Table 2. …Especially for Production and Nonsupervisory Jobs
2019- 2022
Increase in production and nonsupervisory jobs, thousands Share of private sector growth
Private sector 665
E-commerce/retail* 812 122%
Internet/content/broadband** 306 46%
Hardware*** 24 4%
Data: BLS, PPI calculations


Inflation

Before the pandemic, the digital sector had significantly lower inflation than the economy as a whole, whether measured by producer prices or consumer prices. During the pandemic period, overall consumer price inflation accelerated by approximately 3 percentage points, from roughly 1.5% annually in the pre-pandemic period (2012-2019) to roughly 4.5% annually during the pandemic years (2019-2022).

However, the acceleration of inflation was much smaller in the digital subsectors. For example, inflation in the internet/content/broadband subsector only accelerated by 0.3 percentage points when measured by producer prices, and 1.7 percentage points when measured by consumer prices.

Please note that the BLS does not publish a separate measure of e-commerce inflation for consumer goods and services, which is why that line is missing from Table 4. However, in a 2022 paper written for PPI’s Innovation Frontier Project, Marshall Reinsdorf wrote that “the pandemic greatly accelerated adoption of digital innovations such as e-commerce, so it’s reasonable to suspect that the price statistics are undercounting the impact of low digital inflation.”

From the perspective of policy, it’s reasonable to say that the current regulatory structure allowed digital companies to behave in a way that muted the pressure to increase prices. Especially given the inflationary bias in today’s economy, the government should be wary of making changes that impose large new costs on digital companies.

Table 3. Digital Producer Price Inflation Stays Low
Average annual price increase
2012-2019 2019-2022 Increase in inflation rate, percentage points
Final demand less food and energy 1.7% 4.7% 3.0%
Electronic and mail order shopping services* 1.5% 1.8% 0.3%
Internet/content/broadband** 0.7% 1.6% 0.9%
Hardware*** -1.0% 1.1% 2.1%

Based on median inflation for subsectors with multiple products or industries.

Data: BLS, PPI calculations


Table 4. Digital Consumer Price Inflation Stays Low
Average percentage price increase
2012-2019 2019-2022 Increase in inflation rate, percentage points
Consumer prices 1.5% 4.6% 3.1%
Internet/content/broadband** -0.4% 1.3% 1.7%
Hardware*** -7.6% -5.6% 1.9%

Based on median inflation for subsectors with multiple products or industries.

Data: BLS, PPI calculations


Appendix: Categories

In this section we define the three digital subsectors, and which statistical series we use to calculate jobs, producer price inflation, and consumer price inflation for each of them. Please note that for subsector inflation measures, we aggregate multiple price series using median inflation rather than weighted means.

*E-commerce/retail

In previous work, we distinguished between ecommerce and brick-and-mortar retail. That distinction is no longer appropriate, because retailers with large physical presence such as have also been building out their online ordering and fulfillment operations. Moreover, the latest NAICS codes do not break out electronic shopping as a separate industry anymore.

Employment data

  • Retail sector (including online ordering and fulfillment operations for single companies)
  • Couriers and messengers (including local delivery)
  • Warehousing and storage (including fulfillment centers)


Producer price inflation data

  • Electronic and mail order shopping services


** Internet/content/broadband

In earlier work, we used a narrower definition of tech. As barriers have become blurred between content and distribution, and various modes of distribution, it has become appropriate to broaden the definitions.

Employment data

  • Motion picture and sound recording industries
  • Publishing industries, including software
  • Broadcasting and content providers, including social networks and streaming services
  • Telecommunications
  • Computing infrastructure providers, data processing, and web hosting, including cloud computing
  • Web search portals, libraries, archives, and other information services.
  • Computer systems design and related services


Producer price inflation data

  • Bundled access services
  • Cable and other subscription programming
  • Data processing and related services
  • Internet access services
  • Internet publishing and web search portals (including advertising)
  • Software publishers
  • Video programming distribution
  • Wireless telecommunications carriers
  • Information technology (IT) technical support and consulting services (partial)


Consumer price inflation data

  • Wireless telecom services
  • Residential telecom services
  • Internet services and electronic information providers
  • Cable and satellite television service
  • Video discs and other media
  • Recorded music and music subscriptions


***Hardware

In previous work, we did not split out hardware. But the recent CHIPS legislation, and the focus on rebuilding the U.S. domestic semiconductor industry, means that it is appropriate to break out hardware separately. We note that the employment data includes relevant wholesalers, who may be “factoryless” firms designing and marketing digital products, but not actually manufacturing them.

Employment data

  • Computer and electronic product manufacturing
  • Computer and computer peripheral equipment and software merchant wholesalers


Producer price inflation data

  • Communications equipment manufacturing
  • Computer & peripheral equipment manufacturing
  • Semiconductor and other electronic component manufacturing


Consumer price inflation data

  • Computers and peripherals
  • Computer software
  • Telephone hardware, calculators, and other consumer information items
  • Televisions

PPI’s Mosaic Project Announces Applications Open for Upcoming Women Changing Policy Workshop Focused on Broadband and Bridging the Digital Divide

PPI’s Mosaic Project announced today that the application portal for the project’s upcoming “Women Changing Policy Workshop” is now open. The next cohort of women will meet March 27 to March 29, 2023, and will focus exclusively on empowering broadband experts and women working to bridge the digital divide.

“Between the Biden Administration’s American Rescue Plan Act and the Bipartisan Infrastructure Law alone, the federal government has pledged to spend an unprecedented $90 billion to ensure affordable and accessible internet connection. Now more than ever, we need strong female voices leading these policy conversations around equitable allocation and responsible spending,” said Jasmine Stoughton, Project Director.

This is the sixth Women Changing Policy workshop. Previous workshops have included exclusive and candid conversations with seasoned media professionals, policy leaders, and representatives from the U.S. Congress.

Applicants should be well-established in their careers and eager to grow their public profile with the goal of positively impacting the policy landscape. This workshop will be held in person in Washington, D.C., and the deadline to apply is Friday, March 10.

Interested applicants should apply here.

The Mosaic Project is an initiative of the Progressive Policy Institute that aims to put more women at the forefront of policymaking. The same handful of well-known men have dominated key policy conversations for decades, resulting in legislative outcomes that fail to reflect the richness of our society. It is the project’s mission to empower expert women with the tools and connections needed to engage with the media and lawmakers on today’s toughest policy challenges.

The Progressive Policy Institute (PPI) is a catalyst for policy innovation and political reform based in Washington, D.C. Its mission is to create radically pragmatic ideas for moving America beyond ideological and partisan deadlock. Learn more about PPI by visiting progressivepolicy.org.

Follow the Progressive Policy Institute.

Follow the Mosaic Project.

###

Media Contact: Aaron White – awhite@ppionline.org

Ritz for The Hill: New House Majority Shows Its True Colors on ‘Fiscal Responsibility’

By Ben Ritz, Director of PPI’s Center for Funding America’s Future

Republicans in Congress have been eager to position themselves as the fiscally responsible counterweight to what they consider budget-busting and inflation-increasing overspending from the Biden administration. But just two weeks into their new majority, House Republicans have shown their true colors and it’s more likely than not that they will make our nation’s fiscal problems even worse.

The first bill passed by the new majority would repeal $71 billion in new funding for taxpayer services and enforcement by the IRS that Democrats passed last Congress. But an official score from the nonpartisan Congressional Budget Office found that this bill would also reduce revenue collections by $186 billion over the next decade because it would undermine the agency’s ability to make wealthy tax cheats pay what they owe. As a result, the first act by the new House majority would actually increase deficits by roughly $114 billion.

Read the full piece in The Hill

PPI’s Trade Fact of the Week: The U.S. has not in the past defaulted on debt

FACT: The U.S. has not in the past defaulted on debt.

THE NUMBERS: Countries defaulting on debt obligations in this decade

2023?      United States??
2022        Ghana
2022        Sri Lanka
2022        Russia
2020        Zambia
2020        Argentina
2020        Ecuador
2020        Lebanon

WHAT THEY MEAN:

Alexander Hamilton’s Report on Public Credit (January 1790) recommends borrowing for public investment and rigorous commitment to pay the bills.  His take on defaults:

“[W]hen the credit of a country is in any degree questionable, it never fails to give an extravagant premium, in one shape or another, upon all the loans it has occasion to make. Nor does the evil end here; the same disadvantage must be sustained upon whatever is to be bought on terms of future payment. From this constant necessity of borrowing and buying dear, it is easy to conceive how immensely the expenses of a nation, in a course of time, will be augmented by an unsound state of the public credit.”

Hamilton’s 77 successors as Treasury Secretary have followed this guidance, paying the bills steadily (with a minor, technical, and instructive exception in 1979) through troubles ranging from the extinction of Hamilton’s Federalist Party in 1808 to the foreign military occupation of Washington in the War of 1812, the Civil War, the Depression, etc. Rogoff & Reinhart list 15 other governments in a relatively small group of never-defaulters: Canada, Denmark, Belgium, Finland, Hong Kong, South Korea, Malaysia, Mauritius, New Zealand, the Netherlands, Norway, Singapore, Switzerland, Thailand, and the United Kingdom.

The post-Hamilton streak is now in some danger, as Congressional Republicans threaten to refuse to raise the U.S.’ “debt ceiling” later this year. This is an accounting device unique to the United States, invented during World War I to avoid separate Congressional votes on every Treasury bond issue; its thesis is that Congress must not only authorize spending and borrowing but later and separately authorize repayment of borrowed money. PPI’s budget and tax director Ben Ritz explains:

“This vote is separate from the decision to set tax and spending policies — raising the debt limit merely allows the Treasury to borrow money to cover the difference between spending and revenue levels as determined by legislation Congress previously enacted.”

What would it mean to go into default?  Even the theoretical possibility can be costly: similar threats to block a debt-ceiling increase in 2011 led ratings agency Standard & Poors to cut the U.S.’ credit rating from AAA to AA+, on the grounds that though that summer’s agreement “removed any immediate threat of payment default,” the agreement itself meant that “the statutory debt ceiling and the threat of default have become political bargaining chips in the debate over fiscal policy,” thus making the U.S. less credit-worthy. The U.S. has not since regained its AAA rating. Alternatively, the 1979 event, when the Treasury Department missed an interest payment not deliberately but because its check-writing machines freakishly broke down and took a few hours to fix, led to an 0.6 percent increase in U.S. interest rates lasting almost a year.

Obviously, a deliberate and prolonged default would carry much higher costs.  In practical terms, after 23 default-free decades, this week’s ten-year Treasury bonds carry yields of 3.58 percent and U.S. government net interest payments for 2022 were $399 on $30.9 trillion in debt.  Analysts guess that each additional interest point would raise U.S. taxpayers’ interest bill by about $180 billion per year, and as one point of reference, Greece’s financial crisis default left the country with a bond yield of 10.14%. Borrowing Hamilton’s vocabulary, this could probably reasonably be termed an “extravagant premium,” an “immense augmentation” of public expense, and an “evil” that would not end quickly.

Nor would interest rates and payments be the only consequence.  The International Monetary Fund’s terse summary of Lebanon’s 2022 economic outlook reads “sovereign default in March 2020, followed by a deep recession, a dramatic fall in the value of the Lebanese currency, and triple-digit inflation”. Should the U.S. enter a Lebanon- or Sri Lanka-like situation after a Congressional failure to raise the debt ceiling, the details are unpredictable but the outlook for the domestic economy would be broadly similar, amplified by a potential global financial crisis given the scale of the U.S. economy and the role of Treasury bonds as a foundation of worldwide finance.

With all that in the offing, here is Ritz’s advice for the administration.

Further Readings

Then:

Hamilton’s Report on Public Credit, 1790

Now:

PPI’s Ben Ritz on the debt ceiling, default, and administration options, 2023

The Congressional Budget Office on current debt.

Council of Economic Advisers Chair Cecilia Rouse on the potential consequences of default.

And the International Monetary Fund explains its most recent agreement with post-default Lebanon.

And three perspectives from the 2011 debt-ceiling threats:

Standard & Poors explains the U.S.’ downgrade from AAA to AA+.

The Tax Policy Center’s Donald Marron recalls the unintentional but costly micro-default of 1979.

And former IMF economist Simon Johnson speculates on the gruesome private-sector consequences of a U.S. default. Samples: “A collapse in U.S. Treasury prices … would destroy [private banks’] balance sheets. … There would be a massive run into cash, on an order not seen since the Great Depression … private sector in free fall, consumption, and investment would decline sharply.  … [u]nemployment would quickly surpass 20 percent.”) The full text, short but grim.


ABOUT ED

Ed Gresser is Vice President and Director for Trade and Global Markets at PPI.

Ed returns to PPI after working for the think tank from 2001-2011. He most recently served as the Assistant U.S. Trade Representative for Trade Policy and Economics at the Office of the United States Trade Representative (USTR). In this position, he led USTR’s economic research unit from 2015-2021, and chaired the 21-agency Trade Policy Staff Committee.

Ed began his career on Capitol Hill before serving USTR as Policy Advisor to USTR Charlene Barshefsky from 1998 to 2001. He then led PPI’s Trade and Global Markets Project from 2001 to 2011. After PPI, he co-founded and directed the independent think tank Progressive Economy until rejoining USTR in 2015. In 2013, the Washington International Trade Association presented him with its Lighthouse Award, awarded annually to an individual or group for significant contributions to trade policy.

Ed is the author of Freedom from Want: American Liberalism and the Global Economy (2007).  He has published in a variety of journals and newspapers, and his research has been cited by leading academics and international organizations including the WTO, World Bank, and International Monetary Fund. He is a graduate of Stanford University and holds a Master’s Degree in International Affairs from Columbia Universities and a certificate from the Averell Harriman Institute for Advanced Study of the Soviet Union.

Read the full email and sign up for the Trade Fact of the Week

Ritz for Forbes: How Washington Can Avert A Disastrous Debt Default With A Weak House Speaker

By Ben Ritz, Director of PPI’s Center for Funding America’s Future

It took Representative Kevin McCarthy 15 ballots to be elected House speaker last week — the longest such contest since before the Civil War. Now McCarthy’s concessions to the far right in that process will leave him as the weakest speaker in generations and likely lead to the most dangerous game of budget brinkmanship in Washington since 2011. Leaders across both parties must work quickly to avoid an unprecedented debt default disaster.

Read the full piece in Forbes

MOSAIC MOMENT: 4 Bipartisan Financial Imperatives for the 118th Congress

On this month’s Mosaic Moment, program director and host, Jasmine Stoughton sits down with Kirsten Wegner, CEO of the Modern Markets Initiative to talk about her latest op-ed outlining the four bipartisan imperatives to ensure safe and sound capital markets.

Kirsten unpacks what’s working well for investors and shares her bipartisan recommendations for improving the existing market structure. They talk about ideas for regulating the digital assets market and explore the role Congress can play in advancing the research and development of financial technologies such as AI and automated traders.

Check out Kirsten’s op-ed “Safe and Sound Capital Markets Are a Bipartisan Imperative” in RealClearMarkets.

Follow Kirsten Wegner on Twitter.

Follow Mosaic on Twitter.

Follow PPI on Twitter.

Pankovits for The Hill: Charter school innovation shouldn’t come at the expense of constitutional protections for students

By Tressa Pankovits, Co-Director of PPI’s Reinventing America’s Schools Project

On Monday, we’ll likely learn whether the U.S. Supreme Court granted a writ of certiorari(review of a lower court’s decision)during its first conference of 2023 on Jan. 6 in a public charter school case with constitutional implications. The case is a battle over school uniforms — skirts, to be precise. But don’t let the seemingly trivial subject matter fool you. Much more than a mere sartorial regulation is at stake, as demonstrated by the plethora of amicus briefs filed by conservative religious organizations urging the court to take the case.

Peltier et al. v. Charter Day School was prompted by three North Carolina parents’ distaste for Charter Day School’s (CDS) requirement that their daughters wear only skirts to school. Pants, after all, are warmer in winter. The girls also complained of feeling reticent to use playground equipment or crawl on the floor during active shooter drills and felt discouraged that they weren’t as deserving of freedom of movement as their male classmates.

After the school refused to change its policy, the parents sued for discrimination under the equal protection clause of the Constitution, Title IX and CDS’s contractual agreement with the North Carolina Board of Education, which requires charter schools to abide by all constitutional mandates.

Read the full piece in The Hill. 

PPI’s Trade Fact of the Week: American families have cut their bills for clothes and shoes by nearly two-thirds in 50 years

FACT: American families have cut their bills for clothes and shoes by nearly two-thirds in 50 years

THE NUMBERS:  Average purchases per person –

2021:       69 garments, 7.4 pairs of shoes; 2.6% of family budgets
2000:     66 garments, 6.6 pairs of shoes; 4.9% of family budgets
1991:       40 garments, 5.4 pairs of shoes; 5.9% of family
1972/3:   28 garments, shoes n/a (3 to 4 pairs?); 7.8% of family budgets

* Purchasing totals from American Apparel & Footwear Association; budget share from BLS Consumer Expenditure Survey. As noted below, the 1972/3 survey (like other pre-1991 Consumer Expenditure surveys) was a two-year composite.

WHAT THEY MEAN:

A look at affluence through a couple of shopping stats:

(1) According to the American Apparel & Footwear Association, American families bought 69 garments and 7.4 pairs of shoes in 2021. And
(2) the Bureau of Labor Statistics “Consumer Expenditure Survey” (“CEX”), which has tracked spending on these items for 121 years, reports that in that year the average family spent $1,754 on this wardrobe upgrade, which was about 2.6% of their year’s total $66,928 budget.

To scroll back through a half-century of CEX archives* is to see, as time passes, these life necessities taking up steadily smaller shares of family spending as the vanished exotic world of the early 1970s (black-and-white TV, AM radio, phone booths, energy crises, smoky air) evolved into 2020s America. Changes in logistics, retail practices, and trade policy (computer networks, on-line shopping, and big-box stores; goods carried in slow and small break-bulk shipping rather than large-scale container lines; emergence of large light-manufacturing industries in Asia, Latin America, and Africa; elimination of a complex clothing import-quota system and some tariff-cutting mainly in luxury goods) mean that annual clothing and shoe spending in dollar terms has barely changed even as incomes rose, inflation nibbled at dollar value, and mall trawls and on-line shopping binges returned larger and larger sacks of shirts, shoes, socks, brassieres, etc. The figures look like this:

2021:      2.6% of family budget ($1,754 of $66,298)
2011:       3.5% of family budget ($1,740 of $49,705)
2006:     3.9% of family budget ($1,835 of $48,398)
2001:      4.4% of family budget ($1,743 of $39,518)
1991:        5.9% of family budget ($1,735 of $29,614)
1984/5:   6.0% of family budget ($1,319 of $21,975)
1972/3:   6.8% of family budget ($565 of $8,270)

* The 1972/1973 and 1984/1985 editions are two-year surveys. Regular annual CEX’s begin in the late 1980s.

Thus Americans (a) buy about twice as many garments and pairs of shoes as their grandparents did 50 years ago but (b) have cut their budgets for these products by almost two thirds. This is the equivalent of shifting about 4.2% of family spending in 2021 –$2,800, the equivalent of two weeks’ worth of income — away from necessities and toward savings, education, entertainment, and so on. On a shorter scale since 2001, the shift is about 1.8% of spending, or about $1,200.

The families most in need of help — single parents — see slightly larger benefits from this evolution than wealthier households. The CEX reports show that in 2021 the 9 million single-parent families spent an average of $49,811 to spend, with $2,254 or 4.5% of the family budget** used for shoes and clothes. These figures don’t go back quite as far as whole-family reports, but the comparable single-parent figure was $1,763, or 8.1% of a $21,653 budget, on shoes and clothes; thus single parents have been able to re-purpose about 3.6% of their budget.

Note: PPI staff thanks the AAFA for providing the figures on shoe and apparel purchasing, and BLS Consumer Expenditure Survey staff for quick and efficient help in sending archived CEX surveys.


Further Readings

Data:

The homepage for the Bureau of Labor Statistics’ Consumer Expenditure survey.

Trade policy summary:

To what extent does “trade policy,” in the sense of negotiations and agreements, deserve credit for these falling costs? Two background points:

(1) Shoe and clothing tariffs have changed little over time, having been excluded from tariff reductions in the GATT agreements of 1969 (“Kennedy Round”), 1974 (“Tokyo Round”) and 1993 (“Uruguay Round”). The main change is that a “quota system” regulating in extraordinary detail the number of sweaters, socks, towels, etc. countries could send to the U.S., introduced by the Nixon administration in 1974, came to an end in 2004.

(2) Since 1983, Congress along with the Reagan, Bush, and Clinton administrations developed a series of “preference” programs for clothing and passed a set of Free Trade Agreements, which together removed tariffs from $17 billion of the U.S.’ $102 billion in clothing imports in 2021, and a very modest $0.9 billion of $27.2 billion in shoe imports.

The end of the quota system likely had a large price effect; those of the FTAs and preferences were smaller, but not zero. Tariffs on lower-priced clothes and shoes continue to be the big sources of tariff money, accounting for about half of the permanent tariff system but a lower share of overall tariff revenue since the Trump administration. PPI’s Ed Gresser on the tariff system’s regressive nature, and its ineffectiveness as a job or production protector.

The really big picture:

The Consumer Expenditure Survey is one of the world’s oldest continuous social-science surveys, launched in 1888 by the otherwise unmemorable administration of Benjamin Harrison.  In 2006, the BLS reprinted the core data from the surveys of 1901, 1936, 1950, 1960, 1972/73 and 1984/1985. Their long look back finds that in times remembered as opulent, sunny and calm — the Gilded Age, the post-war boom, the New Frontier, etc. — Americans lived pretty close to the bone. The three big necessities — food, shelter, and clothes — ate up four-fifths of family income a hundred years ago, and over two-thirds in the 1950s.

Food costs, a gigantic share of family budgets a century ago, fell by half from 1900 to 1970, and by another third since. Clothing costs have drifted steadily down with postwar trade opening and logistical innovation, halving from 1950 to 1980, and then halving again since. Spending on housing, meanwhile, has steadily risen* – 23.3% in 1901, 30.6% in 1972, 32.9% in 2001, 33.8% in 2021 — eating away some of the benefits of lower food and clothing costs. Only until quite recently, however, have the three big life necessities — food, shelter, and clothing — fallen below half of a typical family’s budget. A summary of budget shares for all households over 121 years:

BLS’ long look back at a century of consumer spending.

* The CEX includes home furnishings, utilities, repairs, and laundry services in its “housing” category, so this goes beyond rent and mortgage payments. The available services before 1984 also include these payments, but unlike the post-1991 series does not separate them out. So the table above uses the larger category, which includes some discretionary spending going beyond the ‘roof over the head’ necessity.

ABOUT ED

Ed Gresser is Vice President and Director for Trade and Global Markets at PPI.

Ed returns to PPI after working for the think tank from 2001-2011. He most recently served as the Assistant U.S. Trade Representative for Trade Policy and Economics at the Office of the United States Trade Representative (USTR). In this position, he led USTR’s economic research unit from 2015-2021, and chaired the 21-agency Trade Policy Staff Committee.

Ed began his career on Capitol Hill before serving USTR as Policy Advisor to USTR Charlene Barshefsky from 1998 to 2001. He then led PPI’s Trade and Global Markets Project from 2001 to 2011. After PPI, he co-founded and directed the independent think tank Progressive Economy until rejoining USTR in 2015. In 2013, the Washington International Trade Association presented him with its Lighthouse Award, awarded annually to an individual or group for significant contributions to trade policy.

Ed is the author of Freedom from Want: American Liberalism and the Global Economy (2007).  He has published in a variety of journals and newspapers, and his research has been cited by leading academics and international organizations including the WTO, World Bank, and International Monetary Fund. He is a graduate of Stanford University and holds a Master’s Degree in International Affairs from Columbia Universities and a certificate from the Averell Harriman Institute for Advanced Study of the Soviet Union.

Read the full email and sign up for the Trade Fact of the Week

Marshall for the Hill: Putin calls up ‘General Winter’

By Will Marshall, President

As frigid Arctic winds sweep across Europe, Russian President Vladimir Putin’s attempt to weaponize winter is being put to the test. He’d like to see Europeans shivering in the dark, calculating that a long, cold winter will crack their resolve to stand with Ukraine.

Before invading Ukraine last February, Russia was Europe’s chief supplier of natural gas. Now it’s shut down most of its pipelines, making good on Putin’s threat last fall to “freeze” Europe unless its leaders lift stringent economic sanctions on Moscow.

Spiking energy costs have already sparked street protests in several European capitals. It’s possible, however, that Putin’s call-up of “General Winter” will prove to be yet another in a long chain of miscalculations that have turned his “special military operation” into a strategic horror show for Russia.

To Moscow’s long-term detriment, European countries are buying gas elsewhere: Norway, Holland, Qatar, Nigeria and, increasingly, the United States. Despite a dearth of LNG (liquified natural gas) terminals in Europe, U.S. companies managed to nearly triple natural gas exports to the continent this year by diverting supplies destined for other parts of the world. EU countries have been filling underground storage tanks, praying for a short and mild winter.

Read the full piece in The Hill.

PPI’s Trade Fact of the Week: New Year’s Eve in American Samoa comes 24 hours after New Year’s Eve in the Republic of Samoa

FACT: New Year’s Eve in American Samoa comes 24 hours after New Year’s Eve in the Republic of Samoa.

THE NUMBERS:  

Number of countries agreeing to World Standard Time, 1884:        25
Number of countries operating on World Standard Time, 2022:     All

WHAT THEY MEAN:

10 … 9 … 8 …

Ten days from now, the residents of the atolls, fishing towns, tourist resorts, and farm communities of the island countries just west of the International Date Line’s odd east-lobe will be the first happy few to cross into 2023: Fiji, Kiribati, Tonga, and Samoa. Precisely an hour after the fireworks in Samoan capital Apia come larger events in Auckland and Wellington, which lie one meridian to the west of the Date Line. Then as meridian lines flash by, Sydney and Tokyo turn up after another hour; then Bangkok and Ulan Baatar, Muscat and Tehran; Ankara, Jerusalem, and Nairobi; Geneva, Paris, and Lagos; and London on the Prime Meridian exactly twelve hours off the Date Line.  Canada’s Maritime Provinces follow five hours later, then come Washington, Mexico City, Callao and Los Angeles, etc.  The very last New Year’s event, on the east edge of the Data Line, turns out to be in Pago Pago, the capital of American Samoa, which forty miles southeast of the first midnight in Apia. So an enterprising American Samoa resident can charter a plane to test out 2023, see what’s like, and return for nearly a day to 2022.

More on the odd Samoan anomaly in a bit. But how is it that everyone, everywhere in the world, knows exactly when when the clocks hit midnight and their New Year begins?

The global system of time zones and meridian lines is a legacy of 19th century “globalization” in the era of steamships, Suez Canal-digging, the first undersea telegraph cables, and the questions they posed.  Though clocks date back to classical times, and watches to the 15th century,* no standardized times existed at all until the early 19th century, and even by the 1870s different governments, towns, and private companies kept their own individual times.  A survey in the U.S. found at least 144 different city, town, railway, and bank times; nor did national times, to the extent they existed, in Europe, match well.  High noon in Victorian London, for example, was 12:09.21 in Paris.  This brought risk as 19th century “globalization” accelerated, as different times in different towns meant confusion, missed railway connections, and accidents as trains or boats using different ‘times’ arrived simultaneously in ports and terminals.

The inspiration of President Chester A. Arthur** was to call an international conference in Washington to settle on a common time, drawing on earlier international-standardization agreements, such as those on international patent and copyright conventions, and especially the 1875 Paris Conference which decided how long a “meter” would be, the volume of water in a liter, and how much a “gram” would weigh.  Mr. Arthur convened a 26-nation International Meridian Conference on October 13, 1884, in the old State Department building, now the Eisenhower Executive Office Building, on 17th Street, involving ten Latin countries, ten Europeans (with the UK delegation also representing Canada and India), the U.S., Japan, Liberia, the Ottoman Empire, and the Kingdom of Hawaii. It closed on the 22nd with the basics of the modern global time system in place: 24 world time zones (originally a Canadian concept), each an hour apart, with the international standard “noon,” or Prime Meridian, set for 12:00 p.m. at the Greenwich Naval Observatory near London.***

Fourteen decades later the Conference standards are still used almost everywhere.**** and its outcome remains the foundation of 21st century air traffic control, just-in-time production networks, and Canal transits, as well as synchronized New Year’s Eve events. The role of the two Samoas as the dividing line between years turns out to be a very recent innovation: The Republic decided to jump across the Date Line ten years ago to synchronize its work week with Australia and New Zealand, and will therefore live for a day in 2023 before its American sister arrives.

… 4 … 3 … 2 … 1

*Babylonians get credit for the 60-minute hour, Egyptians the 24-hour day; Song dynasty Chinese astronomers for the first fully mechanical clock, and 16th-century Germans the personal watch.
**Elected Vice President in 1880; succeeded James Garfield after Garfield’s death in 1881; not re-nominated.
***The choice reflected the fact that three-quarters of international shipping used it already. The U.S. had adopted the Greenwich meridian for all railway time in 1883.  Disgruntled France, supported by Brazil and Haiti, wanted a ‘neutral’ Prime Meridian in the middle of the Atlantic, and held out against Greenwich time until 1911.
**** With some partial exceptions. Iran, Afghanistan, India and Burma, plus bits of Australia and Canada operate a half hour off the rest of the world. Nepal runs either fifteen minutes slow or forty-five minutes into the future. All still, however, operate in the Conference framework, so the minutes and hours start tat the same time.


Further Readings

The official U.S. clock, based at the U.S. Naval Observatory, is said to be accurate to within one second every 1.4 million years. Watch this one if you *really* want to be precise this New Year’s Eve.

The Greenwich Observatory recounts the history of the International Meridian Conference. The official record of the proceedings (sample: “Mr. Lefaivre, Delegate from France, stated that on behalf of his colleague he would suggest that all motions and addresses made in English should be translated into French”): is here.

From Wikipedia, a country-by-country table of New Year’s entry into force.

And how the Republic of Samoa jumped the Date Line.

Best alternative ever:

Intense, rapidly modernizing Meiji-era Japan attended the Conference on Meridian represented by physicist and university president Kikuchi Dairoku, watched and said little, and faithfully adopted its recommendations. Sad to say, this entailed abandoning a genuinely brilliant and humane local system — “seasonal time,” in which summer hours were longer than winter hours. To mesh this excellent idea with office hours and business schedules, Edo-era artisans had designed specialized clocks known as “wadokei” whose hours ran slow in summer and fast in winter. The Japan Clock and Watch Association explains, with some remarkable pictures.

Sic transit: 

The White House’s “warts-and-all” biography of President Chester Alan Arthur, including Arthur’s not-very-admirable career as a federal trade policy appointee(“[As] Collector of the Port of New York, Arthur effectively marshaled the thousand Customs House employees under his supervision on behalf of Roscoe Conkling’s Stalwart Republican machine”), and more, but Meridian Conference entirely.

SPECIAL NOTE: PPI will close for the holidays this Friday, and the Trade Fact service will take next week off. We wish friends and readers a happy holiday season, and will see you in the New Year, precisely at 2:00 p.m. EST, six hours after the Prime Meridian’s 2:00, on Jan. 3.


ABOUT ED

Ed Gresser is Vice President and Director for Trade and Global Markets at PPI.

Ed returns to PPI after working for the think tank from 2001-2011. He most recently served as the Assistant U.S. Trade Representative for Trade Policy and Economics at the Office of the United States Trade Representative (USTR). In this position, he led USTR’s economic research unit from 2015-2021, and chaired the 21-agency Trade Policy Staff Committee.

Ed began his career on Capitol Hill before serving USTR as Policy Advisor to USTR Charlene Barshefsky from 1998 to 2001. He then led PPI’s Trade and Global Markets Project from 2001 to 2011. After PPI, he co-founded and directed the independent think tank Progressive Economy until rejoining USTR in 2015. In 2013, the Washington International Trade Association presented him with its Lighthouse Award, awarded annually to an individual or group for significant contributions to trade policy.

Ed is the author of Freedom from Want: American Liberalism and the Global Economy (2007).  He has published in a variety of journals and newspapers, and his research has been cited by leading academics and international organizations including the WTO, World Bank, and International Monetary Fund. He is a graduate of Stanford University and holds a Master’s Degree in International Affairs from Columbia Universities and a certificate from the Averell Harriman Institute for Advanced Study of the Soviet Union.

Read the full email and sign up for the Trade Fact of the Week

Ben Ritz on omnibus spending bill

PPI’s Ben Ritz, Director of the Center for Funding America’s Future, released the following statement about the omnibus spending package:

Once again, Congress has waited until the last minute to carry out its most basic responsibility: funding the federal government’s normal operations. Thanks to a combination of brinkmanship and procrastination by leaders on both sides of the aisle, lawmakers will soon be forced to choose between voting for roughly $1.7 trillion of spending with little time to review legislative text or shutting down the government. This is no way to run a country.

The omnibus appropriations bill increases federal discretionary spending next year at a rate faster than overall economic growth. Boosting fiscal stimulus is exactly what lawmakers should not be doing with inflation still running at over 7%. Instead, Congress should be pursuing a fiscal policy that supports the Federal Reserve’s efforts to rein in rising prices.

It’s disappointing that, despite the increase in overall spending levels, it appears appropriators have failed to fund federal R&D efforts at the targets authorized by the CHIPS and Science Act passed earlier this year. The omission of much-needed permitting reforms also will reduce the efficacy of infrastructure investments Congress passed earlier this session. Together, these decisions represent a setback for the restoration of bold public investment that this Congress had been on track to accomplish.

But the package could have been worse. With the exception of some retirement provisions that are offset by gimmicks, the omnibus is mostly free of deficit-financed tax cuts that usually ride on end-of-the-year packages such as this. Although it would have been best for negotiators to agree on a fiscally responsible compromise to restore the pre-2022 tax treatment of R&D expenses and some expansion of the Child Tax Credit, their decision to omit these policies rather than to further fuel inflation by borrowing to pay for them was the right one.

It’s also good news that the omnibus will strengthen democracy at home and abroad through improvements to the Electoral Count Act and additional military assistance to help the Ukrainian people stand up to Russia’s brutal war of conquest.

Perhaps the next Congress could notch another win for democracy by following a rational and transparent budget process next time around. That shouldn’t be too much to ask of America’s elected representatives.

Give the children’s online protection bills the due process they need

President Biden began the year calling on Congress to pass stronger digital privacy protections for minors. Now, with just two weeks left in 2022, there is talk that the Senate is looking to fulfill that request by adding two major children’s online privacy and safety bills to the potential omnibus spending package.

Protecting young people online is a challenging task. Both digital privacy and content moderation have proven challenging in a legislative, constitutional, and technical context. Adding these bills to the omnibus spending package does not give the topics the due process and consideration they deserve. A better focus for Congress would be to pass universal privacy protections and then augment those protections with youth privacy and online safety rules.

Though the bills have different sponsors and come from different committees, together they address the two most important areas of online safety for children: privacy and child-appropriate content. One, the Children and Teens’ Online Privacy Protection Act, would protect the online privacy of anyone under 16 years old. The second bill, the Kids Online Safety Act (KOSA), is a youth content moderation bill that seeks to prevent young people from seeing harmful content on the websites they access.

The Children and Teens’ Online Privacy Protection Act is an update to the current children’s privacy regulation, the 1998 Children’s Online Privacy and Protection Act (COPPA). The current regulation is straightforward. It applies to companies knowingly handling data of youth under 13 years old. To comply with COPPA, firms must gain consent from parents before collecting children’s data and “implement reasonable procedures to protect the security” of that data. The Children and Teens’ Online Privacy Protection Act updates the current rules, taking into account the changes in the digital landscape in the last 25 years.

First, the new bill would increase the age requirement for parental consent to 16. Next, it limits the use of children’s personal data and adds privacy and security requirements for children’s data. The bill makes it illegal to show targeted ads to youth, adds a digital marketing bill of rights to limit data collection of minors, and requires platforms to create privacy dashboards for parents to see how sites use youth data.

As PPI has previously written, in its current form, COPPA has always been difficult to enforce because there is no easy way to check if a website user is under 13 years old. The new legislation, while providing pragmatic and relevant updates to the original text, risks not only reproducing that challenge, but increasing it because the Children and Teens’ Online Privacy and Protection Act applies to more young people. Instead, we advocate for universal privacy protections for all Americans that can be updated, as needed, for children.

The other bill under consideration is the Kids Online Safety Act. This bill follows California and the United Kingdom, both of which have passed youth content moderation protections. It applies to any online software with child users and can be broken down into three areas. First, a blanket duty of care for platforms to act in the best interest of minors using the site by demoting content that could be harmful to them. The bill defines harmful content as promoting eating disorders, self-harm, bullying, sexual exploitation of youth, or alcohol or addiction content. Next, it requires safeguards, or “parental controls,” on youth accounts. The controls would provide extra privacy, data, and content ranking settings. Finally, it requires audits from companies on their online safety risks and practices, gives the Federal Trade Commission enforcement powers, and establishes a Kids Online Safety Council to advise and implement the Act.

This bill gets a few things right. First, it defines a set of harmful content, making it easier for companies to know what is and isn’t covered. The requirement to add additional settings for parental control on individual online accounts is also valuable. It creates an easy opt-in tool for parents to better manage their children’s accounts.

The challenge is in the duty of care mandate. In theory, as long as platforms can demonstrate in their audits that they are taking appropriate steps to prevent youth from accessing harmful content, they will be safe from lawsuits. However, addressing content moderation is challenging. The First Amendment protects the right to freedom of speech with minimal exceptions, giving private companies a broad mandate to define what content is shown on their platforms. And many companies already go above and beyond in shielding all users from the content defined in KOSA.

Harmful content violates the terms and conditions of most platforms and is already moderated. Companies do their best to demote and remove videos included in the “harmful content” definition, but it is currently technically impossible to do this work with 100% accuracy. Content that is bullying or harassing can happen in real-time, like in chat rooms on video games. If a video game has users under 16, which many do, the company could censor certain words in the chat, but online language is constantly evolving and uses new abbreviations and emoji combinations to get around censorship.

It’s unclear what additional steps firms will need to take to comply with KOSA’s broad mandate. There are currently no enforceable age restrictions on the internet, meaning KOSA elicits the same enforcement challenges as COPPA. Some sites might choose to be more heavy-handed, such as restricting users under 16 from making accounts (as many sites now do for kids under 13 due to COPPA requirements), requesting proof of age when signing up, or moderating content, including user-generated content that depicts legal products for adults like alcohol and cigarettes, for everyone to protect youth.

There is little doubt that young people need protection from harmful internet content. The proposed bills are broad in scope, applying to any website, social media, video game, or app that connects to the internet. Without universal privacy protections for all Americans and with the First Amendment, as well as other challenges with internet content moderation, these bills may be difficult to enforce and face legal scrutiny. While they likely won’t alter the internet as we know it, more time is needed to see how these bills will impact platforms and content across the internet.

Bledsoe for RealClear Energy: Protesting China’s Climate Catastrophe

By Paul Bledsoe, PPI’s Strategic Advisor

The stunning protests by average Chinese citizens against Xi Jinping’s disastrous Covid lockdowns may open the door not just to less restrictive Covid approaches, but to global outrage over an even more cataclysmic threat—China’s out of control greenhouse gas emissions that are destabilizing the global climate.

The latest protests in China are reminiscent not just of Tiananmen Square demonstrations in 1989, but also of the public outcry from 2013-2017 against China’s crippling air pollution. Those protests proved politically powerful enough to force at least some improvements in Beijing’s air quality, prompting new investments in clean energy and slight changes to China’s intensely polluting industrial economy.

Yet these mostly cosmetic actions have done little to slow planet-endangering greenhouse gas growth presided over by Xi.  China’s yearly emissions are now more than 31% of the global total. That’s more than all emissions from the U.S. and every other developed country on earth combined. And unlike the U.S., EU and our allies who are spending hundreds of billions of dollars to deeply cut our greenhouse gases, China’s emissions are still rising.

Read the full piece in RealClear Energy.

PPI’s New Skills for A New Economy Project to Promote Workforce Development Policies that Level the Playing Field for Working Americans

New initiative will push investments for 21st century job training and upward mobility

Today, the Progressive Policy Institute (PPI) announced the launch of the New Skills for a New Economy Project, which seeks to promote bold and pragmatic workforce development policies that level the playing field for degree and non-degree workers and ensure greater upward mobility for all working Americans. The project will be led by Taylor Maag, Director of Workforce Development Policy at PPI.

“The New Skills for a New Economy Project comes at a critical time for workers in America – we face unprecedented workforce challenges and more and more working Americans, especially those without degrees, are feeling left behind. This project will develop innovative policy solutions to address these challenges and ensure workers excel in today and tomorrow’s economy.” said Taylor Maag, Director of Workforce Development Policy at PPI.

The New Skills for a New Economy Project will help shape policy discussions at the federal and state levels around investments in a robust workforce development system that is fully-funded, modern, industry-responsive, and equips current and future workers with the skills they need to get ahead. The project will promote policy solutions that address the current challenges facing workers’ success and help the U.S. remain competitive by lifting up new ideas and best practices happening across the country.

Learn more about the project by visiting the project’s website, and read more about the project’s goals here.


Taylor Maag is the Director of Workforce Development Policy at PPI. Prior to joining PPI, Taylor worked at Jobs for the Future (JFF) where she assisted in the development and implementation of JFF’s federal and state policy agenda, focusing on workforce reform and innovation, access and affordability in postsecondary education and federal poverty alleviation policy. Additionally, Taylor led JFF’s congressional and workforce-related practitioner networks to ensure federal policymakers were staying connected with leaders implementing innovative and successful strategies on the ground.

The Progressive Policy Institute (PPI) is a catalyst for policy innovation and political reform based in Washington, D.C. Its mission is to create radically pragmatic ideas for moving America beyond ideological and partisan deadlock. Learn more about PPI by visiting progressivepolicy.org.

Follow PPI on Twitter: @ppi

Find an expert at PPI.

###

Media Contact: Aaron White; awhite@ppionline.org

MOSAIC MOMENT: Contracting and Gig Work in the Modern Economy

On this week’s episode of the Mosaic Moment, Program Director, Jasmine Stoughton, sits down with Mosaic alum, Dr. Liz Wilke, to explore her new report, “Supporting Contractors’ Career Development in the Future of Work.” They discuss holes in the social safety net for both contractors and employees, the complexities of filing taxes as an independent worker, and how upskilling and career training could be the key to navigating our modern economy.

Read Dr. Wilke’s paper here.

Follow Dr. Liz Wilke on Twitter.

Follow Mosaic on Twitter.

Follow PPI on Twitter.