COVID-19 vaccination rates in the United States have slowed to a crawl. The Centers for Disease Control and Prevention’s (CDC) count of fully vaccinated people is averaging around 40,000 per day, down from 241,000 on Dec. 1, 2021. Meanwhile, research from the University of California at San Francisco found that the omicron variant produces a much weaker neutralizing antibody compared to a booster shot (66% less), suggesting reduced immunity from any future variants.
While neither is an issue at the moment given the low infection rate, some believe the U.S. may be in store for another spike due to the BA.2 subvariant of omicron currently on the rise in the United Kingdom.
If vaccines remain the best tool in the fight against COVID-19 but mandates have proven untenable — and hesitancy regarding mRNA vaccines remain stubbornly high despite their strong record of safety — how can we get more Americans to get their shots?
In the short term, offer an alternative to the existing vaccines that is effective and made with an older, proven technology.
In the long-term, restore trust in our nation’s health and science government agencies.
According to a CNBC poll from last fall, 34% of unvaccinated Americans are choosing to remain so because of concern about the existing vaccines and the potential side effects. Another 34% won’t get vaccinated because they do not trust the federal government.
For those looking for a vaccine using a more traditional platform, several are on the way. One vaccine created by Novovax — a Maryland-based pharmaceutical — is available in Europe, Australia and India.
Novovax’s drug is a protein adjuvant vaccine and uses technology similar to that in the flu vaccine. Unlike the Pfizer and Moderna mRNA vaccines, which use genetic information to alert the immune system, the Novovax vaccine attaches a benign bit of the coronavirus spike protein to an adjuvant, an ingredient made from tree bark, that alerts the immune system.
Novovax submitted their request from the Food and Drug Administration for its Emergency Use Authorization (EUA) request on Jan. 31 of this year. The drug has proven 90% effective in a large study in the U.S. and Mexico. Yet, almost three months later, the FDA has still not scheduled a meeting to consider approval.
The delay is curious, given how quickly the three vaccines currently on the market (Pfizer, Moderna and Johnson & Johnson) were approved for an EUA: all within 23 days.
As Americans awake to the glowering reality of resurgent Russian imperialism, our political parties seem to be trading places. Democrats have rallied behind President Biden’s policy of military aid to Ukraine, while Republicans are torn over the wisdom of U.S. intervention.
The sheer ferocity of Russia’s assault, including deliberate massacres of civilians, seems to have quieted the anti-interventionist left. Even leaders of the House’s ultra-progressive Squad support sending U.S. arms to help Ukraine to defend itself against Russian ruler Vladimir Putin’s bloody rampage. That’s put them at odds with their allies in the Democratic Socialists of America, which by force of habit if not logic blame “American imperialism” for the conflict.
While Democrats bask in a rare moment of unity, Republicans are all over the ideological map. GOP congressional leaders mostly have backed Biden’s Ukraine policy but try to conceal that from their wrathful base by heaping abuse on him for being too weak to prevent the invasion.
That’s rich coming from party leaders who dared not protest former President Trump’s fawning attempts to befriend the Russian dictator, or his frequently expressed desire to quit NATO — which would have been the strategic equivalent of handing Moscow the keys to Europe.
3 million industrial robots, 100,000 services robots, and 32 million domestic robots are at work worldwide.
THE NUMBERS:
Operating robots, 2020*
3 million ‘Industrial’
0.1 million ‘Professional’ services
32 million ‘Consumer’
* International Federation of Robotics, 11/21
WHAT THEY MEAN:
Karel Capek’s R.U.R., which introduced the word ‘robot’ to the world’s vocabulary 101 years ago, is a cautionary tale. In Act 1, enthusiastic human inventors and business promoters predict that robots will bring the end of scarcity, the abolition of degrading manual labor, and the opening of an age of universal “freedom from worry.” By Act 3, in a sense, they get their wish, but in a way that comes as an unpleasant surprise.
A century later, and two generations since the first industrial robot* went live, how close are we to either of Capek’s predictions?
World Robotics 2021, the annual survey from the International Federation of Robotics, counts 3 million working industrial robots, 109,000 “professional” services robots, and about 32 million blue-collar “consumer” robots at work around the world last year. By their counts, the heartlands of industrial robotics are in East Asia:
(a) Japan is the largest robot-maker, producing 136,000 new robots in 2020. This was over a third of the 384,500 new robots installed worldwide.
(b) Korea is the world’s most roboticized industrial economy, with nearly 932 robots per every 10,000 factory workers, double the 400-to-10,000 ratio of a decade ago. Singapore is a relatively close second at 605 robots per 10,000, with Japan third at 390. Rounding out the top ten are Germany at 371, Sweden at 289, Hong Kong at 275, the U.S. at 255, Taiwan at 248, and China and Denmark at 246 each.
(c) China is home to the world’s largest operating robot workforce. Over 800,000 robots were working in Chinese factories at the end of 2019, and 168,400 more came online in 2020. IFR’s worldwide count of new robots was 384,50, meaning that China accounted for nearly half of all new robot installations. Japan placed a distant second with 38,700 new robots and the U.S. was third at 30,800. By industry, the largest numbers of new robots in China and Korea go to electronics assembly and semiconductor production; in the United States and Germany, they are in the automotive industry; in Japan, automotive and electronics more or less equally.
IFR guesses that 2021 saw 435,000 new robot installations; the count is likely to top half a million for the first time in 2024, with nearly all the projected net growth in Asia. Meanwhile, about 100,000 more complex services robots are at work (transport and logistics; cleaning; agriculture; hazardous waste disposal); and in homes, about 32 million vacuuming, gutter-cleaning, security, and other domestic robots are in fact at least diminishing the human quotient of manual labor. R,U.R.’s universal plenty and absence of worry (and their sinister hidden meanings) have yet to materialize.
* “Unimate,” at a General Motors auto plant in New Jersey, in 1961.
FURTHER READING
Global highlights from the International Federation of Robotics’ World Robotics 2021.
And from Germany a (slightly dated) video on the bleak human future — passive, outmoded future-man sits glumly in chair as mechanical “DynaMaid” mockingly inquires about his “day at work.”
A few looks ahead, and one look back, from robot arts & lit
Capek’s R.U.R. (1921) invented the word “robot,” and the classic “robot uprising” plot. The title acronym stands for a fictional “Rossum’s Universal Robots” company, and “Rossum” is a slightly modified version of the Czech word for “reason.” A Penn State robotics academic looks at R.U.R. a century later.
In robot-friendly Japan, by contrast, Astro-Boy (said to be the first anime character) is a helpful friend to humanity.
Stanislaw Lem’s “Mortal Engines” collection speculates about machine intelligence. In “The Hunt,” a well-meaning human pilot volunteers to destroy a supposedly mad robot; next, in “Mask”, a troubled, self-aware female robot-assassin tracks down a political dissident.
Philip K. Dick thought humans and robots would lose the ability to distinguish themselves from one another.
And was Capek really the first? Adrienne Mayer’s “Golds and Robots: Myths, Machines, and Ancient Dreams of Technology” looks at androids, flying cars, computers, and other semi-inventions of classical Greece, with comparators from India, Babylon, and the mechanical men of the Qin Dynasty court.
Laugh while you can
The International Federation of Robotics publishes research papers as well as annual statistical reports. Their research-paper link features a standard human-chauvinist “Captcha” request form; to get one of the papers, you have to certify that “I’m not a robot.” Bad idea! The robots will find out, and they might be angry.
ABOUT ED
Ed Gresser is Vice President and Director for Trade and Global Markets at PPI.
Ed returns to PPI after working for the think tank from 2001-2011. He most recently served as the Assistant U.S. Trade Representative for Trade Policy and Economics at the Office of the United States Trade Representative (USTR). In this position, he led USTR’s economic research unit from 2015-2021, and chaired the 21-agency Trade Policy Staff Committee.
Ed began his career on Capitol Hill before serving USTR as Policy Advisor to USTR Charlene Barshefsky from 1998 to 2001. He then led PPI’s Trade and Global Markets Project from 2001 to 2011. After PPI, he co-founded and directed the independent think tank ProgressiveEconomy until rejoining USTR in 2015. In 2013, the Washington International Trade Association presented him with its Lighthouse Award, awarded annually to an individual or group for significant contributions to trade policy.
Ed is the author of Freedom from Want: American Liberalism and the Global Economy (2007). He has published in a variety of journals and newspapers, and his research has been cited by leading academics and international organizations including the WTO, World Bank, and International Monetary Fund. He is a graduate of Stanford University and holds a Master’s Degree in International Affairs from Columbia Universities and a certificate from the Averell Harriman Institute for Advanced Study of the Soviet Union.
Today, Ed Gresser, Vice President and Director for Trade and Global Markets at the Progressive Policy Institute, published a new paper on the adverse effects of the United States tariff system on working American families — in particular, single-parent families and Black and Hispanic families.
The paper, titled “Trade Policy, Equity, and the Working Poor: United States MFN Tariffs are Regressive Taxes Which Help Few Workers and Harm Many” is published in concert with Mr. Gresser’s testimony before the U.S. International Trade Commission (ITC) on the issue of Distributional Effects of Trade and Trade Policy on U.S. Workers. At the request of U.S. Trade Representative Katherine Tai, the ITC is conducting a year-long investigation of this topic, in the hopes of providing the U.S. government and Congress with deeper analyses of the effects of U.S. trade policies and agreements on lower-income and disadvantaged American communities.
Gresser’s paper and testimony highlight the very high permanent tariffs imposed on clothes, shoes, silverware, and other home goods. These range up to 48% for cheap sneakers, and are systematically higher on cheap goods bought by low-income families than on analogous luxuries bought by wealthy families.
“We have a unique opportunity to right a wrong in our U.S. tax system — one that disproportionately impacts low-income Americans by imposing tariffs that make home necessities more expensive,” said Ed Gresser. “The Biden Administration deserves credit for asking a core question that looms over trade policy and the path forward to a more fair U.S. trading system. The ITC’s research, data, and public hearings on tariff fairness are integral in illuminating this problem and inspiring trade policy that works for every American worker and family.”
Read the paper and expanded policy recommendations here:
Ed Gresser is Vice President and Director for Trade and Global Markets at PPI. He most recently served as the Assistant U.S. Trade Representative for Trade Policy and Economics at the Office of the United States Trade Representative (USTR). Mr. Gresser has been published in the Wall Street Journal, Foreign Affairs, CNN, and New York Daily News.
The Progressive Policy Institute (PPI) is a catalyst for policy innovation and political reform based in Washington, D.C. Its mission is to create radically pragmatic ideas for moving America beyond ideological and partisan deadlock. Learn more about PPI by visiting progressivepolicy.org.
The U.S. MFN tariff system is a regressive element of the U.S. tax system, with disproportionate effects on low-income families (in particular, single-parent families), and also on African American and Hispanic families relative to families of other races and ethnicities. This emerges from four points:
(1) U.S. MFN tariffs raise revenue principally from home necessities such as clothes, shoes, and a few other consumer goods. These make up only a small share of imports but provide more than half of MFN tariff revenue.
(2) This fact makes the MFN tariff system a regressive form of taxation, since low-income families, single-parent families, and African American and Hispanic families spend more of their family budgets on these products than the U.S. average.
(3) U.S. MFN tariffs on these and several other categories of consumer goods are systematically skewed, taxing cheap goods heavily and luxury goods lightly, making the MFN tariff system discriminatory as well as regressive.
(4) Tariffs on consumer goods appear ineffective as protectors of employment or production.
These four points create a logical path toward pro-poor reform. By “sunsetting” or otherwise eliminating many tariff lines which support no U.S. employment, Congress can make U.S. trade policy and taxation fairer. This would ease financial burdens in a small but real way for American low-income and minority workers and their families, helping to raise their living standards without intensifying competitive pressure.
* * * * *
Ambassador Katherine Tai and the Office of the U.S. Trade Representative deserve great credit for seeking greater insight on the “distributional effects of goods and services trade and trade policy on U.S. workers by skill, wage and salary level, gender, race/ethnicity, age, and income level, especially as they affect underrepresented and underserved communities.” This is an important topic, deserving in-depth and regular examination. The Commission’s investigation of the matter, I hope, will cover several different dimensions of policy:
The nature of the permanent U.S. trade policy systems, such as the MFN tariff schedule, trade remedy laws, and agricultural subsidies and quotas, and the effect these have on America’s underrepresented and underserved communities in terms of both employment and living standards.
The intended and unintended effects of policy decisions which alter these underlying systems — for example, conclusion of major trade liberalizing agreements and introduction of “301” and “232” tariffs — on Americans who lack the information and perhaps the advocates to communicate their interests to executive-branch negotiators and Members of Congress.
The effects of the ongoing evolution of the logistics, telecommunications, and internet economies, all of which steadily reduce the transactional costs of trade, likely often rendering permanent trade regimes less effective while sometimes amplifying and sometimes muting the effects of policy change.
All these phenomena are likely to have complex and often cross-cutting effects. Sometimes they will reinforce one another. For example, tariff reductions and the growth of the global shipping container fleet both make trade cheaper. At other times they may contradict one another. Analysis of their effects on underserved and unrepresented Americans on the job and in management of family budges is therefore likely to require great sophistication and may often lead to equivocal results.
For example, the Trump administration’s imposition of tariffs on metals under Section 232 of U.S. trade law should provide some advantages to steel and aluminum producers within the United States as they compete with foreign suppliers. Potentially, therefore, this step could provide support to communities in which metals producers are important to the local economy. On the other hand, the same “232” tariffs should simultaneously disadvantage metals users, such as automakers, machinery manufacturers, and food manufacturers, as they strive to export or to compete against imported goods, and consequently disadvantage their communities. Retaliations against U.S. exporters provoked by these tariffs, often targeting agricultural exporters and thus the rural communities dependent on farming, adds another layer of intellectual and ethical complexity to these questions.
Likewise, the long-term effects of change in the logistics and communications industries — a growing container-ship fleet, larger and more efficient air cargo networks, deployment of more capable transcontinental fiber-optic cables and communications satellites, and U.S. investment in physical and telecommunications infrastructure — may often be as powerful as policy decisions by government. These lower the cost of both goods and services trade, and also make international sourcing more attractive by speeding up the movement of physical goods and information. Over time this is likely to make tariffs and some other trade barriers generally less effective. It may also reduce the real-world impact of changing these systems, whether through trade liberalizing agreements or presidentially imposed tariffs.
But some trade policies have less complicated effects. I argue in this paper that the MFN tariff system is such a case. On one hand, though this system is a small part of American tax policy, it is a uniquely regressive part since it raises most of its revenue from taxation of low-priced home necessities — in particular, clothes, shoes, luggage and handbags, home linens and carpets, tableware, and silverware. On the other hand, tariffs on these products offer few offsetting benefits in terms of protecting employment and production, and in many cases appear to offer no such benefits at all. Thus, the MFN tariff system is likely to be harming American workers and families in underrepresented and underserved communities by raising prices on home necessities, without creating an offsetting benefit in job opportunities.
To explain this, the paper makes four points, as follows:
(1) The MFN tariff system is mainly a way to tax home necessities;
(2) U.S. consumer goods tariffs are systematically skewed to tax cheap goods heavily and luxury goods lightly;
(3) Low-income families, single-parent families, and African American and Hispanic families spend more of their family budgets on these products than the U.S. average; and
(4) Tariffs on consumer goods do not appear to be effective at protecting employment or production.
I. MFN TARIFF REVENUE COMES MAINLY FROM HOME NECESSITIES
First, the MFN tariff system — meaning the “Column 1” tariffs listed in the Harmonized Tariff Schedule (HTS), and excluding tariffs imposed through the Trump Administration’s “232” and “301” actions, or through anti-dumping and other trade remedy laws — is mainly a way to tax home necessities.
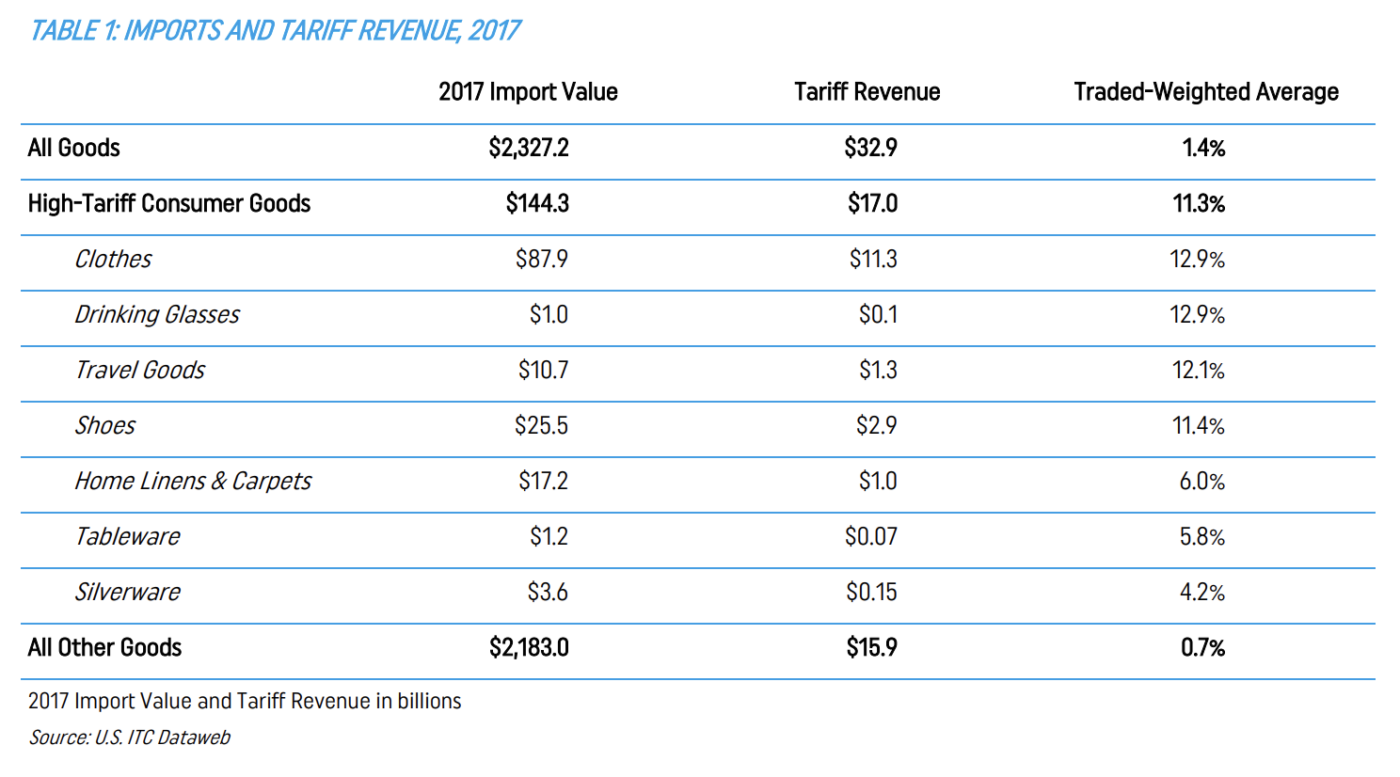
The “calculated duties” published by the ITC through its on-line “Dataweb” service (dataweb.usitc.gov) show this clearly. As Table 1 below shows, in 2017 — the last full year before imposition of the Trump administration’s “232” and “301” tariffs — about half of the $32.9 billion in U.S. tariff revenue came from a small collection of home goods. Specifically, these are clothes, shoes, home linens and carpets, travel goods, silverware, plates and drinking glasses. These products were about 6% of imports, but raised about 55% of all tariff revenue.
These products raise such a disproportionate amount of tariff revenue because (a) they receive unusually high MFN tariff rates; and (b) despite the intense scrutiny U.S. Free Trade Agreements and preference programs receive in public trade policy debate, most are imported under MFN tariffs.
The Trump administration’s “232” and “301” tariffs are a useful way to put these facts in perspective. The “232” actions in 2018 imposed tariffs of 25% on worldwide imports of many steel products and 10% on many aluminum products. The “301” actions in 2018 and 2019 imposed tariffs of 25%, 10%, and 7.5% on many Chinese goods. Observers in the United States and abroad viewed these as very large increases in tariffs — rightly so, since they fell mainly on industrial inputs bought by manufacturers, construction firms, and so on, on which tariffs are normally quite low. For example, the MFN tariff on auto parts (HTS heading 8708) is 2.5%. The MFN tariff on aluminum plates and sheets (HTS heading 7605) are usually 3%; that on pressure-reducing valves (HTS 8481) is 2%; and that on computer accessories (HTS 8471) is zero. Thus the “232” and “301” tariffs appeared to be a draconian step, and can reasonably considered as such.
In the home consumer goods world, however, MFN tariffs of 7%, 10%, 25%, and higher would not be a draconian exception; rather they are the norm. On average, as Table 1 illustrates, they have (trade-weighted) tariff rates of about 11.3% — a figure 15 times than the pre-232/301 rate on all other goods.
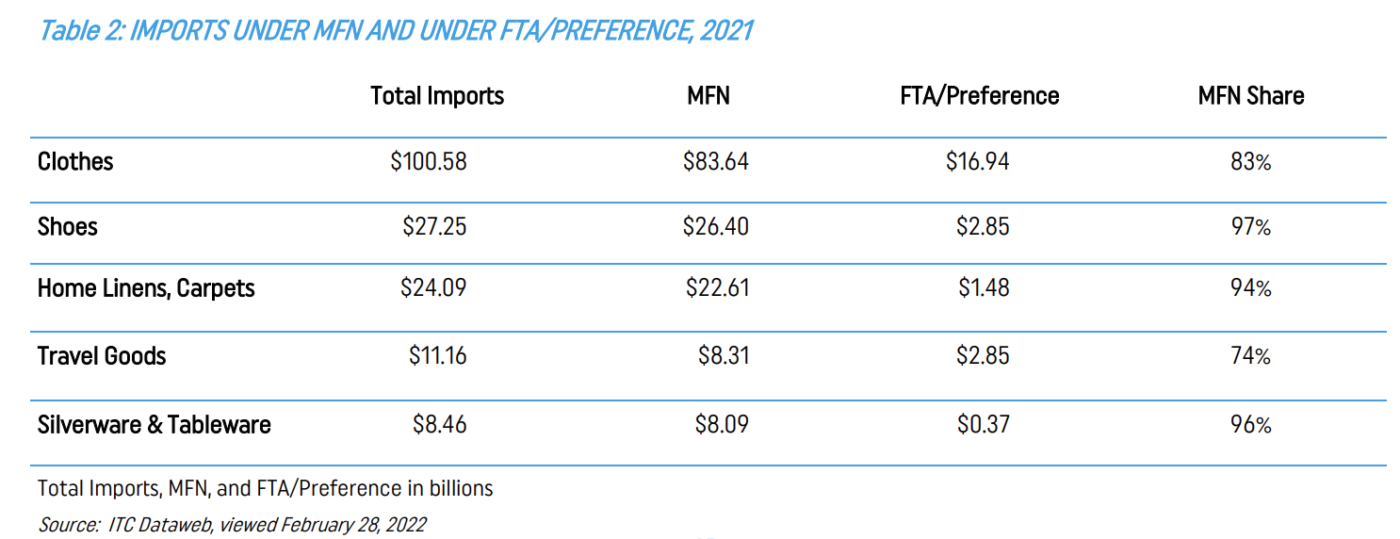
It may be asserted that the MFN tariff rates are headlines that are less important than they seem, given the large role Free Trade Agreements and developing-country trade preference systems play in U.S. trade debates. In practice, it is true that FTAs and preferences diverted some home goods imports away from high-tariff MFN producers. The main examples are diversions of some clothing to Western Hemisphere and (to a lesser extent) African producers, and of “travel goods” to several Southeast Asian GSP beneficiary countries. But as Table 2 points out, these effects are only modest in clothing and travel goods, and negligible in other home goods. In all these product categories, the large majority of imports arrive under MFN tariffs, with buyers paying MFN tariff rates and passing on the costs to customers.
Thus, as of 2017 a small set of home consumer goods made up $144 billion of the U.S.’ $2.33 trillion in imports — 6% of the total, in other words — but raised well over half of all U.S. tariff revenue.
II. SINGLE-PARENT FAMILIES, AND AFRICAN AMERICAN AND HISPANIC FAMILIES, SPEND MORE OF THEIR INCOME ON HOME NECESSITIES
Second, the fact that U.S. MFN tariffs are mainly on home necessities makes the MFN tariff system a regressive element of the tax system.
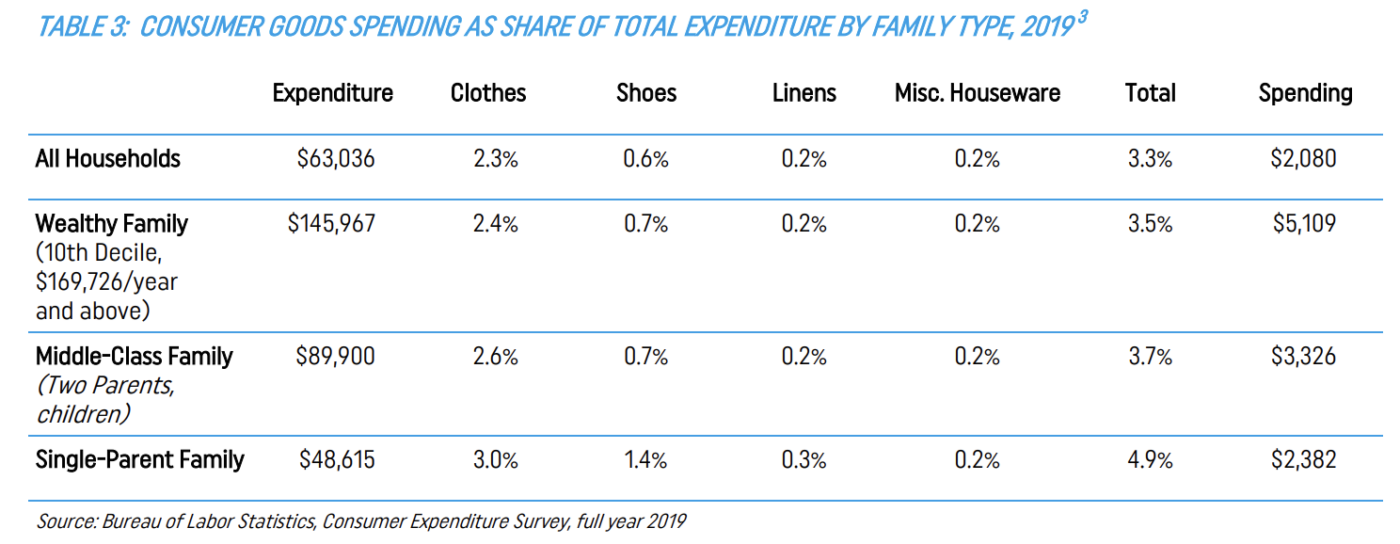
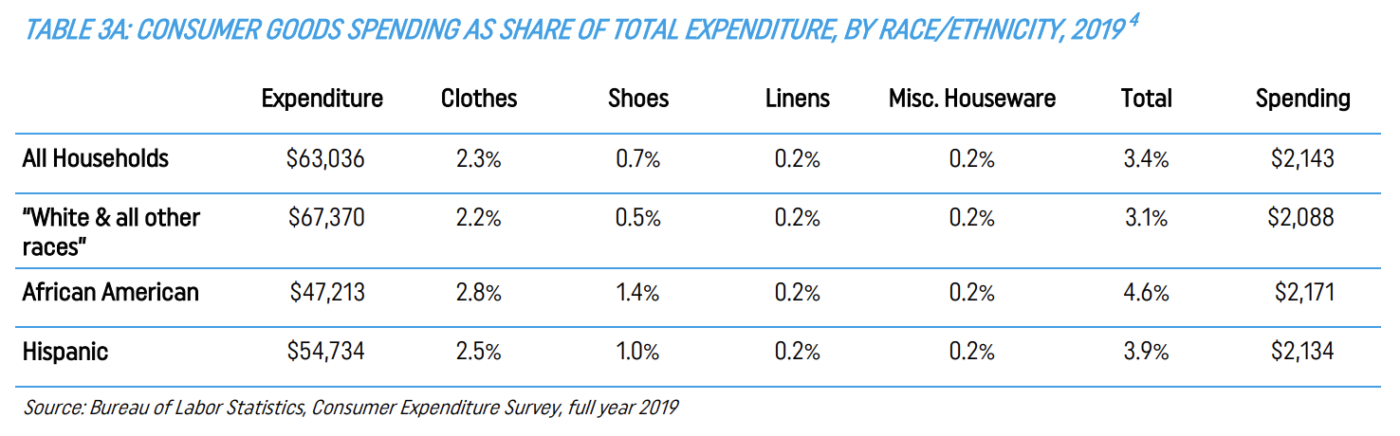
Data from the Bureau of Labor Statistics’ Consumer Expenditure Survey (CEX) show that poor families spend more of their income on home necessities — counting clothes, shoes, home linens and floor coverings, along with “small appliances and other household goods” — than middle-class families or wealthy families. Likewise, African American and Hispanic families spend more of their income on these goods than the national average.
The CEX “Composition of Consumer Unit” expenditure table includes spending patterns for all households, two-parent families with and without children, and single-parent families with and without children. CEX’s “Deciles of Income” table allows us to compare these family types’ expenditures with those of wealthy families with incomes of $175,000 per year and higher. The predictable pattern is that single-parent families have the lowest incomes among the CEX family types and spend the largest share of their incomes on home necessities. Table 3 below illustrates this with CEX’ household expenditure data for 2019.
Likewise, as Table 3a shows, spending on necessities requires more of the family budget for African American and Hispanic families than for the national average, or for BLS’ “White and All Other Races” category.
These tables’ implication is clear. Low-income families, and African American and Hispanic families, devote more of their budgets to home necessities, and the MFN tariff system raises most of its revenue from these products. Therefore, the tariff system is bound to be “regressive” in taxing poor families more heavily than middle-class families, and wealthy families lightest of all. Likewise, it will have disproportionate effects (even if not huge ones) by race and ethnicity. These principles are widely recognized in debates over state sales taxes and federal excise taxes, though in modern history the opacity of the tariff system, and the rarity of investigation into its nature by Congress or economists, has obscured this system’s regressive nature.
III. U.S. MFN TARIFFS ON HOME NECESSITIES ARE LOW ON LUXURIES BUT HIGH ON MASS-MARKET GOODS
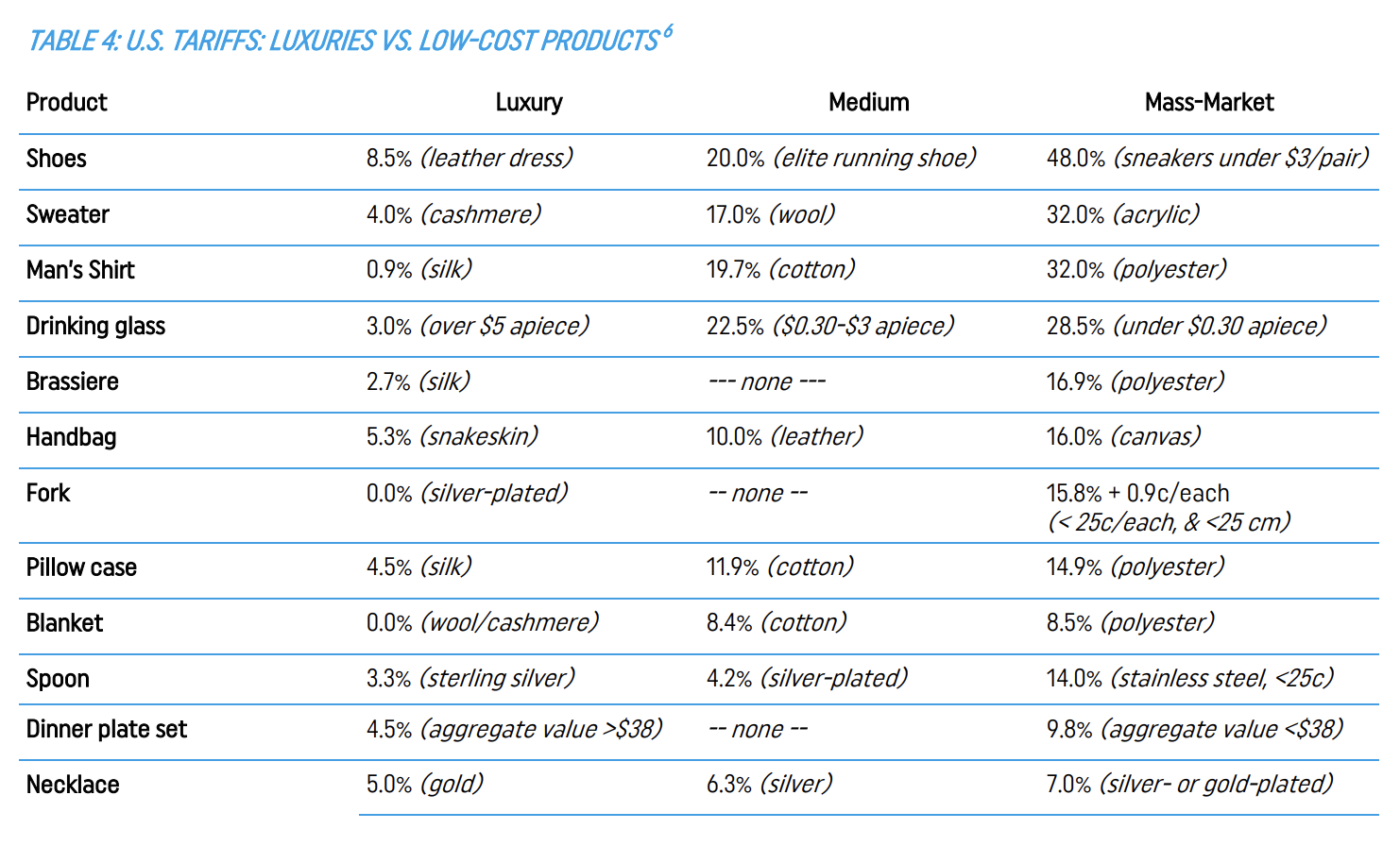
However, comparing average MFN rates and families’ spending patterns is insufficient. This is because the MFN tariffs on home goods are not uniform rates applied to all varieties of (say) shoes, clothes, or spoons as is often the rule in Europe, Japan, and other major trading partners. In the U.S. MFN system, by contrast, MFN tariffs on home goods are systematically and rather radically skewed against poorer people, since cheap mass-market products receive especially high rates on cheap mass-market products and analogous luxury goods very low ones.
The Harmonized Tariff Schedule (HTS) devotes about 1,000 tariff lines to these products. These lines span a remarkably broad spectrum of rates, many far from the 11.3% trade-weighted average. Table 4 below is an illustrative list of 31 actual MFN tariff rates applied to twelve types of products, grouped in “luxury,” “medium,” and “mass-market” categories. At the luxury end, we find rates of 0.0% on silver-plated forks, 0.9% on men’s silk shirts, 4.0% for cashmere sweaters, and 8.5% on leather dress shoes. At the other end are rates of 14% on stainless steel spoons, 32% on men’s polyester shirts, and 48% (the highest U.S. tariff imposed on any manufactured good) on low-priced sneakers.
These examples illustrate the fact that virtually everywhere in the consumer goods chapters and headings of the Harmonized Tariff Schedule, tariff rates are systematically higher for products mainly bought by poorer people, and systematically lower for analogous luxury products mainly bought by rich people. For example, buyers of cheap stainless steel spoons are (without knowing it) taxed heavily and buyers of sterling silver spoons lightly — in this case, with the tariff rate specifying that low-priced steel spoons specifically receive the highest rates. A hotel maid in polyester underwear must (without knowing it) pays an 16.9% tax, while a wealthy vacationer occupying the balcony she cleans pays 2.7%. This skew makes it reasonable to view the MFN tariff system on home goods not only as regressive, but actually discriminatory against the poor.
IV. TARIFFS ON HOME NECESSITIES APPEAR INEFFECTIVE IN SUPPORTING EMPLOYMENT AND PRODUCTION
Fourth and finally, few tariffs on home necessities appear to be effective protectors of production and employment.
MFN tariff rates for these goods have remained stable for decades. Shoe tariffs, for example, were exempted from Uruguay Round tariff cuts. Most clothing tariffs likewise remained the same, though clothing trade more broadly was substantially liberalized by elimination of the quota systems in effect from the 1970s through 2004. But as these policies remained in place, formerly poor agricultural countries became large producers of consumer goods; European and Asian (and American) port efficiency improved; the global container shipping fleet expanded from about 1 million TEU to 25 million TEU; and innovation in maritime logistics, air cargo, and telecommunications steadily drove down transactional costs. This meant that the power of a stable consumer goods tariff to affect trade flows lessened each year.
Thus, while the MFN tariffs on consumer goods have always been regressive, over time many of them have lost their power to “protect” jobs and production. In such cases, tariffs lose their dual role as trade policy and tax policy, and become essentially excise taxes.
In shoes and clothes, for example, the “import shares” of the U.S. market are exceptionally high at 98% and 97% respectively, despite the high tariffs on these products. Actual shoe employment has fallen by a likely 95% since the mid-1970s to about 6,900 as of 2022. In clothing the same phenomenon appears, as employment has dropped from roughly 1 million in the 1970s to 95,000 in March 2022. In “jewelry and silverware,” a category that obviously goes well beyond tableware, employment has dropped from 70,000 in 1990 to 21,500 in 2022, and a New York company making expensive high-end silverware is advertising itself as the only American firm currently making these goods. On the other hand, employment trends in “textile furnishings” are less dramatic, with job totals clearly down — 130,000 in 1990, 46,000 at the end of 2021 — but the decline much less sharp than in clothes, shoes, silverware, or travel goods. This suggests either the U.S. industry remains competitive and employment declines mainly reflect productivity gains, that tariffs have been more effective in home linens than in other industries, or both at the same time.
This evolution appears to have gone especially far, and in fact to have been completed, in some of the products carrying the very highest tariffs. For example, it appears that none of the cheap sneakers with 48% MFN tariffs or sometimes even higher complex tariffs have been made in the U.S. for decades. Likewise, if the New York silverware company’s presentation is up to date, no U.S. firm is making the cheap spoons with 14.0% tariffs or the “15.8% + 0.9c/apiece” forks.
V. OBSERVATIONS AND CONCLUSIONS
What, if anything, should be done about this? As a starting point, Ambassador Tai and the Office of the U.S. Trade Representative deserve applause for asking a core question about the purposes and effects of trade policy in requesting this International Trade Commission to conduct this study.
One purpose should be to support the living standards of vulnerable Americans, both in their lives as workers and in their lives as managers of especially limited family budgets. Others should include promoting U.S. growth and economic efficiency, providing opportunity for exporting farmers, manufacturers, and services providers, and ensuring that American workers and business operators are treated fairly in global markets.
These goals will not always complement one another. A particular trade policy choice may be good for the nation, but in some degree bad for vulnerable communities, and/or good for some vulnerable communities but harmful to others. In such cases, Congress and administration officials would be making intellectually and ethically complex decisions about defining national interest, and finding complementary ways to support those workers who might be disadvantaged.
On the other hand, sometimes policy choices are relatively simple and easy. If long-established policies are (a) generally regressive and often actually discriminatory against the poor, and (b) have lost their original purpose of protecting employment and production, then they should be scrapped.
One way to approach this would be a “sunset” provision, in which all HTS tariff lines would receive periodic review to see whether they relate to U.S. employment and production. Tariff lines which protect no U.S. employment or production appears would be abolished, unless their advocates could show an important indirect support for U.S. industry and workers via FTAs or some other avenue. Such an approach would not affect employment or production, and would have disproportionate — though obviously not enormous — benefits for single parent families, African American and Hispanic families, and the poor generally.
Policy choices, however, are never likely to materialize without the research and data that illuminate a problem and point the way to solutions. The ITC’s study, accompanied by its hearings and symposium, are a unique opportunity to provide that research and data, and bring it to the attention of Congress, executive branch officials, academics, and the public.
READ THE FULL REPORT
ABOUT THE AUTHOR
Edward Gresser is Vice President and Director for Trade and Global Markets of the Progressive Policy Institute, a 501(c)(3) nonprofit headquartered in Washington, D.C. Before joining PPI in October 2021, he served as Assistant U.S. Trade Representative for Trade and Global Markets, and concurrently as Chair of the U.S. government’s interagency Trade Policy Staff Committee.
Supply chain disruption” is suddenly a widely searched term on the internet. As store shelves are inexplicably bare, automobile production is slowed by a lack of semiconductor chips, and inflation accelerates, both consumers and economists are looking for answers. But answers are hard to come by. Conventional trade and economic statistics tell us very little about the dynamics of global supply chains which have become so important to the global economy. We may have to do a lot more digging before we understand how to buttress our resilience to future disruptions.
The classic picture of international trade taught in economics textbooks is based on “arms length” transactions. A wine merchant based in Washington, D.C., for example, will contract to buy one hundred bottles of Bordeaux from a French distributor. Or an Ohio-based manufacturer will browse an online catalog and buy ten thousand screws of a particular size from a Guangdong factory.
But for the most part, international trade is not as simple as opening up a paper or online catalog and ordering a pre-made product, at a fixed price. Most large retailers and manufacturers can’t just buy generic goods off the world marketplace and expect to have the quantities and products that they want. For “simple” goods like apparel and toys, a retailer like Walmart will have in-depth real-time knowledge of what styles, colors, and materials customers are buying, and work with suppliers around the world so that they can plan ahead. In other words, market data flows from domestic buyers to overseas suppliers even before production.
Continents and regions contributing words to the English language: Africa, Asia, Australia, Europe, South America, North America, Arabia, South Pacific, Caribbean.
WHAT THEY MEAN:
Coca-cola, bubble gum, bikinis, digital media tycoons, hamburgers, frozen mocha, and blue jeans: Do we live in a boringly homogenized New-York-and-California-ish world? Not really. These are not American or even “English” words, but (barring “bubble,” “digital media,” and “blue”) imports from baroque Europe, the Incan empire, the South Pacific, pre-colonial Africa, 19th-century German immigrant communities, Tokugawa Japan and classical Arabia:
The trademark name Coca-Cola combines the Quechua word for the coca plant and the Malinke name for a West African nut once used to flavor the drink.
Gum seems to be a survivor of the ancient Egyptian language, brought into English via Greek. It bested a logical competitor — the Aztec word “tzictli” or “chicle,” referring to the actual gum base — which holds out mainly in the candy trademark “Chiclets.”
Bikini is the name of the unfortunate coral atoll in the Marshall Islands used to test nuclear bombs in 1946. (“Coral” is Greek and “atoll” comes from Divehi, a language spoken in the Maldives Islands southwest of India.)
Tycoon is the Japanese title — itself based on a Chinese phrase meaning “great prince” — of a high Edo-era official. Commodore Perry brought it back from Tokyo in the 1850s, and young White House staffers using it as a nickname for President Lincoln stuck it firmly in English.
Hamburger, obvious north German origin.
Mocha is the Yemeni port from which coffee (an Arabic word) was first exported in the 12th century.
What about blue jeans? The Academie Francaise resentfully accepts “blue-jean” as a “mot d’origine anglo-americaine” now permanently implanted in the French language. Mais non! The term “jeans” is French, originally Marseille dockside slang for denim-wearing Italian sailors from Genoa (“genes” in French) and brought to English sometime in the 16th century. “Denim” is French, too, literally meaning fabric “from Nimes.”
Earlier: A quick trawl through some modern English-language vocab and their origins, yields small word-pictures of old civilizations and modern neighbors. Some examples:
BBC’s “Vocabularist” notes that “pyramid” was originally a Greek word, meaning a kind of layer-pastry, like baklava. The actual Egyptians apparently called a pyramid a “mer.”
And two language/linguistics sources
How many words are there, actually? Some blathering and hand-waving from the Oxford English Dictionary editors, who term this good question “a distraction”:
“The question ‘How many words are there in the English language?’ cannot be answered by recourse to a dictionary.”
What?! They’re supposed to know! It’s their job! OED editors try to climb out of self-dug hole.
OED’s most recent update, for March 2022, has “nearly 700” newly classified words: first gentleman, burner phone, gender-critical, trigger warning, ydraw (died out in the 1400s), decarbonize, etc. A look at the March updates.
And how many languages? The Summer Institute of Linguistics, originally an evangelical group dedicated to Bible translations, lists 7,151 known languages around the world, from A-Pucikwar (sadly vanished, Andaman Islands, no known relationship to others, said to use only the numbers “one,” “two,” plus some variants of “more”) to Zuni (9,500 speakers, New Mexico) by country and language family.
ABOUT ED
Ed Gresser is Vice President and Director for Trade and Global Markets at PPI.
Ed returns to PPI after working for the think tank from 2001-2011. He most recently served as the Assistant U.S. Trade Representative for Trade Policy and Economics at the Office of the United States Trade Representative (USTR). In this position, he led USTR’s economic research unit from 2015-2021, and chaired the 21-agency Trade Policy Staff Committee.
Ed began his career on Capitol Hill before serving USTR as Policy Advisor to USTR Charlene Barshefsky from 1998 to 2001. He then led PPI’s Trade and Global Markets Project from 2001 to 2011. After PPI, he co-founded and directed the independent think tank ProgressiveEconomy until rejoining USTR in 2015. In 2013, the Washington International Trade Association presented him with its Lighthouse Award, awarded annually to an individual or group for significant contributions to trade policy.
Ed is the author of Freedom from Want: American Liberalism and the Global Economy (2007). He has published in a variety of journals and newspapers, and his research has been cited by leading academics and international organizations including the WTO, World Bank, and International Monetary Fund. He is a graduate of Stanford University and holds a Master’s Degree in International Affairs from Columbia Universities and a certificate from the Averell Harriman Institute for Advanced Study of the Soviet Union.
ESG-oriented investing (Environment/Social/Governance) is a key market-oriented mechanism for using the financial system to assess material risk around generally agreed upon societal goals that go beyond profit-maximization. Environmental goals can include such factors as carbon emissions and water usage. Social goals can include diversity, labor standards, and data protection. Governance goals can include executive compensation and board composition.
Assessing the ESG-related performance of a company or country is an extremely data-intensive enterprise. Investors usually end up relying on one of a number of different companies that provide ESG ratings (also called scores or assessments), such as Sustainalytics (a Morningstar subsidiary) and MSCI (listed on the S&P 500). Parent companies of credit rating agencies (CRA) have also moved into the business of providing ESG scores, even as the credit rating agency arms of those companies increasingly incorporate ESG considerations into their credit ratings with greater transparency and consistency.
Considering how new the practice of non-financial evaluations is, ESG ratings from different firms often give very different results, depending on which measures are factored into the scoring process and how they are prioritized. One study suggested only a 31% correlation between ESG ratings produced by Sustainalytics and MSCI. While divergence of views can often be healthy, this degree of difference suggests a lack of shared data and a lack of agreement about the key drivers of ESG risk. By comparison the credit ratings market — another example of an “information market” — has had much more time to agree on many drivers of credit risk.
We applaud the recent proposal by the SEC to require more disclosure by public companies of climate-related risks. That is a good step that will provide investors with more information, help improve the ESG ratings process, and lead to more robust ESG ratings. We will also be able to better determine the connection between ESG ratings and financial performance.
The SEC is also looking at the potential for conflicts in this new area. The agency’s 2022 staff report on Nationally Recognized Statistical Ratings Organizations (NRSRO) raised questions about credit ratings produced by NRSROs, particularly those with ESG affiliates. The report noted that:
….in incorporating ESG factors into ratings determinations, NRSROs may not adhere to their methodologies or policies and procedures, consistently apply ESG factors, make adequate disclosure regarding the use of ESG factors applied in rating actions, or maintain effective internal controls involving the use in ratings of ESG-related data from affiliates or unaffiliated third parties. The Staff also identified the potential risk for conflicts of interest if an NRSRO offers ratings and non-ratings ESG products and services
The SEC was doing its job by raising these questions of methodology and potential conflicts as part of its regulatory oversight. Notably, the inspections did not produce any evidence of actual problems. Yet these concerns can easily be overstated, as they were in recent articles by the Wall Street Journal and Responsible Investor. It’s important to note that such issues of conflicts of interest and consistent application of methodologies arise in any market for information. In a data-driven world, companies that use data to provide third-party assessments of products, services, and other companies will always be under pressure to modify their assessments by those being assessed or with something to gain from the assessment. As I wrote in a January 2021 policy brief, available on the Progressive Policy Institute website:
In every part of the economy, the Information Age has made an exponentially increasing amount of data available to everyone. The difficult problem is extracting useful signals from the noise, especially when some market participants are actively taking advantage of opportunities to manipulate data, or to create false signals.
The key is to develop a set of processes and incentives that help manage new conflicts of interest. That’s certainly not an insurmountable problem, as the credit ratings agencies have shown. Indeed, credit rating agencies are known for their ability to apply their methodologies in a consistent and transparent fashion. In fact, that’s the essence of their business model. As I wrote in the policy brief:
The agencies assess the creditworthiness of the bonds according to published and detailed methodologies. In fact, there is literally nowhere else in the private sector that gives this level of transparency into the intellectual property of an organization, or that so rigorously documents their internal methodology for making decisions (imagine a newspaper committing itself publicly for how it chooses stories or does reporting, including reporting on advertisers).
True, the credit rating agencies came under criticism for their role in the 2008-2009 financial crisis. But the aftermath of the crisis, SEC oversight of CRAs was greatly increased. As Jessica Kane, then director of the SEC’s Office of Credit Ratings, noted in a 2020 speech: “In the span of 15 years, the credit rating industry has gone from being largely unregulated to being subject to a robust disclosure and examination regulatory regime.” As a result, the CRAs consistently produce strong signals that are useful for market participants. ESG ratings firms should strive to do the same.
The war in Ukraine has relied heavily on information warfare and the struggle to control the global narrative. It has highlighted both the impact that online campaigns can have on international crises, as well as the danger posed by false information on internet platforms. Social media-based disinformation is not the unknown threat it once was, but despite acknowledgement by internet platforms, online users, and American public officials that state-sponsored disinformation was likely to disseminate in the days following the Russian invasion, false claims have succeeded in blunting the world’s overwhelmingly adverse global reaction to Putin’s war. The response to this disinformation makes it clear that while we have learned from some of the mistakes of the past, false claims persist in both online and traditional media. Internet platforms have had to assume a defensive role, and right-leaning American media sources have echoed an online narrative consistent with that of the Russian state, further blurring the line between fact and fiction. Now, as we approach two months since the Russian invasion, it is important to assess what has worked well as a defense against false claims, as well as where state-backed disinformation continues to spread.
Given the familiar history of Russian weaponization of internet platforms for political purposes, the online propaganda offensive is hardly a surprise. In fact, the battle to frame the “special military operation” as essential to Russian security predates the invasion, with the European Expert Association identifying the dissemination of online rumors aimed at justifying the invasion of Ukraine sourced in Russian news media as early as October 2021.
This reality of Russian-backed disinformation on social media is a familiar one for many Americans following the 2016 election, during which at least 10.4 million tweets, 61,500 Facebook posts, and 116,000 Instagram posts were traced back to Russian state actors looking to influence the campaign debate. Since then, the question of how to counter false information online has shaken global politics, from claims of misinformation regarding the pandemic to the question of online censorship. As a result, global governments and online platforms were better prepared to combat disinformation than they have been in past conflicts.
The Biden administration’s decision to get out early and make public intelligence about Putin’s intent to invade Ukraine was hugely successful. It drowned out Russian state propaganda depicting Ukrainian leaders as “Nazis,” threatening Russian security. In early February, President Biden warned of the potential for a false flag operation under which Putin would invade Ukraine in response to some staged provocation. Despite Moscow’s claims that the Ukrainian government had plans to attack separatist regions of the country, the attempts to justify the invasion as a preemptive strike fell flat with a global audience. At the same time, social media posts coming out of Ukraine quickly went viral, leading to an outpouring of international sympathy and solidarity. Russian propagandists could not compete with vivid posts and videos capturing the horrors of war — for example, scenes of conditions in bomb shelters or one video of a Ukrainian vlogger being interrupted by a nearby missile strike. At this point, Russia was clearly losing the “information war.”
However, as the war continues, Russian disinformation has gained more traction online. For example, a map posted on left-wing websites showed recent airstrikes in in Syria, Yemen, and Somalia. Evidently its purpose was to underscore that all conflicts are deserving of progressives’ attention, not just the war in Ukraine. However, the first iteration of the image was posted by Redfish, a company staffed by former employees of the state-run outlet Russia Today. More recently, Moscow has filled social media with bogus claims that Ukraine is developing biological weapons funded by the United States. In fact, these supposedly sinister “biolabs” are a part of a longstanding U.S. program to support public health infrastructure in former Soviet countries. The story gained mainstream attention in the U.S. after the Russian Defense Ministry put out a statement claiming that funding for the biolabs could be traced back to Hunter Biden and George Soros, a preposterous claim that nonetheless has parroted in the U.S. by Fox News’s Tucker Carlson and some popular conservative podcasts.
This echoing of Kremlin propaganda on the Trumpist right shows that much work remains to be done to combat the deliberate pollution of online discourse with lies. The Biden administration should continue to wield accurate U.S. intelligence on what’s happening in Ukraine and in Putin’s ruling circle in Moscow. Washington should also redouble efforts to counter disinformation in countries friendly to Russia, including China, Brazil, and India. Additionally, while the value of an informed public holds its own weight, the urgency is heightened when one considers how the online narrative around the war has shaped real world outcomes. The early surge of online support for Ukraine unified the Western democracies in condemning and calling for tough economic sanctions on Russia and provoked an outpouring of donations to Ukraine from internet users, including $67 million in cryptocurrency.
Particularly considering these implications, moderation of online content and safeguards against state-sponsored propaganda online are critical in controlling the spread of harmful disinformation. U.S. lawmakers should encourage and support social media platforms in stepping up efforts to filter out lies and propaganda and support an ongoing push for media literacy to equip Americans with tools necessary to defend themselves against online disinformation. The recent proliferation of fables such as the Ukrainian American biolabs show that, although platform companies are more aware of and prepared to deal with disinformation than they were in the past, bogus information and conspiracy theories will still get through. The United States, which led the world into the digital age, must now take the lead in separating fact from fiction online.
We wrote “The New Politics of Evasion” to spark a discussion about the future course of the Democratic Party, and we are pleased that Stan Greenberg has responded to it at length. While he agrees with us about the counterproductive stances that Democrats have adopted on cultural and identity issues, he accuses us of constructing a “myth” that keeps us from seeing the working-class voter.
As far as we can tell, Greenberg does not challenge any of the data we presented in a detailed 25-page report to support our picture of the electorate. Still, he flatly rejects our claim that “Most Americans want evolutionary, not revolutionary change,” arguing that “voters are hungry for big change, after decades of spiking economic and political equality.” Perhaps so, although the Democratic Party twice rejected the candidacy of a politician who described himself as a socialist and called for a political revolution. In any event, the electorate’s alleged hunger for big change is the assumption that guided the Biden administration’s first year, with decidedly mixed results. Let us try to analyze our disagreement.
Greenberg’s response to our report begins, oddly, with a history of economic policies during the Clinton administration in which we all served. If Greenberg sees the Clinton administration’s program as evidence that the American people want revolutionary rather than evolutionary change, then our disagreement is merely verbal. And we greatly prefer Greenberg’s take on the Clinton administration to the standard progressive charge that Clinton was a neoliberal shill who gave away the store to multinational corporations while middle-class and working Americans languished.
The subtitle of our article reads “How Ignoring Swing Voters Could Reopen the Door for Donald Trump and Threaten American Democracy.” This points to the analytical source of our disagreement with Greenberg. While he focuses on working-class voters, our “swing” category includes not only the working-class but also moderate, independent, and suburban voters.
In our view, swing voters are those whose votes are not determined by partisan affiliation and who shift between the parties depending on candidates, policies, and circumstances. In 2020, Joe Biden improved over Hillary Clinton’s performance in the suburbs by 9 points, from 45% to 54%; among independents, by 10 points, from 42% to 52%; among moderates, by 12 points, from 52% to 64%. Biden’s gain among white working-class voters was a more modest 5 points, from Hillary Clinton’s dismal 28% showing to a more respectable 33%.
This relatively small swing among white working-class voters was no anomaly. As Greenberg knows as well as anyone, Democrats’ struggles with white working-class voters, the heart of the vanished New Deal coalition, are not of recent vintage. These voters began to break away from the Democratic Party in the late 1960s, moved by discontent over the increasing support within the party for anti-war sentiments, the counterculture, feminism, environmentalism, civil rights, and social policies for minority groups.
The impact of this discontent was immediate and profound. In the 1960 and 1964 elections, white working-class support for Democrats averaged 55%. In the 1968 and 1972 elections, this support fell to 35%. As Ruy Teixeira and Alan Abramowitz put it, after 1972, “the Democrats were the party of the white working class no longer.” In 1980 and 1984, Ronald Reagan averaged 65% of their vote, compared to 35% for Jimmy Carter and Walter Mondale. The last Democrat to get even a plurality of their vote was Bill Clinton. Al Gore lost them by 17 points, John Kerry by 23. Barack Obama lost them by 18 points in 2008 and 25 points in 2012.
This is not an argument for ignoring white working-class voters, who make up above-average shares of the electorate in the key swing states of Wisconsin, Michigan, and Pennsylvania. But it is a reminder that their disaffection from the Democratic Party is deep-rooted and longstanding — and that in the 21st century, other groups of voters are more likely to “swing” in response to positions that the Democratic Party’s coalition embrace.
Joe Biden worked harder to reach white working-class voters than any other Democratic candidate in decades. He emphasized his working-class roots at every turn and campaigned on what he termed a “transformational” economic agenda. As we have seen, he moved the needle, but not much. Democrats’ positions on social and cultural issues limited the impact of their economic agenda for this portion of the electorate, as they have for half a century.
In addition, there is reason to doubt how popular the Democrats’ economic offer to the white working class really was. According to a Marist poll conducted in December 2021, 67% of this group reported receiving $1,400 stimulus payments, but just 17% said that these checks had helped them “a lot.” Thirteen percent received the monthly expanded child credit, but only 4% said that these payments had helped their households significantly. And as of last December, just 32% supported the administration’s Build Back Better bill, versus 43% opposed. Reaction to Build Back Better was muted across most of the electorate, with 41% in favor, 34% opposed, and 25% unsure. The bill did better among suburban voters (51% approval) but worse among Independents (36%). The Marist poll did not provide a breakdown by ideology.
We expected that white working-class voters would be more supportive of the bipartisan infrastructure bill, and they were, with 45% indicating their approval. But even here, they were significantly less favorable than were all voters (56%), whites with college degrees (61%), non-whites (65%) Independents (54%), and suburban voters (67%). In today’s low-trust environment, white-working class voters seem even less likely than other groups to believe that government can improve their lives.
The subtitle of Greenberg’s article summarizes what he terms the “real lesson” for the entire Democratic Party: “Offer a hopeful vision where all Americans make progress.” We could not agree more. Here’s what we said in the concluding section of our report:
“The American people favor policies that expand opportunity and mobility while protecting them against negative economic developments with which individuals and families cannot cope on their own. And they favor fairness, including asking corporations and wealthy individuals to contribute more to build an economy that works for all, not just a favored few. They do not favor limited government as Republicans have long defined it; they want protection against the excesses and inadequacies of the market, but they do not want socialism. The administration should offer policies within this framework, and they should defend them by appealing to these widely held values.”
Although we may disagree with Greenberg on some policy specifics, we see no inconsistency in principle between our message and the “hopeful vision” that he urges the party to offer. And we agree with Greenberg that the Democratic Party’s stance on issues such as crime is getting in the way of this vision. In words that Democrats of all stripes should ponder, he insists that Democrats’ emphasis on systemic racism “doesn’t align with the vision of America as an immigrant country where all ultimately make progress” and alienates Hispanic as well as white working-class voters. He reports that Black voters in his focus groups “want to be part of an American story where their community continues to make progress.” This is consistent with our view.
In the end, we are encouraged by Greenberg’s critique of our report. If the disagreement between center-left and progressive political analysts goes no deeper than this, then we are more unified than we had dared to hope. In the difficult days ahead, Democrats will need all the unity they can get.
On this episode of RAS Reports, Tressa Pankovits, Co-Director of the Reinventing America’s Schools Project sits down with New Mexico State Senator Siah Correa Hemphill and Representative Joy Garratt to talk about a bill they successfully sponsored and passed into law this legislative session. New Mexico House Bill 43 creates a revolving facility fund that charter schools can access in order to provide high quality buildings for their students. In today’s highly polarized environment, with many many lawmakers turning their backs on charters at the behest of the teachers unions, these two Democrats are standing for charter schools and their students and families.
In his State of the Union speech, President Joe Biden called for capping the monthly out-of-pocket spending by patients on insulin to $35 per month. “For Joshua, and for the 200,000 other young people with Type 1 diabetes, let’s cap the cost of insulin at $35 a month so everyone can afford it.” Indeed, the Build Back Better bill calls for setting insulin monthly payments at the lesser of $35 or 25% of the net price including all rebates and discounts, even if the plan’s deductible has not been reached. The “Affordable Insulin Now Act,” introduced by Senator Reverend Raphael Warnock, D-Ga., in the Senate and the companion bill, sponsored by Representative Angie Craig in the House, take a similar approach.
But why stop there? At this time of accelerating inflation and rampant economic uncertainty, it would be both good policy and good politics for Congress and the Administration to consider extending the principle of capped first-dollar co-pays to a broader class of medicines in Part D to treat chronic conditions such as diabetes, asthma, and congestive heart failure, as well as medicines aimed at preventing stroke. These are medicines where regular use translates directly into better health outcomes and lower hospital costs.
In practice, we’re talking about implementing capped, first-dollar co-pays for chronic diseases for Medicare Part D recipients. Why is this good politics? Americans, and in particular seniors, are begging for some relief from rising costs. Not everyone has a chronic condition, but most people know someone (like their parents) who do, and it can be a shock to see how much drugs cost them. Instituting certainty in patient out-of-pocket costs would definitely reduce the level of apprehension.
PPI has long focused on the need to cap co-pays. In October 2019 we put out our trailblazing policy brief, “The Prescription Escalator: The Real Reason Why Americans Pay More for Drugs Each Year, Why They Are So Upset, and What Can Be Done About It.” As part of that brief, we reported that Americans found themselves paying for more and more essential medicines as they aged, many for chronic conditions. That meant they get hit by soaring spending, even if the price of individual medicines didn’t change much.
Originally, the idea behind deductibles and co-insurance — co-pays that are a percentage of the list price — was to give patients some skin in the game. If they absorbed a share of the cost, the theory went, they would be more likely to seek out the lowest cost medicines.
But forcing patients to bear a flexible share of costs hasn’t worked out as expected, especially for Medicare Part D recipients. Because of perverse incentives in Part D, drug insurance plans, pharmacies, PBMs, and manufacturers gravitated towards setting high list prices, offset by huge rebates and discounts. One result was low net prices for payers, which is good.
The downside is that co-insurance is usually based on the inflated list price, so consumers don’t see the “true” net prices. Similarly, before consumers meet their deductible, they are paying list price. In either case, consumers can be hit by out-of-control costs that have nothing to do with true net prices.
A policy of capping co-pays starting at the first dollar for medicines to treat chronic disease is a straightforward way of offering certainty to the patients who need it the most—those who need their medicines just to survive. And they don’t balance the budget on the backs of those in ill-health. Moreover, when patients fill and take these chronic meds regularly, it avoids spikes in hospital and other health costs.
How much will the co-pay caps cost, and who pays? Given the massive redesign of the Part D program that is also part of Build Back Better, it’s tough to say for sure. The government would have to ante up some additional subsidies, but the cost of capping co-pays would be reduced because the redesign would eliminate the coverage gap which is now part of Part D and which produced some huge patient payments. In addition, the redesign would limit out-of-pocket payments to $2,000 annually across all drugs, and a number of drugs would be chosen for price negotiation by the government. For medicines selected for price negotiation, the subsequent lower cost to Part D would greatly help to offset reduced patient cost sharing. And for competing medicines not selected for negotiation, insurance companies and PBMs will have bargaining leverage to command higher rebates, similarly reducing net prices and also helping to offset costs of better patient access.
This is the right time now to extend Biden’s insulin proposal to other medicines for chronic conditions. Capping co-pays for medicines that older Americans have to take is the quickest and most direct way to introduce more certainty into an uncertain economy.
Today, the Progressive Policy Institute (PPI) released the following statements on the Senate confirmation of Ketanji Brown Jackson as Associate Justice of the United States Supreme Court:
“The Progressive Policy Institute congratulates Judge Kentanji Brown Jackson for her elevation to the U.S. Supreme Court. Her bright legal mind and even judicial temperament have earned her wide acclaim throughout a distinguished legal career. That 47 Republican Senators voted not to confirm her for no reason other than the most reflexive and dishonest kind of partisanship is all that mars this otherwise happy civic ceremony. We thank President Biden for nominating Justice Jackson and look forward to seeing her on the bench,” said Will Marshall, President of the Progressive Policy Institute.
“The importance of this confirmation cannot be overstated. Judge Ketanji Brown Jackson is one of the most qualified candidates ever to be nominated to the highest court in the land. She will make history as the first Black woman to serve on the Supreme Court,” said Jasmine Stoughton, Program Manager of PPI’s Mosaic Economic Project.
The Mosaic Economic Project is a network of diverse women with expertise in the fields of economics and technology. Mosaic programming aims to bring new voices to the policy arena by connecting cohort members with opportunities to engage with top industry leaders, lawmakers, and the media.
The Progressive Policy Institute (PPI) is a catalyst for policy innovation and political reform based in Washington, D.C. Its mission is to create radically pragmatic ideas for moving America beyond ideological and partisan deadlock. Learn more about PPI by visiting progressivepolicy.org.
In Washington, presidents and lawmakers come and go, but special interests dig in and never leave. They love to burrow into the sprawling federal bureaucracy, where they can stealthily wreak havoc on laws they don’t like.
If you want to catch these bureaucratic gremlins at work, take a look at the U.S. Education Department (ED). On March 14, ED proposed new regulations aimed at retarding the spread of public charter schools, despite growing public demand for them. During the pandemic, enrollment has declined in conventional K-12 schools, while charter schools have long waiting lists — around 50,000 children in New York City alone.
The target of this bureaucratic sabotage is one of President Clinton’s trademark innovations, the 1994 Federal Charter School Program (CSP). While state and local governments are chiefly responsible for operating elementary and secondary schools, CSP acknowledges a vital national interest in ensuring that all of America’s children, regardless of their socioeconomic status, have access to a world-class public education.
Unfortunately, that’s not the case today. The nation’s poor communities have too many substandard schools, as reflected in stubborn achievement gaps by race and ethnicity. Judging by U.S. students’ underwhelming performance on international reading, math and science tests, mediocrity also abounds in many of our suburban schools.
Every American earthworm north of the Mason-Dixon Line is an alien invader.
THE NUMBERS:
Number of identified North American species:* ~160,000
Number of “invasive species” in North America: ~6,500
* Not counting nematodes, microorganisms, or flatworms.
WHAT THEY MEAN:
The gardener loves him/her*; the northern forestry manager fears him/her. A worried observation from the Minnesota Department of Natural Resources:
“All of the terrestrial earthworms in Minnesota are non-native, invasive species from Europe and Asia. … [A]t least seven species are invading our hardwood forests and causing the loss of tree seedlings, wildflowers, and ferns.”
A hundred native North American worm varieties happily navigate the red and black earth of the American south, and a few more cling on in the Pacific Northwest. In Canada, New England, Pennsylvania, and the upper Midwest, though, the last Ice Age froze off the local worms above a latitude roughly matching that of the Mason-Dixon Line.** The 15 or so worm species common in these parts now are all descendants of European worms brought in after the Mayflower landing. As such, they are “invasive species,” spreading north and west at a pace of about 50 feet per year, and forestry science views them as dangerous pests. Eating off the forest “duff layer” of dead leaves and organic matter as they go, the Euro-worms trigger a long and depressing chain of events: soil compaction, loss of small forest plants and tree seedlings, decline of native orchids and wildflowers, reduction of habitat for small animals, slower forest regeneration, increased vulnerability to pests, ultimately “a grave threat to the biodiversity and long-term stability of hardwood forest ecosystems.”
Dollying up and back for a robin’s-eye view of the matter, the 15 worms are one group of many invaders. Excluding microbes, flatworms and nematodes — not because they don’t matter, but they’re hard to count — North America is home to about 165,000 species of animals, fungi, and plants. Ignoring the traditional kingdom/phylum/order courtesies, they are arranged as follows:
Ignoring the traditional kingdom/phylum/order courtesies, they are arranged as follows: 90,000 insects; 45,000 fungi; 17,000 plants; 8,000 arachnids; 4,261 vertebrates (including 2,400 fish, 900 birds,442 mammals, 382 reptiles, and 261 amphibians); 1,600 crustaceans; 1,300 coelenterates (e.g. jellyfish, corals, and sea anemones), 755 mollusks, and 115 worms.
About 6,500 of these species by the U.S. Geological Survey’s estimate are newcomers, termed “invasive,” as they arrived after 1492. Celebrated examples include the Japanese kudzu vine in the Southeast, the Black Sea’s zebra mussel in the Great Lakes, the Southeast Asian snakehead fish in the Potomac and Chesapeake, the British starling everywhere but Canada, the Burmese pythons multiplying in the Everglades, the Argentine ants crawling up the California coast, and the very recent arrivals of “murder hornets” and Joro spider from Japan and Korea. Together they are said to cause roughly $20 billion in annual damage to the U.S. economy; the United States Geological Survey (USGS) believes that the “current annual environmental, economic, and health-related costs of invasive species exceed those of all other natural disasters combined.”
What, if anything, can be done about this? “Prevention” options are ideal, including laws banning deliberate introduction of alien species; inspection, sterilization, and quarantine rules at seaports and air terminals; and regulations requiring ships arriving from overseas to dump ballast water in mid-ocean and exchange it for sterile water as to prevent further introductions of shallow-water mollusks, worms, and crustaceans to new habitats. Attempts to extirpate the invaders after arrival, though, are at best partial defenses and sometimes hopeless; the U.S. Geological Survey sadly says that “the odds of eradicating an introduced population of reptiles once it has spread across a large area are very low,” and the worms are another example, as they advance, a foot or two every month, further into the northern woods.
* Per the National Wildlife Federation, “Earthworms are hermaphrodites, meaning an individual worm has both male and female reproductive organs.”
** Drawn by two 18th-century surveyors, Charles Mason and Jerry Dixon, to mark Pennsylvania’s border with Maryland and West Virginia.
In Hawaii, 282 of 1,100 native species are threatened or endangered. Hawaii’s Invasive Species Council cam be found here.
A global invasive species database, including a list of the top 100 invasive-species threats worldwide.
For an international comparison, New Zealand’s quarantine system.
At sea: The International Maritime Bureau explains the International Ballast Convention, an agreement meant to prevent transcontinental movements of shallow-water clams, shrimp, mussels, fish, and other animals via ballast-water, which entered into force in 2017.
Damages: A French survey tries to estimate the cost of invasive species worldwide, reviewing 1,900 local estimates to arrive at a guess at $1.3 trillion worldwide since 1970; annual costs have steadily escalated to about $167 billion per year as of 2017. The most costly invasions are those of malarial mosquitoes, rats, cats, fire ants, and termites.
And some invaders, with estimated dates of entry
Spiders (2013): A University of Georgia release on the Joro spider, full of gleefully mock-reassuring innuendo (they are “relatively harmless to people,” and “their fangs are often not large enough to break human skin”).
Worms (~1600): Detail from the University of Minnesota on worms and the northern forest:
The non-native worms consume the duff (leaf litter) layer of forest floors as they eat their way across the continent’s forests from thousands of points of introduction, initially by European settlers and more recently by their use as live fishing bait. The worms alter the physical and chemical properties of soils, changing the pH, nutrient and water cycles, and disrupting symbiotic relationships between soil fungi and roots (mycorrhizas). The earthworms also amplify the negative effects of droughts, warming climate, and deer grazing on native plants, [UMinn Research Associate Lee] Frelich said. “Many native plant species, such as trillium and native orchids, cannot thrive under these changed circumstances.” Conversely, the worms literally prepare the soil for non-native plants from Europe, which are co-evolved with the earthworms on their home continent, including buckthorn, garlic mustard, Japanese barberry [ed. – obviously not a ”European” plant, but still an invader], tatarian honeysuckle, and hedge nettle.
The U. of Minn. reports on earthworm risk and damage to northern forests.
Birds (1890): The starling was introduced by Gilded Age New Yorker Eugene Schieffelin, a pharmaceutical magnate and Bronx Zoo donor, who brought a flock of about 120 birds from England in 1890 as part of a scheme to introduce all of the 64 bird species found in the plays of William Shakespeare to Central Park. Most of his skylarks, thrushes, and so forth died off. Starlings thrived, to the detriment of local bluebirds and woodpeckers; Schieffelin’s original cageful has grown to 200 million across North America. Smithsonian Magazine explains here.
Snakes (1942 for the brown tree snake in Guam, ~1980 for the Burmese python in the Everglades): The brown tree snake, native to the Solomon Islands, was accidentally introduced to Guam during World War II, apparently in the wheel wells of military aircraft. Within fifty years it had wiped out 10 of Guam’s 13 native birds, 2 of its 3 mammals, and 6 of its 12 lizards. USGS comment:
The impacts of these introduced species, and particularly the brown Treesnake, are so severe that they have been compared to and found to have more lasting effects on the ecological diversity of an island ecosystem than did the naval bombardment and leveling of forests that occurred on Guam during World War II.
Burmese pythons are a more recent migrant, first found in the Everglades in the mid-1980s, and now number “in the tens of thousands.” The U.S. Geological Survey notes that Florida is home to 53 invasive reptiles, and says “the odds of eradicating an introduced population of reptiles once it has spread across a large area are very low.”
A more optimistic take from National Geographic, as the pythons find a foe in the egg-eating native bobcat.
ABOUT ED
Ed Gresser is Vice President and Director for Trade and Global Markets at PPI.
Ed returns to PPI after working for the think tank from 2001-2011. He most recently served as the Assistant U.S. Trade Representative for Trade Policy and Economics at the Office of the United States Trade Representative (USTR). In this position, he led USTR’s economic research unit from 2015-2021, and chaired the 21-agency Trade Policy Staff Committee.
Ed began his career on Capitol Hill before serving USTR as Policy Advisor to USTR Charlene Barshefsky from 1998 to 2001. He then led PPI’s Trade and Global Markets Project from 2001 to 2011. After PPI, he co-founded and directed the independent think tank ProgressiveEconomy until rejoining USTR in 2015. In 2013, the Washington International Trade Association presented him with its Lighthouse Award, awarded annually to an individual or group for significant contributions to trade policy.
Ed is the author of Freedom from Want: American Liberalism and the Global Economy (2007). He has published in a variety of journals and newspapers, and his research has been cited by leading academics and international organizations including the WTO, World Bank, and International Monetary Fund. He is a graduate of Stanford University and holds a Master’s Degree in International Affairs from Columbia Universities and a certificate from the Averell Harriman Institute for Advanced Study of the Soviet Union.
The Progressive Policy Institute (PPI) released a new paper today urging lawmakers to invest in better pandemic preparedness infrastructure ahead of the next global pandemic. While legislation has been introduced in Congress, it has not yet been approved. Legislation should address the needed domestic manufacturing, data collection, and whole-of-government response another pandemic would require. The report is titled, “COVID-19 retrospective: What have we learned and how can we better prepare for future pandemics?” and is authored by Arielle Kane, Director of Health Care for the Progressive Policy Institute.
The legislation lawmakers have introduced to address the weaknesses in the United States’ pandemic preparedness is a good first step. The U.S. needs more resilient infrastructure, nimble manufacturing, and much faster responding government. The government needs to plan strategically to prepare for the next pandemic rather than just reacting to COVID-19. With so much uncertainty surrounding pandemics, it will be paramount that the government works to partner with industry to be more agile in evolving situations,” writes report author Arielle Kane. “The next pandemic is unlikely to look like COVID-19. This is why it is important that the government invest in strategies and infrastructure that will allow for a more nimble response.
The Progressive Policy Institute’s report looks back at the U.S. response to COVID-19, examining the shortcomings and successes of the national response. It also provides a series of six recommendations policymakers can take now to help the U.S. be better prepared and more resilient to pandemic, health, or biological threats in the future. These recommendations include: Better communication and coordination across government; bolstering U.S. supply chain manufacturing; improving data infrastructure; investing in R&D and pandemic preparedness; supporting broader population health; and developing infrastructure that includes genomic surveillance, like wastewater and air quality testing.
Read the full report here:
The Progressive Policy Institute (PPI) is a catalyst for policy innovation and political reform based in Washington, D.C. Its mission is to create radically pragmatic ideas for moving America beyond ideological and partisan deadlock. Learn more about PPI by visiting progressivepolicy.org.