Four Ways the Pharma Sector is Performing Well, Four Big Problems, and Three Straightforward Solutions
In this paper we summarize the state of today’s pharma sector with four ways it is performing well and four big problems.
Then we propose three key policy proposals that the Biden Administration can use to address the problems:
- A cap on out-of-pocket costs, including co-pays, similar to legislation proposedin 2018, should dramatically improve Americans’ experiences with drug pricing.
- A shift to point-of sales rebates should benefit consumers and align their incentives with actual net prices.
- Building on the successful rapid creation and testing of the Covid vaccines, President Biden should convene a high- level “Biopharma Regulatory Improvement Commission” to accelerate pharma innovation and deployment in order to boost health and cut costs.
EXECUTIVE SUMMARY
The U.S. pharmaceutical industry is one of the nation’s crown economic jewels. It is also one of its knottiest policy problems. The pandemic performance of U.S. pharma companies, working in concert with global partners, has been nothing less than outstanding. Producing multiple safe and efficacious vaccines in less than a year is a testament to the expertise and capabilities of the industry.
On the other hand, Americans have a deeply held distrust of the pharma industry. A Gallup survey taken in summer 2020 still showed the pharmaceutical industry at the bottom of the American approval list, ahead of only the federal government. True, that’s a gain over the previous year, when it was literally rock bottom, but it still isn’t good.
In this paper, we identify four ways that the U.S. pharma sector is performing well, and four big problems (Summary Table 1). Some of them are surprising, in a positive sense. For example, despite all of the headlines about cost pressures, overall spending on pharmaceuticals has been slowly dropping as a share of GDP. Pharma manufacturers revenues, net of discounts and rebates, fell from 1.75 percent of GDP in 2010 to 1.66 percent in 2019 (based on IQVIA Institute data). Also surprisingly, household out-of-pocket expenses for prescription drugs, including Part D premiums, fell from 0.36 percent of GDP in 2010 to 0.32 percent in 2019 (based on national health expenditures data from the Centers for Medicare and Medicaid).
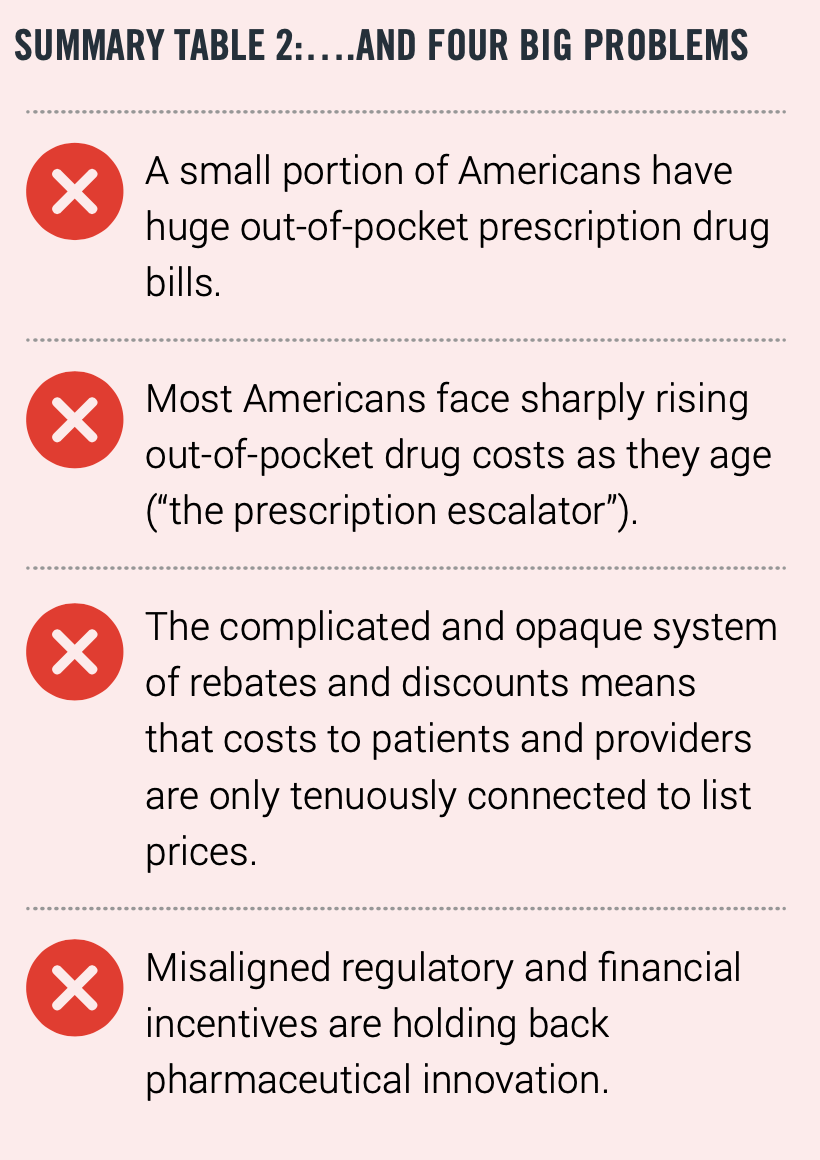
On the negative side, a small portion of Americans have huge out-of-pocket prescription drug bills. In 2018, roughly 1 percent of Americans paid more than $2,000 in out-of- pocket drug expenses, not including Part D premiums (based on our analysis of Medical Panel Expenditure Survey data).
Equally worrisome, most Americans face sharply rising out-of-pocket drug costs as they age. This “prescription escalator”—the result of a steep age-usage curve and per-prescription copays— has the effect of increasing individual spending by 5-6 percent per year, even if underlying drug prices are flat.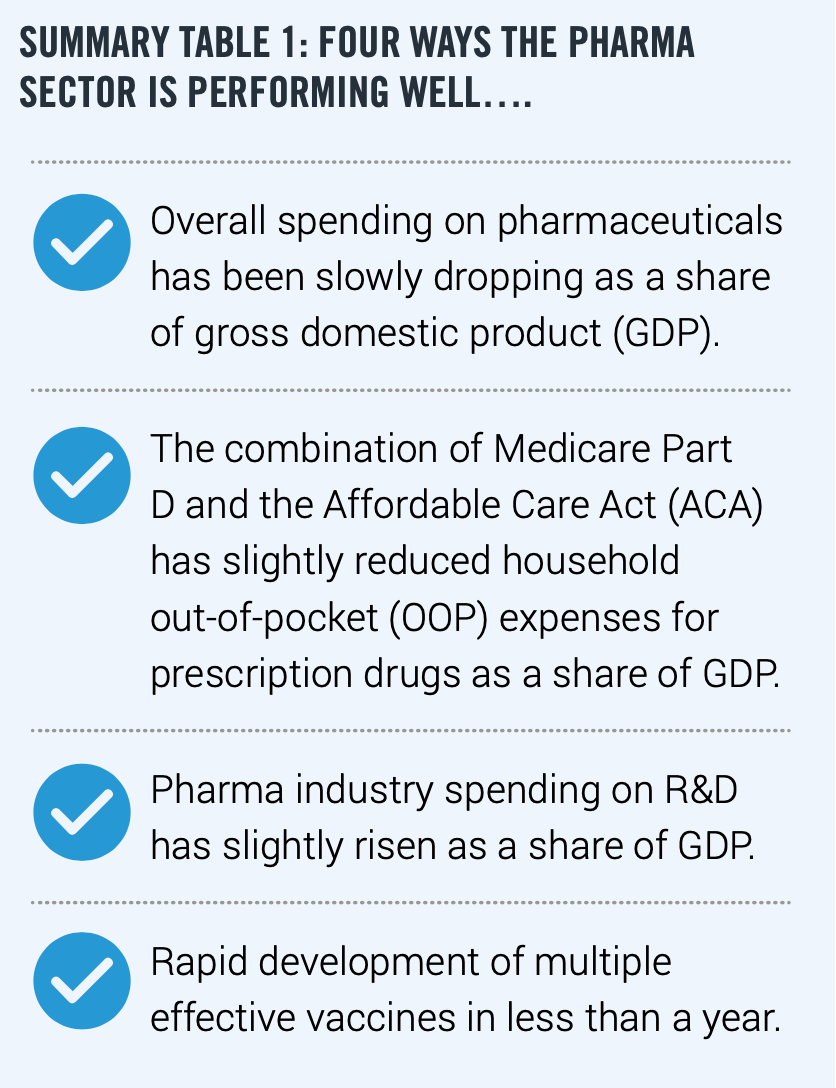
How can President Joe Biden address these problems, while taking advantage of the good features of the U.S. system? To address the political and human toll of the current system of pharma insurance, Biden should support legislation to cap out-of-pocket drug payments. That’s the best way to control the low but real possibility of huge out-of-pocket payments. It’s also the best way to get a handle on the “prescription escalator”—the sharp rise in out-of- pocket payments as Americans age.
Second, Biden should preserve the recently finalized Medicare Part D Rebate Rule that replaces drug rebates with point-of-sale consumer discounts. Discounts paid directly to consumers at the point of sale, rather than rebates paid retrospectively to insurers or pharmacy benefit managers, would significantly lower out-of-pocket costs, clarify the true cost of prescription medications, and allow consumers and physicians to make better cost-benefit trade-offs. The would also be a good launching pad towards the introduction of new legislation to enact similar changes in the commercial market. Together, these changes would fix the opaque rebate system and could create the conditions for list prices to come down.
Third, Biden should take a page from the successful Covid vaccine effort. U.S. businesses and government agencies have spent almost $2 trillion since 1995 on biotech and other health-related R&D, and this knowledge was mobilized quickly to generate new vaccines and therapies. Still, in the normal course of business it would have taken years rather than months to bring the new technology to bear. What’s needed is a high-level “Biopharma Regulatory Improvement Commission” to identify the regulatory and financial impediments to faster useful biopharma innovation, without sacrificing safety at all.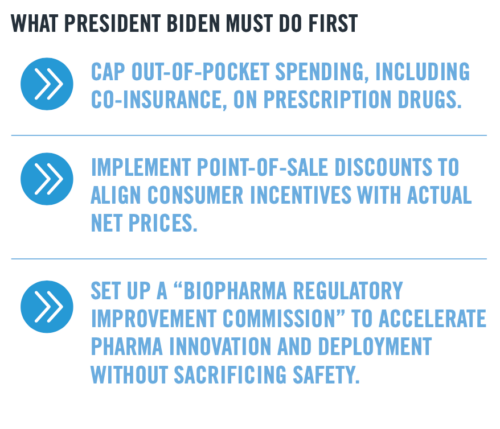
INTRODUCTION
The U.S. pharmaceutical industry is one of the nation’s crown economic jewels. It is also one of knottiest policy problems faced by Washington. The pandemic performance of US. pharma companies, working in concert with global partners, has been nothing less than outstanding. The production of multiple safe and efficacious vaccines in less than a year is a testament to the expertise and capabilities of the industry.
On the other hand, Americans have a deeply held distrust of the pharma industry. A Gallup survey taken in summer 2020 still showed the pharmaceutical industry at the bottom of the American approval list, ahead of only the federal government. True, that’s a gain over the previous year, when it was literally rock bottom, but it still isn’t good.
President Joe Biden comes into office with a comprehensive plan for dealing with what he calls “runaway” drug prices, including establishing an independent review board to assess the value of new drugs, and limiting list price increases for all brand, biotech, and “abusively priced” generic drugs to the rate of inflation.
But Biden’s plan may be aiming at the wrong targets. The two best aggregate measures of the economic burden of pharma spending— overall net spending on pharmaceuticals as a share of GDP and household out-of-pocket drug spending, including Part D premiums, as a share of GDP—have been trending down, not up.
Proposals to restrain list prices are not likely to accelerate these aggregate declines. List prices are important, but because of rebates and discounts they do not directly correlate payments to manufacturers or with out-of-pocket spending by households.
While proposals to restrain list prices may be helpful for patients lacking insurance, and among those in plans with high deductibles and coinsurance, list prices do not typically reflect the price that most patients pay out of pocket due to the impact of rebates and discounts on plan benefit designs.
True, an increasing share of prescriptions are reimbursed by means of co-insurance, which apparently sets the out-of-pocket cost for a drug as a fixed percentage of the list price for that drug. But even then, remember that insurance companies control that apparently fixed percentage and can easily raise it any time they want. As a result, lowering the list price of a drug might or might not decrease the out-of-pocket cost, depending on how the insurance company adjusts the cost-sharing arrangements.
The real problem lies in the way the drug reimbursement system has evolved over the years, exposing Americans to co-pays that seemingly shift randomly from year to year, a small portion of Americans have huge out- of-pocket prescription drug bills, which is bad enough. Most Americans face sharply rising out-of-pocket drug costs as they age (“the prescription escalator”). In some ways the drip- drip of drug co-pays is a form of psychological torture.
To address the political and human toll of the current drug reimbursement system, Biden must support legislation to cap out-of-pocket drug payments. One model is the Capping Prescription Costs Act of 2018, introduced
by Sens. Elizabeth Warren (D-Mass.) and Ron Wyden (D-Ore.) which set caps for prescription drug copays at $250 per month for individuals and $500 per month for families. That’s the best way to control the low but real possibility of huge out-of-pocket payments. It’s also the best way to get a handle on the “prescription escalator”— the sharp rise in out-of-pocket payments as Americans age.
Equally important, Biden should support the implementation of the Medicare Part D rebate safe harbor final rule and propose follow-on legislation that would encourage point-of-sale discounts in the commercial market as well. These discounts would finally reach consumers directly (instead of insurers or pharmacy benefit managers). From an economic perspective, this approach has several virtues. It can lead to a substantial reduction in out-of-pocket costs at the point of sale, clarify the true cost of prescription medications, allow consumers and physicians to make better cost-benefit trade- offs. Importantly, it would ensure that patient coinsurance is based off of net prices (vs list prices), which is far easier for everyone to understand.
Finally, Biden should learn a lesson from the successful Covid vaccine effort. The mRNA vaccines from Pfizer and Moderna show
that with the right motivations, advanced biotechnology that might have otherwise languished on the shelf can innovate and createbeneficial medicines.
What we need now is a focused effort to get most useful drug innovations out of the almost $2 trillion that businesses and government agencies have spent in the U.S. on health- related R&D since 1995. With the successful Covid vaccine effort as a role model, what’s needed is a high-level “Biopharma Regulatory Improvement Commission” to identify the regulatory and financial impediments to useful innovation.
THE FACTS: HOW THE PHARMA SECTOR IS PERFORMING WELL
Before addressing policy changes, we must understand what’s working and what isn’t about the sprawling system of drug innovation, spending, and reimbursement. The common belief is that drug spending is out of control. But a reality-based analysis, based on solid statistics, paints a very different picture.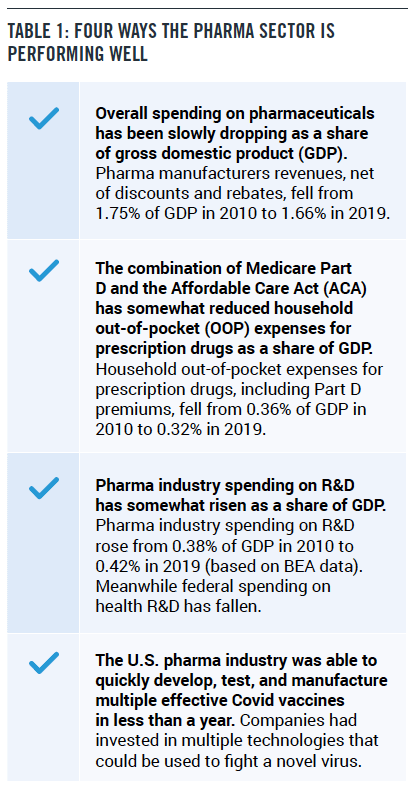
Let’s briefly go through each of these:
» Positive Fact #1:
Overall net spending on pharmaceuticals has been slowly dropping as a share of gross domestic product (GDP).
Net spending on pharmaceuticals is defined as the net amount that drug manufacturers receive for their products, after accounting for rebates and other price concessions. The difference between drug spending calculated with list prices vs net prices is huge and growing. In 2019, for example, the IQVIA Institute estimated that the net revenue received by manufacturers of $356 billion was 47 percent below drug spending valued at list prices, $671 billion. By comparison, this gap between net revenues and spending valued at list prices was only about 37 percent in 2014 and 34 percent in 2010.
Net revenues as a share of gross domestic product (GDP) are a good measure of the burden of pharmaceutical spending on the overall economy, representing the amount paid to manufacturers. Since 2010, net manufacturer revenue has increased by 36 percent, compared to a 48 percent increase in overall gross domestic product. As a result, net manufacturer revenue as a share of GDP fell from 1.75 percent of GDP in 2010 to 1.66 percent in 2019.
What this information tells us is that the overall burden of drug spending on the economy— consumers, private companies, government, hospitals, insurance companies, wholesalers, pharmacy benefit managers—has been falling slightly. But analyzing the impact on any particular market participant is very difficult, because the discounts and rebates are so opaque.
» Positive Fact #2:
The combination of Medicare Part D and the Affordable Care Act (ACA) has slightly reduced household out-of-pocket (OOP) expenses for prescription drugs as a share of GDP.
You wouldn’t know it from all the Congressional hearings that feature Americans having trouble paying for drugs. But on average, the drug cost burden on households has been falling over time, measured as a share of household income or GDP. That’s true, even if we include Medicare Part D premiums when calculating out-of-pocket spending, since from the perspective of Part D participants their premiums also come out of their pockets.
Based on the latest CMS data, released in December 2019, household out-of-pocket expenses for prescription drugs, including Part D premiums, fell from 0.36 percent of GDP in 2010 to 0.32 percent in 2019. Other data sources, such as the Consumer Expenditure Survey from the Bureau of Labor Statistics, show roughly the same pattern.
These figures measure the average burden on households. As we will see later, there are outliers who have to pay much more. But at least the aggregate data is positive.
» Positive Fact #3:
Pharma industry spending on R&D has slightly risen as a share of GDP.
One of the great paradoxes of the U.S. health care system is the poor perception many Americans have of the pharmaceutical industry. Nevertheless, pharma companies have been taking on more of the financial burden and risk-taking associated with drug research and development over the past decade, even while public sector funding has stagnated. Since 2010, federal and state spending on health-related R&D, mostly through NIH, has only risen by 7 percent, from $35.2 billion in 2010 to $37.6 billion in 2019.
The pharma industry spending on R&D items such as pre-clinical drug development and clinical trials has skyrocketed, from $57.3 billion in 2010 to $89.8 billion in 2019, according to figures from the Bureau of Economic Analysis (BEA). This corresponds to an increase of 57 percent, faster than the 48 percent gain in GDP over the same period. As a result, pharma industry spending on R&D rose from 0.38 percent of GDP in 2010 to 0.42 percent in 2019 (based on BEA data).
» Positive Fact #4:
The U.S. pharma industry was able to develop safe and efficacious vaccines within a year
Using a variety of different approaches, pharma firms in the United States and around the world were able to create safe and effective vaccines in less than a year. First out of the gate were Pfizer and Moderna with their mRNA-based vaccine technologies, never before successfully used for a vaccine. However, other vaccines using more familiar technologies are not far behind.
But the big advantage of mRNA vaccine technology is that it can be quickly adjusted to new variants of Covid. Moreover, now that the technology has been shown to be effective, it has the potential to quickly create vaccines against other viral scourges, such as influenza and HIV. So the silver lining from the Covid cloud is that it may have opened up new avenues for dealing with disease.
WHERE THE PROBLEMS ARE
We certainly don’t want to leave the impression that the pharma sector and pharma pricing are free of blame. An honest approach also tells us where four big problems are, as shown in Table 2.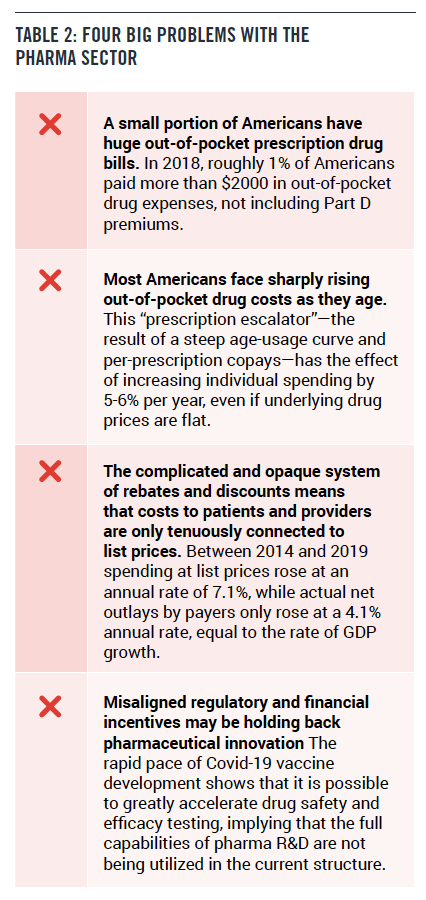
» Negative Fact #1:
A small portion of Americans have huge out-of-pocket prescription drug bills.
One staple of the drug price debate are congressional hearings that highlight heartbreaking stories of people who can’t afford to pay for their medicines. Are these people reflective of a broader problem?
The answer is yes and no. In fact, our analysis of 2018 MEPS data suggests that over 3 million Americans paid more than $2000 in out-of- pocket drug expenses in 2018, not including Part D premiums. That’s about 1 percent of the population, but it’s still an unacceptably high number that need to be addressed by policymakers.
Consider the high cost of insulin, a product with huge rebates. Indeed, rebates for insulin products often reach as much as 70 percent of the list price, so the net price after rebates is much lower than the list price. However, those rebates are typically paid to the health insurance company or the prescription benefit managers (PBM), rather than to the consumer.
As a result, patient coinsurance is often based on the list price, while high manufacturer rebates are collected by insurers. At the same time, benefit designs that place even higher out-of-pocket burdens on patients continue to grow, exacerbating affordability challenges for patients.
» Negative Fact #2:
Most Americans face sharply rising out-of- pocket drug costs as they age.
In addition to the small but significant fraction of the population with high out-of-pocket costs, the widespread anger of Americans at drug companies is fueled by what we call the “prescription escalator.”
It turns out that the use of medicines can rise steeply as people age. For example, in 2018, individuals between the ages of 35 and 44 filled an average of 7.2 prescriptions, including refills, compared to an average of 12.2 prescriptions for those between the ages of 45 and 54 and 18.1 prescriptions for those between the ages of 55 and 64. This 150 percent increase in the number of prescriptions as people age corresponds to an equivalent rise in prescription drug spending, since the structure of health insurance generally charges co-pays for each prescription. This “prescription escalator”—the result of a steep age-usage curve and per-prescription copays—has the effect of increasing the typical individual’s spending by 5-6 percent per year, even if underlying drug prices are flat.
Indeed, even if underlying drug prices are flat, most Americans see their drug spending rise year after year much faster than other types of medical spending. As a result, the share of out- of-pocket spending going to drugs increases as Americans age, making it seem like drug costs are more of a burden.
» Negative Fact #3:
The complicated and opaque system of rebates and discounts means that costs to patients and providers are only tenuously connected to list prices.
We have decent measures of how much consumers pay for drugs through various surveys. We also have good measures of how much pharma manufacturers receive in net revenues, because that number is reported on financial statements. But the flows of money back and forth through PBMs, insurance companies, and hospitals are much more opaque. The rebates and discounts are not simply a percentage of the price. Sometimes they are tied to volume, sometimes to the efficaciousness of the drug, and sometimes they are mandated by law. Much of the time, they are not public.
However, it’s clear that list prices bear only the slightest resemblance to the actual net costs. On an aggregate level, between 2014 and 2019 spending at list prices rose at an annual rate of 7.1 percent, far faster than GDP growth. Meanwhile, actual net outlays by payers only rose at a 4.1 percent annual rate, equal to the rate of GDP growth (based on data from the IQVIA Institute).
The lack of connection between list and net prices makes it very hard for consumers, doctors and policymakers to understand the true cost of drugs.
» Negative Fact #4:
Misaligned regulatory and financial incentives may be holding back pharmaceutical innovation.
Before the Covid pandemic, there was a sense among economists that the enormous spending on biopharma basic and applied research had underperformed. The promise of biotech had been cheaper, faster drug development and a raft of new cures. Instead, the cost of drug development had soared, and only 14 percent of drugs that enter clinical trials get approved.
There are three leading hypotheses, all of which may have some degree of truth:
- The intricacies of medicine and the human body are more complicated than first thought.
- The desire for profits could be diverting biopharma firms from truly important drug development.
- Excessive or misdirected regulation could be raising drug development costs and slowing down biotech innovation.
Facing pressure from the pandemic, regulators and manufacturers were able to work together to greatly accelerate the pace of Covid-19 vaccine development, innovating to bring new technologies into the market without compromising drug safety and efficacy testing. Companies developed vaccines and tested them, even while building manufacturing facilities. The government issued fixed-price contracts for millions of doses to transfer risk to Washington, which could bear it.
As everyone knows, the process produced several successful vaccines. This implies that the full capabilities of private and public R&D are not being utilized in the current regulatory and financial structure.
IMPLICATIONS FOR POLICY
Americans deal with a very complicated reimbursement scheme for drugs, where the list price has very little connection with either the net price that manufacturers receive, or the out-of-pocket expenses paid by patients. Some out-of-pocket costs are set as a percentage of the list price in terms of co-insurance, but that’s variable as well, since the insurance companies can adjust the co-insurance percentage when they set up their plans each year.
To meaningfully improve prescription drug affordability, President Biden should pursue reform of plan benefit designs that directly reduces out-of-pocket costs for consumer. Capping out-of-pocket costs, for example, is both relatively simple and delivers significant political bang for the buck.
One particular model is the Capping Prescription Costs Act of 2018, introduced by Sens. Elizabeth Warren (D-Mass.) and Ron Wyden (D-Ore.) which set caps for prescription drug copays at $250 per month for individuals and $500 per month for families. That’s the best way to control the low but real possibility of huge out-of-pocket payments. It’s also the best way to get a handle on the “prescription escalator”—the sharp rise in out-of-pocket payments as Americans age.
How expensive would this or a similar program be? Suppose our target was to hold annual out-of-pocket costs down to $2000 per year for individuals. Based on our analysis of 2018 MEPS data, that cap would cost $2.4 billion annually for people 65 and over, less than 3 percent of total expenditures by Medicare Part D, the prescription drug benefit program, net of rebates.
As a complementary effort, President Biden should preserve the recently finalized Medicare Part D Rebate Rule that replaces drug rebates with point of sale consumer discounts. Such discounts would be paid directly to consumers rather than to insurers or pharmacy benefit managers. Such a program would have several effects. First of all, the rebates on expensive drugs would actually benefit the patients taking those drugs. That’s what Americans really want.
Point-of-sale consumer discounts would also clarify the true cost of prescription medications and allows consumers and physicians to make better cost-benefit trade-offs. And it would largely address the problems associated with the disconnect between list and net prices. An opaque system does not foster good decision- making. Finally, the Medicare Part D Rebate Rule could also serve as a launching pad towards similar legislation in the commercial market.
Finally, Biden should help regulators and companies learn the right lesson from the successful Covid vaccine effort. The biopharma sector had an enormous stockpile of knowledge and manufacturing know-how that mobilized quickly to generate new vaccines and therapies. The government supported the effort with funding and fixed-price contracts to buy hundreds of millions of doses of the still-yet unproven vaccines. While there are issues with distribution, the development and production worked as well as could be expected.
Still, under the usual regulatory framework and business decision-making it would have taken years rather than months to bring the new technology to bear. The FDA has its usual step-by-step procedures which tend to discourage disruptive but potentially beneficial innovations. Pharmaceutical manufacturers, which invest huge amounts in R&D, are naturally attuned to the regulators and the need to focus on drugs that will get through the approval process.
Biden should appoint a high-level “Biopharma Regulatory Improvement Commission” to identify the regulatory and financial impediments to faster useful biopharma innovation. PPI has in the past proposed a new approach to improve regulations without sacrificing consumer and worker protection. Such legislation has been introduced several times in Congress.
What Biden needs now, though, is a commission that is narrowly focused on finding a way to accelerate biopharma innovation, without sacrificing an ounce of safety. At the end of the day, the best way to reduce the cost of medications may be to improve the ease of innovation.